Multiple Time Frame Analysis
One of the best ways to analyze a market or Forex pair for both entry and trade management is by using multiple time frames.
What this means is; if you are looking to take a trade on the 1 hour chart or below, you are also taking into account the daily and 4 hour charts.
If you are looking to make a trade on the 4 hour chart you could be looking at the weekly and daily charts.
Checkout the example below.
Daily Chart
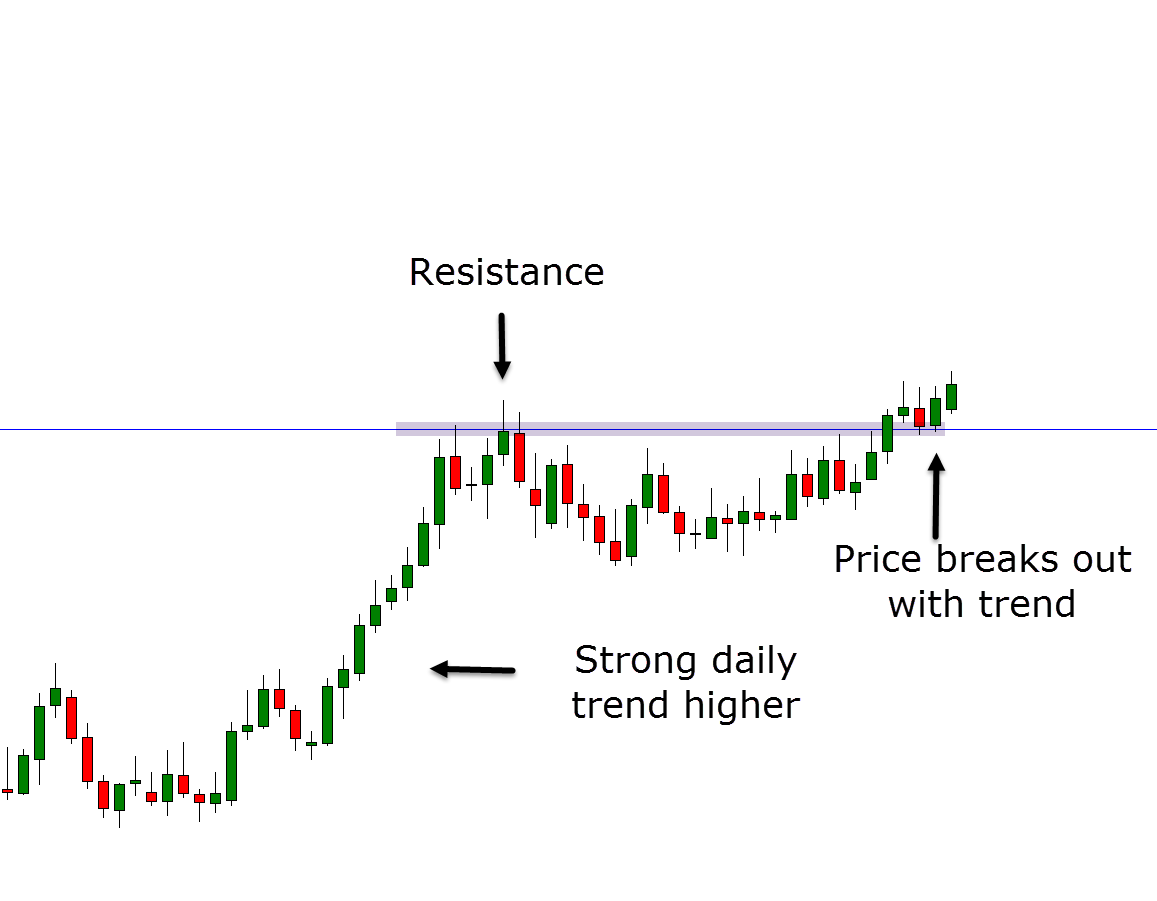
The best place to start is on the daily time frame.
On this chart we can find the trend and also important support and resistance levels. This is our anchor chart where the main analysis is carried out.
As the example daily chart shows below; price is in an uptrend, has previously paused at the resistance and then continued with a breakout. With this information we could then move to the 4 hour chart.
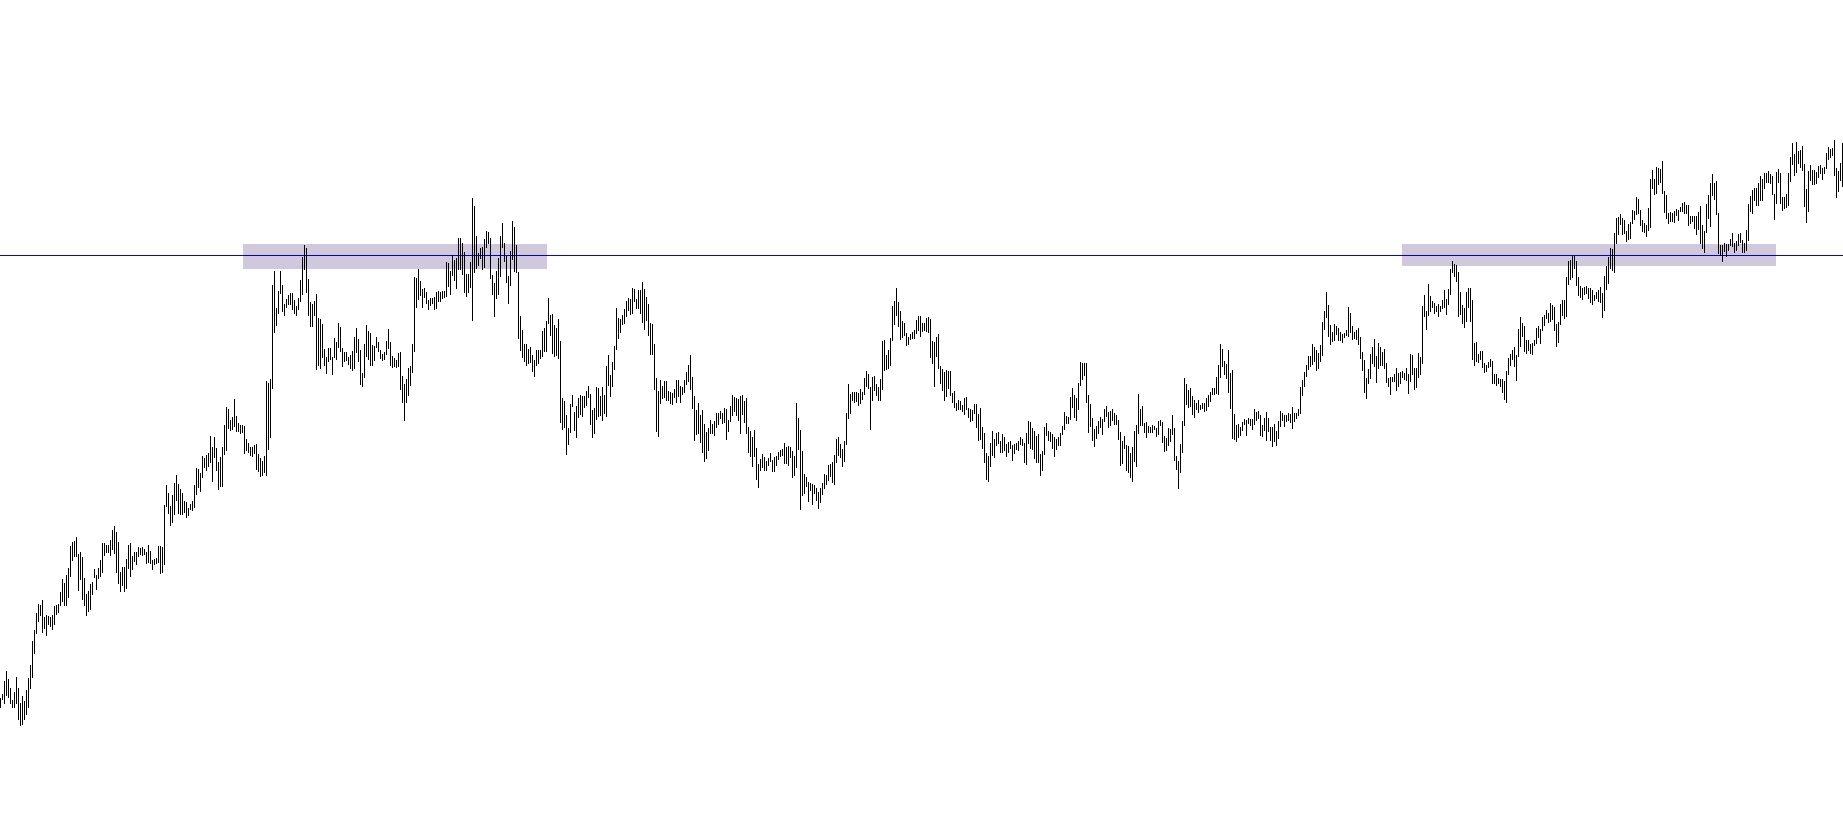
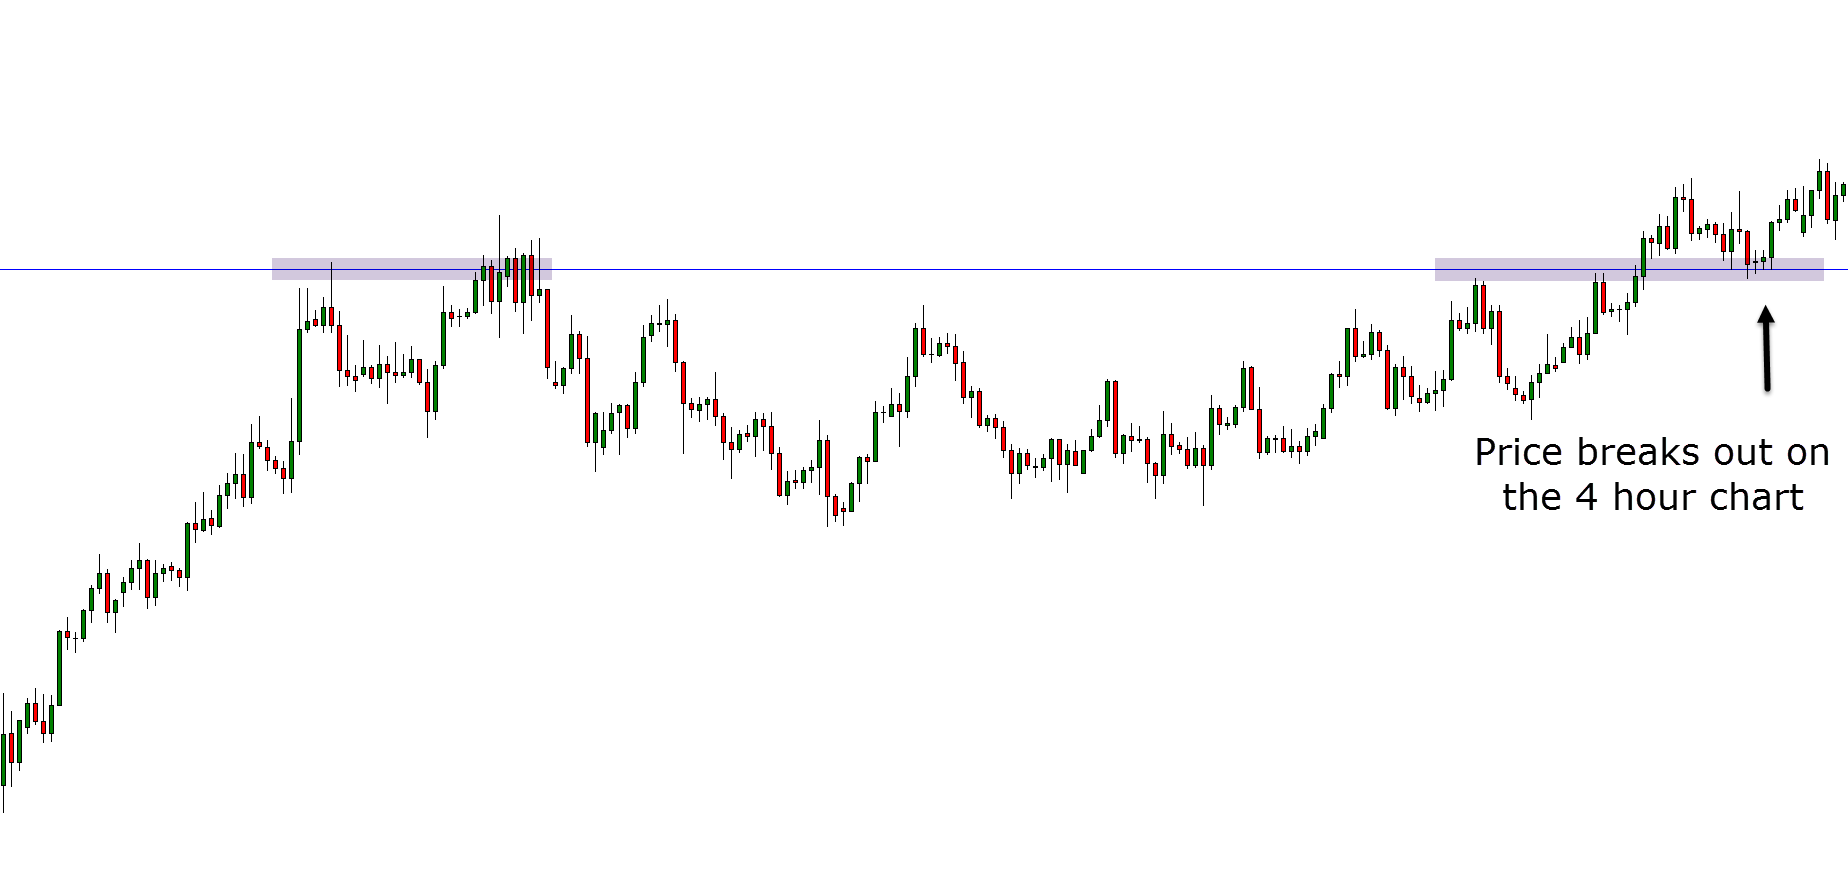
4 Hour Chart
The next two charts shows the same market, but on the 4 hour time frame.
As both charts show; we have the level price found resistance on the daily chart and the same level it broke out of.
This information is important especially if we want to make a trade on the 1 hour or smaller time frames. We now have an important level to keep an eye on for long trades.
1 Hour and Smaller Charts
Whilst in this example we have analyzed the daily and 4 hour charts, we are looking to find an entry on the 1 hour chart. The reason for that is because we can fine tune our trade entries and stop loss for bigger reward trades.
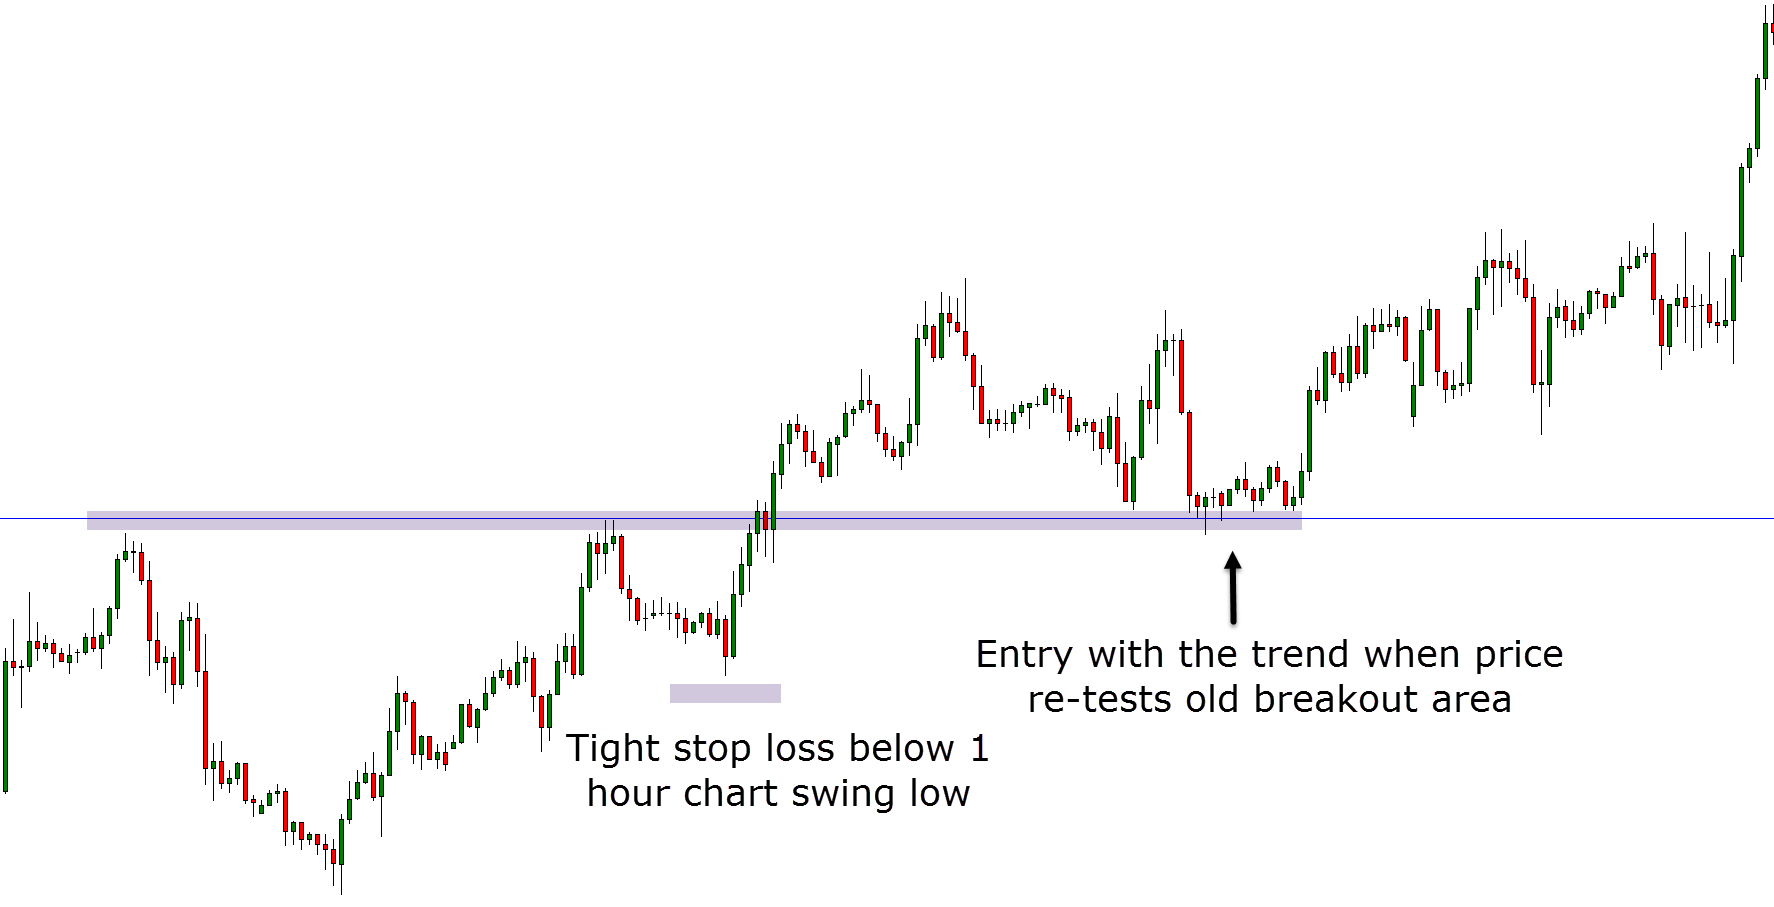
The chart below is the 1 hour chart of the same market discussed above.
We can now see the 1 hour chart is in a trend higher we have the same major level.
When price moved back into that major level after the breakout we could be looking for long trades inline with the trend and at the support.