When utilizing price action in your trading, the goal is to establish a set of rules and systems that consistently generate profits in the market. Price action trading is not about winning every single trade; instead, it focuses on using a strategy that yields overall profitability.
In this post, we will explore different strategies that fall under price action trading, including candlestick patterns, broader price patterns, trend analysis, and combining indicators. By the end, you will have a better understanding of how to leverage price action to improve your trading results.
Note: Get Your Free Price Action Trading PDF Below.
Table of Contents
What is Price Action Trading?
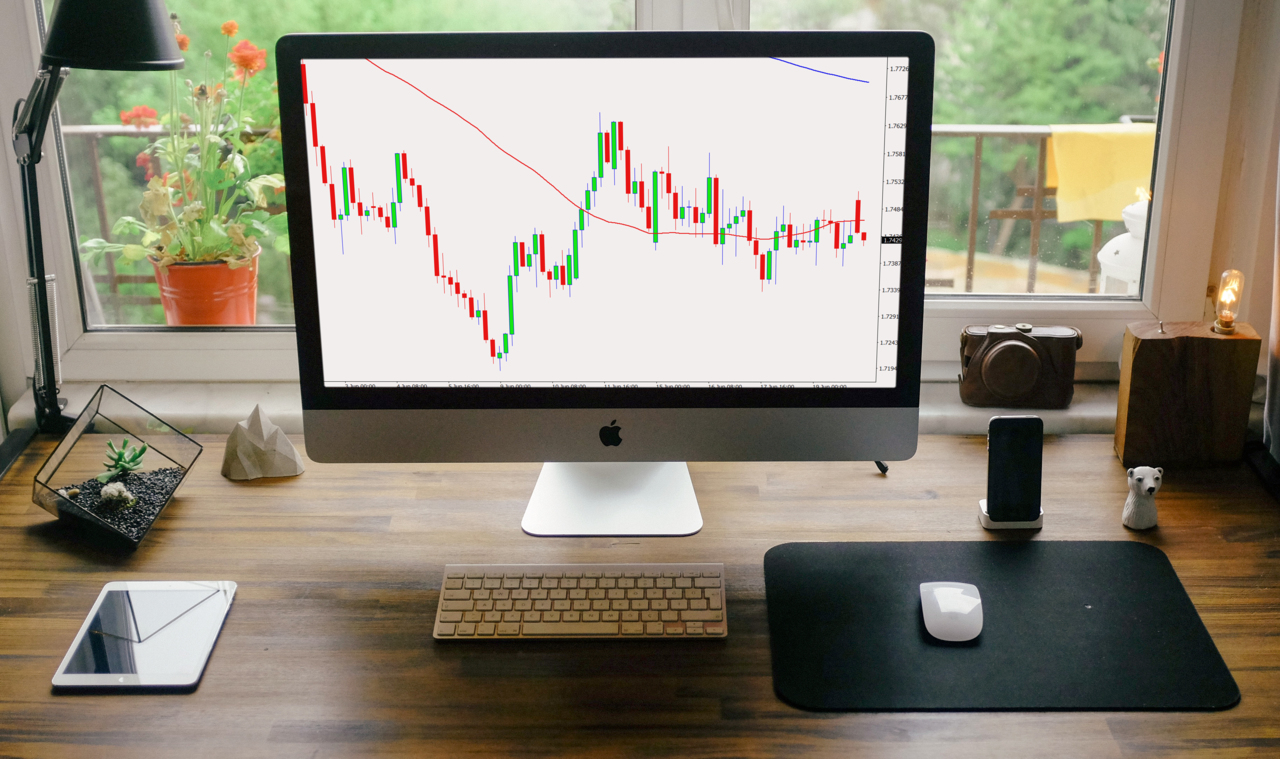
Price action trading is an effective trading approach where traders make decisions based on the movement of prices shown on charts, without relying on complex indicators. It focuses solely on price history and doesn’t consider external factors. Price charts reflect the collective behavior of traders in the market. For example, if the price suddenly moves up, price action charts clearly show this and indicate that buyers are in control.
As a price action trader, you can develop a reliable system that consistently generates profits over multiple trades. Price action trading allows you to customize your strategy to fit your personal style. You can trade various markets, use different time frames, and even take advantage of price action for short-term trades.
How to Learn Price Action Trading
Here are three important things to remember as we discuss different price action strategies, systems, and patterns:
Price Action Discounts Everything
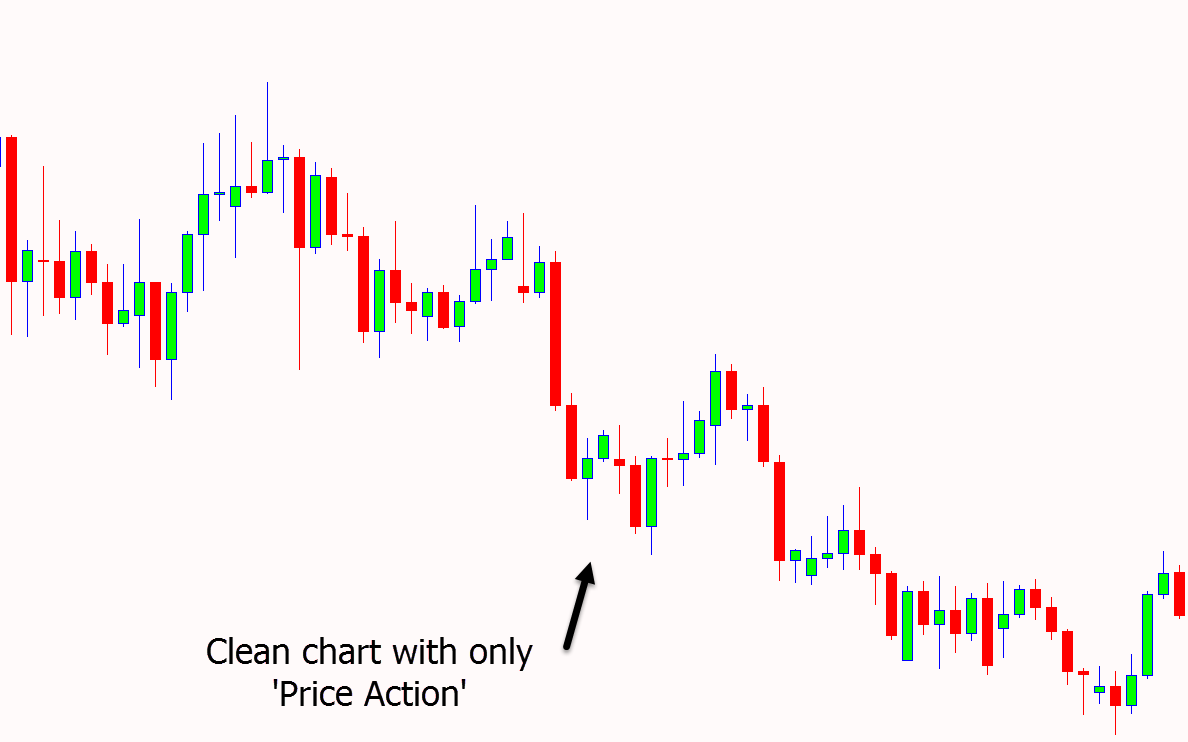
Price action trading focuses solely on analyzing the chart in front of you. You look at trends, patterns, and potential trade setups without considering complex factors like fundamentals. It’s about trading what you see, rather than speculating on what you think might happen.
Price Moves Based on Trends
Once a trend is established, it’s more likely to continue in the same direction. Remember, “The trend is your friend.” Trading in line with prevailing trends increases your chances of success.
History Repeats Itself
Price action trading involves studying chart patterns that reflect historical market movements. These patterns have been used for over a century because they consistently show similar price behaviors. By understanding these patterns, you can interpret trader behavior and make better trading decisions.
By grasping these basic principles of price action trading, you can build a strong foundation and improve your ability to analyze markets. Embrace the simplicity of price action analysis and gain insights into trader behavior to enhance your trading skills.
Price Action vs Indicators
Price action trading is rooted in the belief that analyzing past price history can provide insights into future market behavior and the potential repetition of patterns.
Indicators operate on a similar principle. However, with price action, you observe real-time price movements as they appear on a chart, whereas indicators are considered “lagging.”
In other words, indicators employ historical price data to generate the signals you see. For instance, a 21-period moving average relies on the past 21 periods of price action.
While some traders strongly oppose indicators, the most effective systems often arise from a combination of price action and indicators.
This is because indicators can help filter out unfavorable price action, identify trends, pinpoint strong momentum, and even assist in setting profit targets. By leveraging the strengths of both price action and indicators, traders can enhance their decision-making process.
Intraday Price Action Trading
Increased market volatility can be a great opportunity for traders.
When prices are volatile, it means they are making significant movements. This offers you more chances to make profitable trades compared to markets with small price changes, where you might find yourself waiting for something to happen.
Some of the fastest and most profitable trading moves can be found in intraday markets.
These markets include shorter time frames like 5 minutes, 15 minutes, 30 minutes, and 1 hour. Trading on these charts has its pros and cons.
On the positive side, you’ll find many trading opportunities and have the flexibility to quickly enter and exit trades without holding them overnight. However, it’s important to note that trading on smaller time frames carries more risk, especially for less experienced traders. If things go wrong, they can go wrong quickly.
If you’re considering trading price action on intraday time frames, make sure to use strict money management techniques and always set a stop loss to protect your trading account. Prioritizing risk management is crucial for success in intraday trading.
Simple Price Action Trading Strategies
Price action trading offers straightforward yet effective strategies for traders.
The beauty of price action lies in its simplicity. It involves observing and understanding raw price movements, allowing you to create a personalized trading system.
Some of the best trading systems are also the simplest, with clear and easy-to-follow rules.
Here are a few examples of simple price action trading strategies:
- Price action trend trading: This strategy focuses on identifying and following trends in price movements to take advantage of sustained price moves.
- Candlestick trading: By analyzing different candlestick patterns, such as their shapes and formations, traders can make informed trading decisions.
- Pattern trading: This approach involves recognizing recurring price patterns, like triangles or head and shoulders, to predict potential future price movements.
- Combining price action and indicators: Some traders choose to combine price action analysis with technical indicators to enhance their decision-making process.
By adopting these simple price action trading strategies, you can potentially improve your trading results. Remember to practice and test your chosen strategies on demo accounts to build confidence and find the approach that works best for you.
Trading Price Action Trends
Trading with price action trends is an easy way to increase your chances of success. As Ed Seykota said, “The trend is your friend, except at the end when it bends.”
The market often goes up or down for longer than traders expect. That’s why it’s important to trade based on what we see on the chart, not what we think might happen.
Two simple ways to find trend trades using price action are trendlines and moving averages.
With moving averages, you look for a clear move in one direction. Using a combination of moving averages like the 50 and 200 EMA can also tell us if price action is starting a new trend or strongly continuing an existing one.
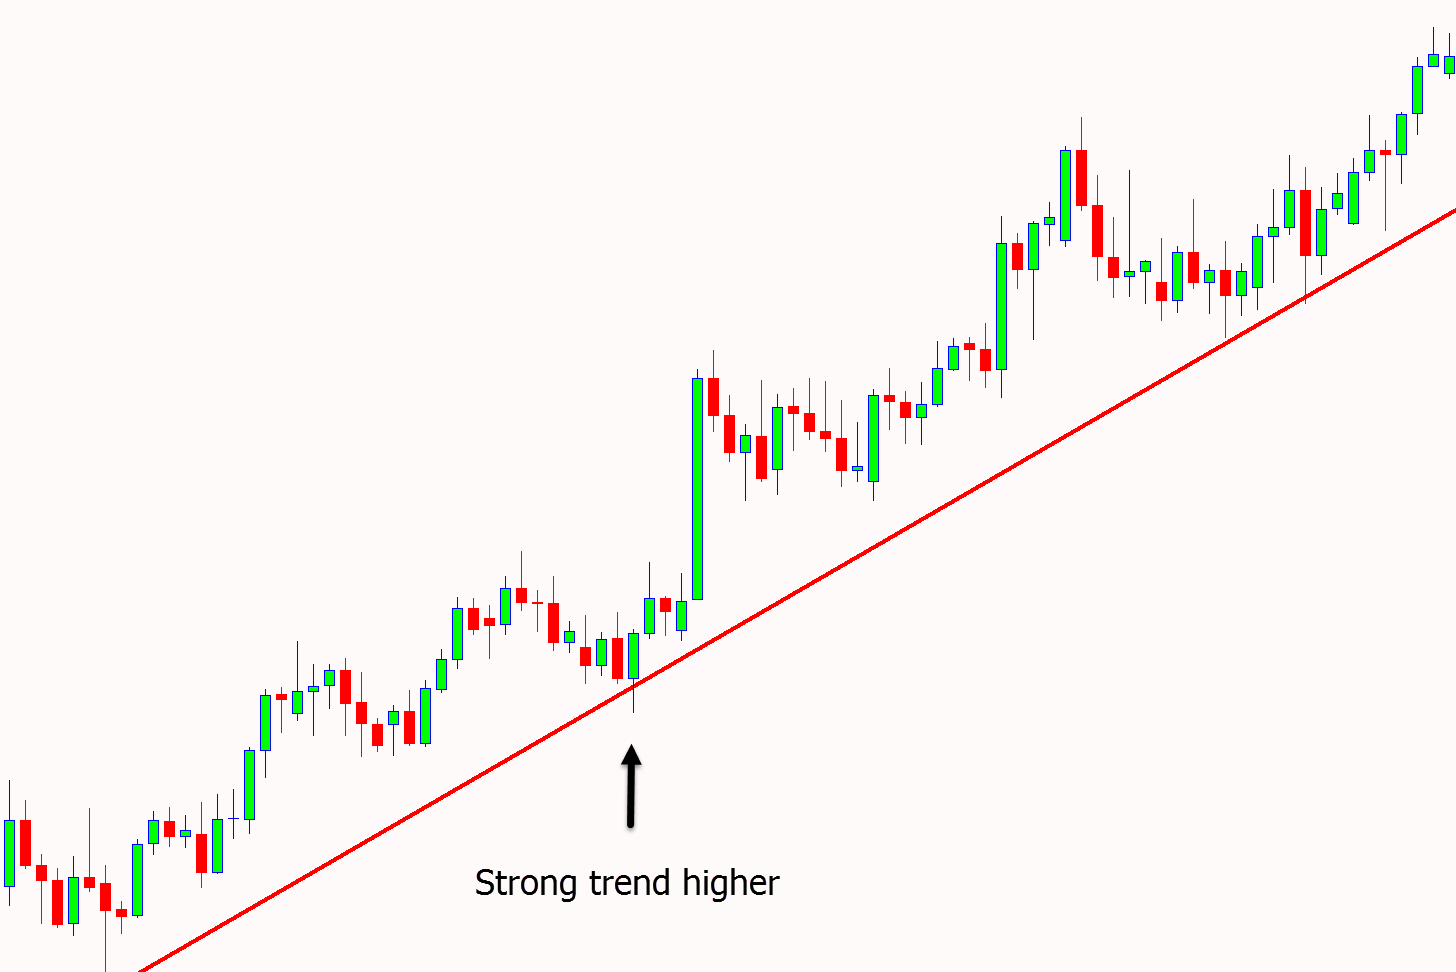
Another easy way to find and trade trends is by using trendlines.
In the example below, the price is in an upward trend. It keeps testing the upward trendline. You can look for potential trades in the upward trend when the price tests the trendline again.
Trade With Candlestick Patterns
One of the most popular price action strategies is using candlestick patterns. The reason for this is because they are very easy to spot and they can help with entry and exit levels.
The most popular chart type among professional traders is the candlestick chart because it shows the price action in the clearest form. The candlestick chart will also help you easily and quickly spot candlestick signals.
A few of the most popular candlestick patterns are;
Pin Bar Pattern
You can find pin bars on any “naked” bar chart or candlestick chart.
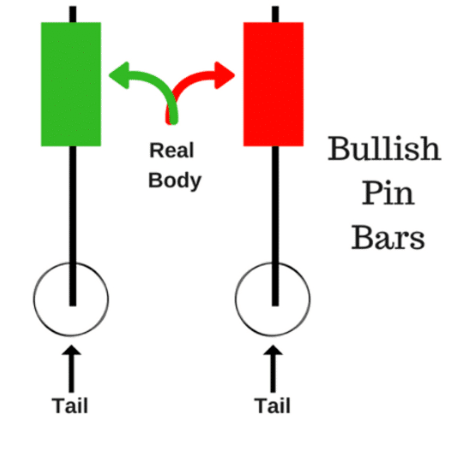
The pin bar has a long upper or lower tail, shadow, or wick and a much smaller real body.
A bullish pin bar shows that price is rejecting lower prices. You can see this as the price moved lower, but by the end of the session it had snapped back higher to reject the lower prices.
The bearish pin bar shows it is rejecting higher prices.
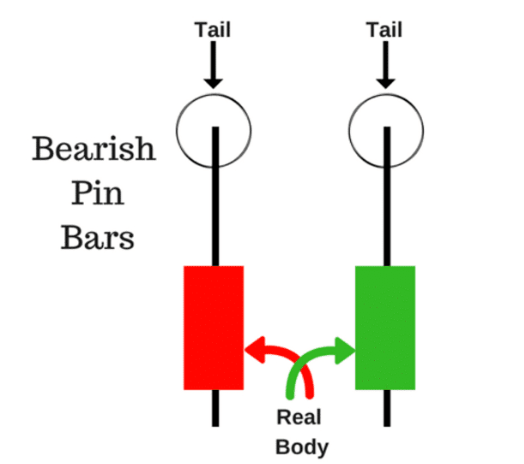
Price tried to move higher, but by the end of the session it had been snapped back lower rejecting the higher prices.
Bullish and Bearish Engulfing Candlesticks
Engulfing candlesticks are reversal price action signals.
Following the first small candlestick price will then form a second candlestick that fully engulfs the first small candle.
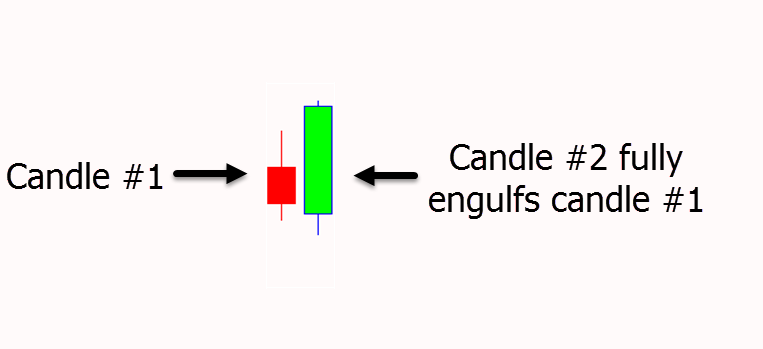
This shows a reversal in the price action order flow.
For example; a bullish engulfing pattern will show that price first formed a small candle, in the second session it moved lower, before reversing and breaking completely above the first candle.
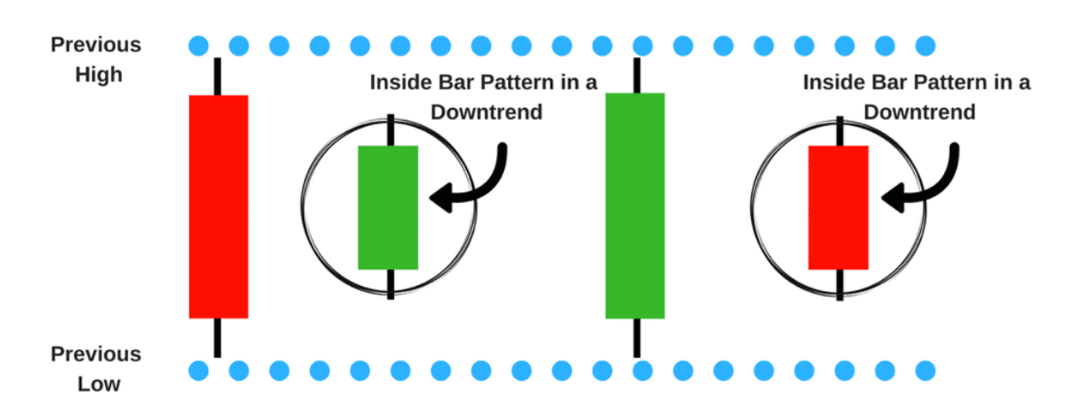
Inside Bar Pattern
This pattern is a popular candle formation, but does come with some risks.
The inside bar candlestick pattern is a two candle pattern that is showing indecision.
The first candle forms followed with the second candle forming completely ‘inside’ the first candle. This shows that price could not break either higher or lower and is indecisive.
Trading With Price Action Patterns
Whilst one and two candlestick patterns are popular and can show us the very short-term potential, there are other patterns that show what the market is doing overall.
These patterns can help us get a far better idea of what side of the market we should be on.
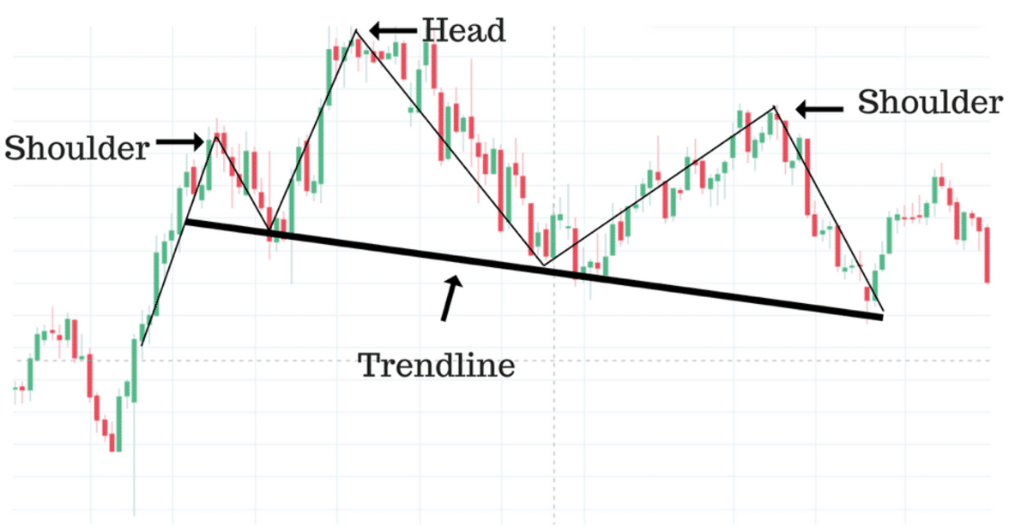
Head and Shoulders Pattern
The head and shoulders pattern is one of the most reliable trend reversal patterns.
This pattern looks to predict a bullish or bearish trend reversal.
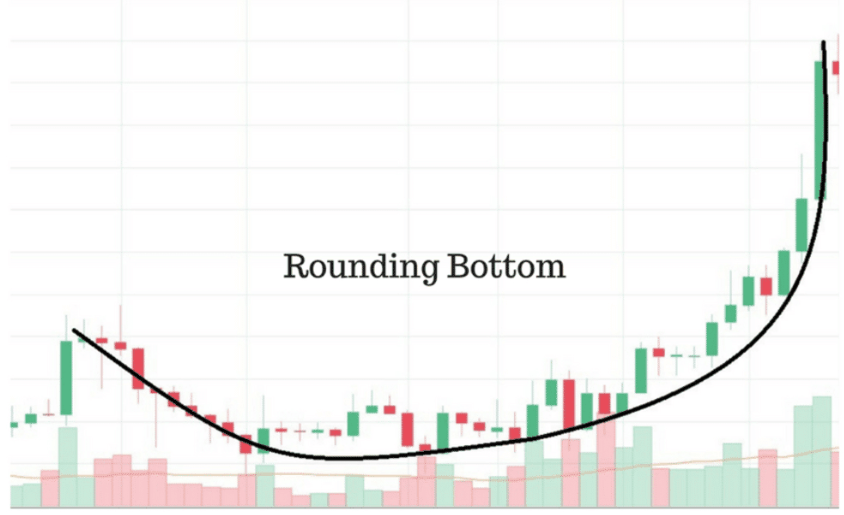
Rounding Bottom
This pattern is also known as the saucer bottom pattern.
This pattern indicates that a stock or Forex pairs price is low and the downward trend is now closed.
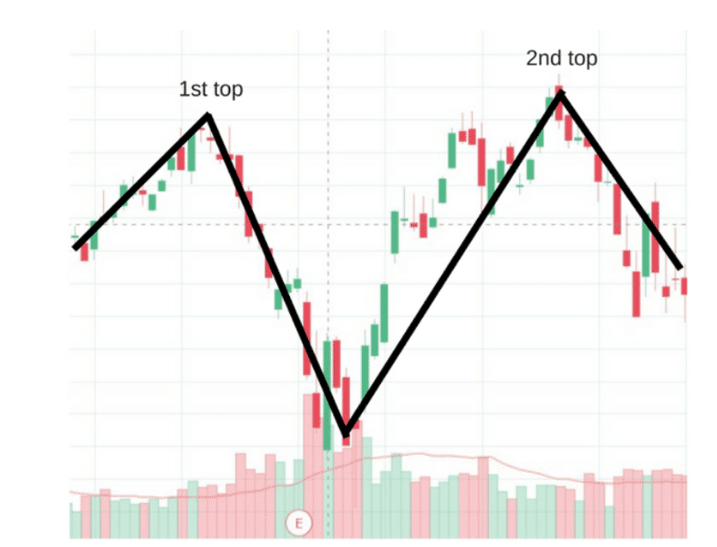
Double Tops and Double Bottoms
This pattern forms after a sustained trend and is incredibly powerful for finding when a market has topped out.
The double top is a chart pattern used to describe when the price of a market drops, rebounds and then drops from the same level creating a double top.
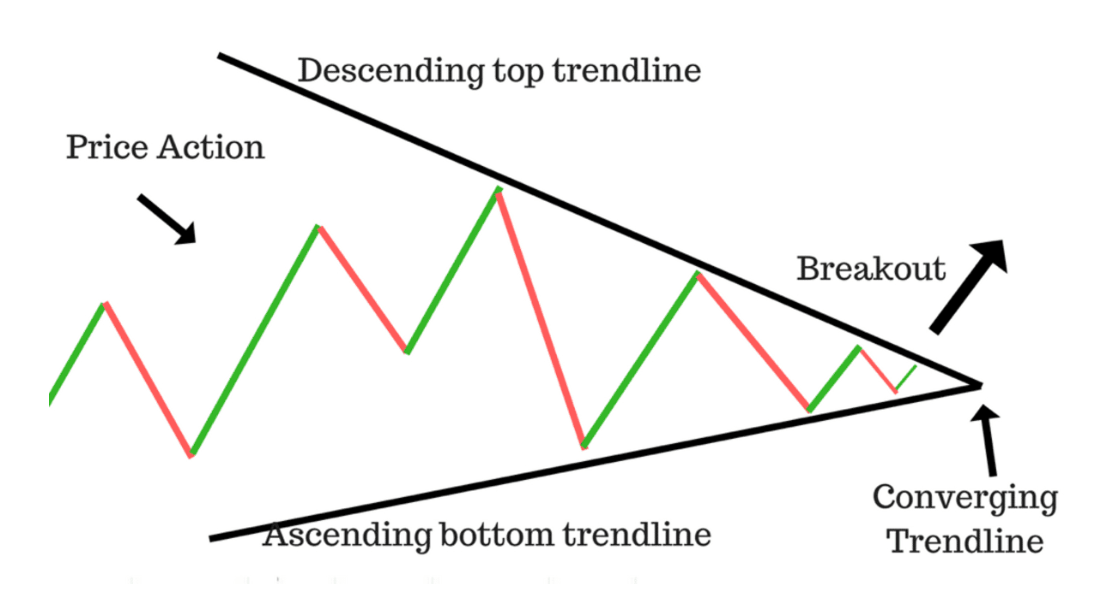
Triangle Patterns
Traders use triangles because they occur more frequently than some of the other patterns. Triangle patterns can also be used on different time frames and can last anywhere from a couple weeks to months.
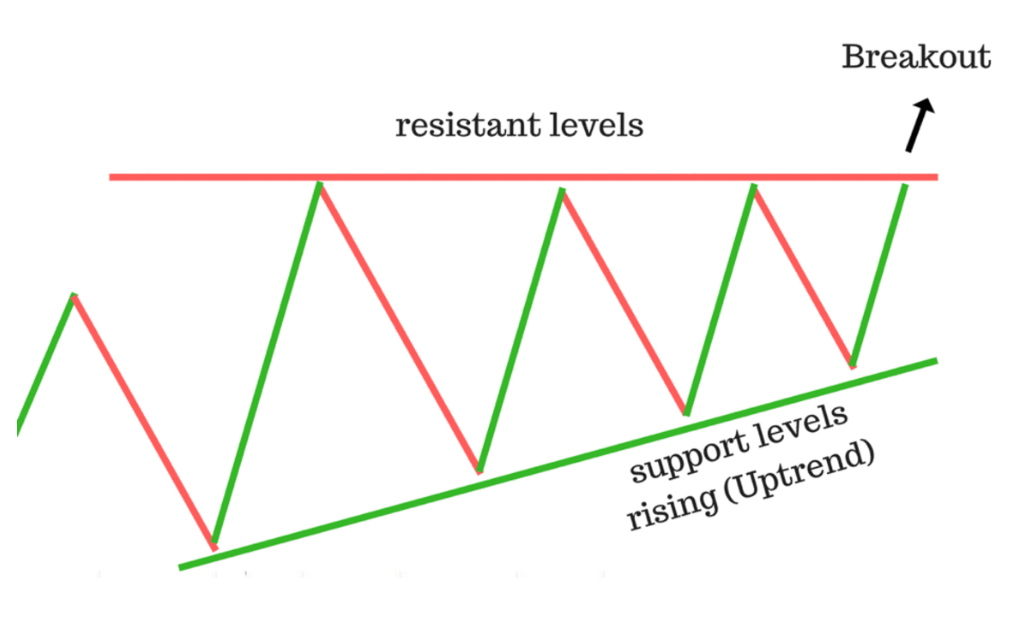
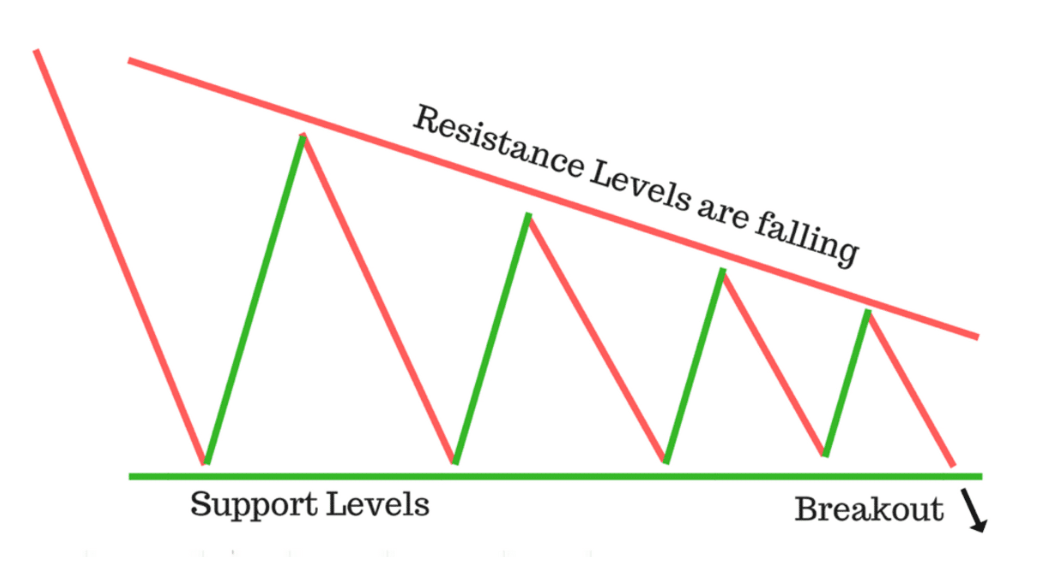
There are three common triangle patterns; the symmetrical, ascending, and descending triangles.
- Symmetrical triangle pattern: This is often referred to as the coil. This pattern is normally a trend continuation pattern.
- Ascending triangle pattern: This pattern forms during an uptrend. Usually this pattern is seen as a continuation pattern.
- Descending triangle pattern: This pattern is the bearish counterpart of the ascending triangle.
Combining to Create a Price Action Trading System
One of the best ways to create your own price action trading system is to combine different strategies until you find what suits your trading personality.
As traders we are all different. We see charts slightly differently. We have different risk tolerance levels and we have different favorite markets.
Using price action in your trading is no different. There are endless ways you can use price action to create your own custom trading system.
Below are just a few examples of what you could do in your own trading.
Example Price Action Setups
You may be suited to using just raw price action and candlestick trading.
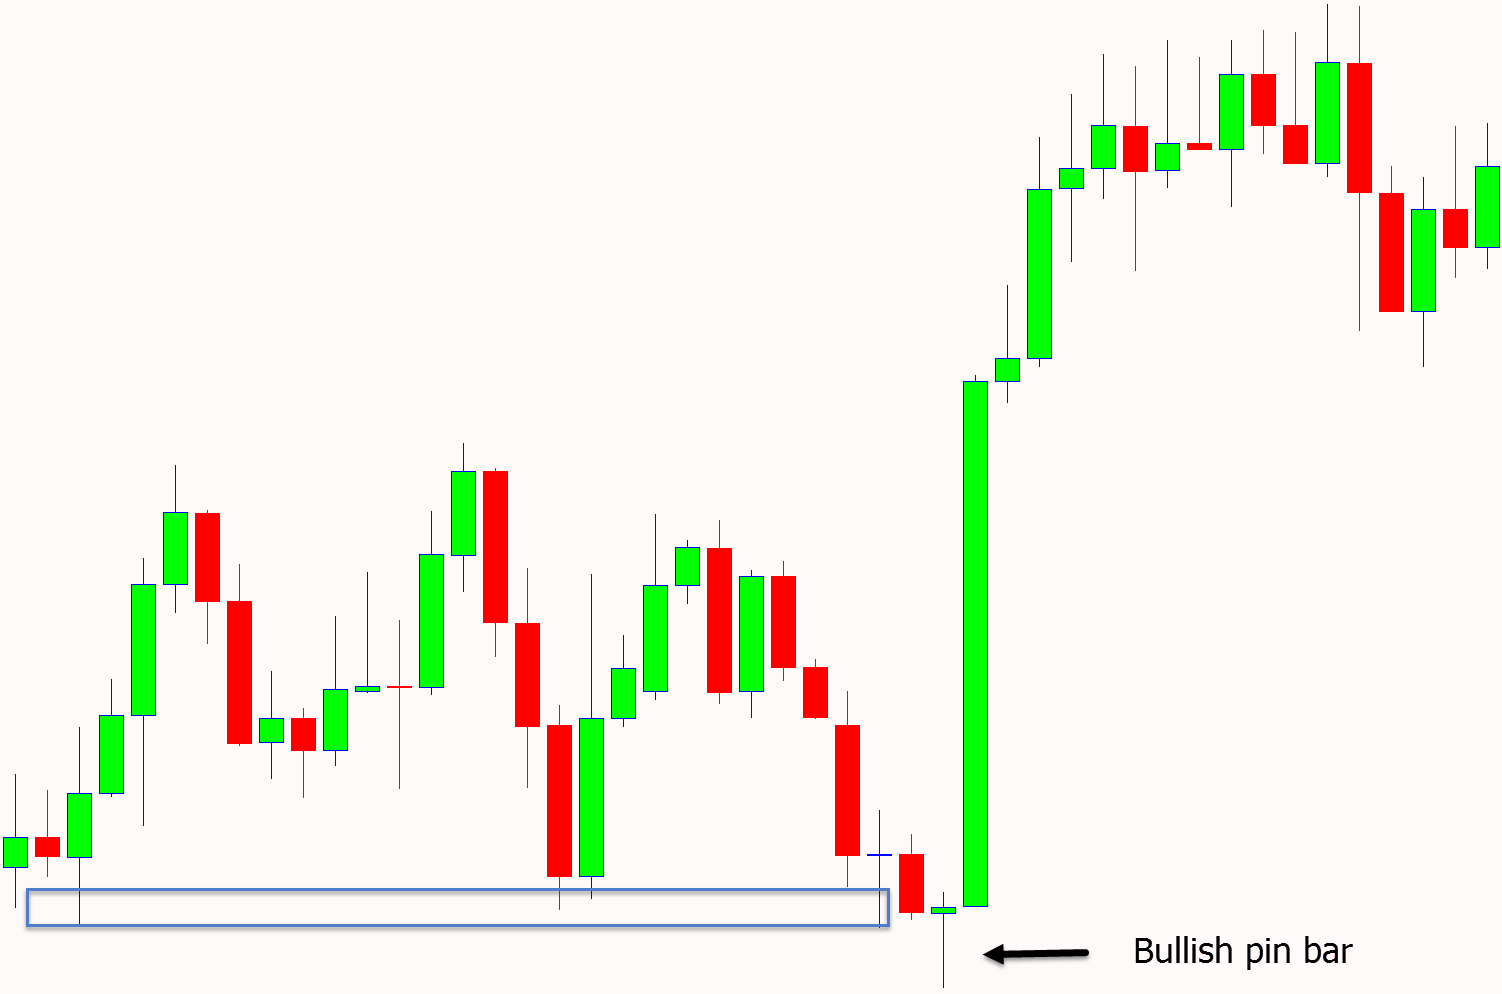
If this is your trading style, then using candlesticks such as the pin bar or dragonfly doji may be for you.
The example below shows a bullish pin bar reversal that formed at a major support level. This was a potential entry to get long from the pin bar.
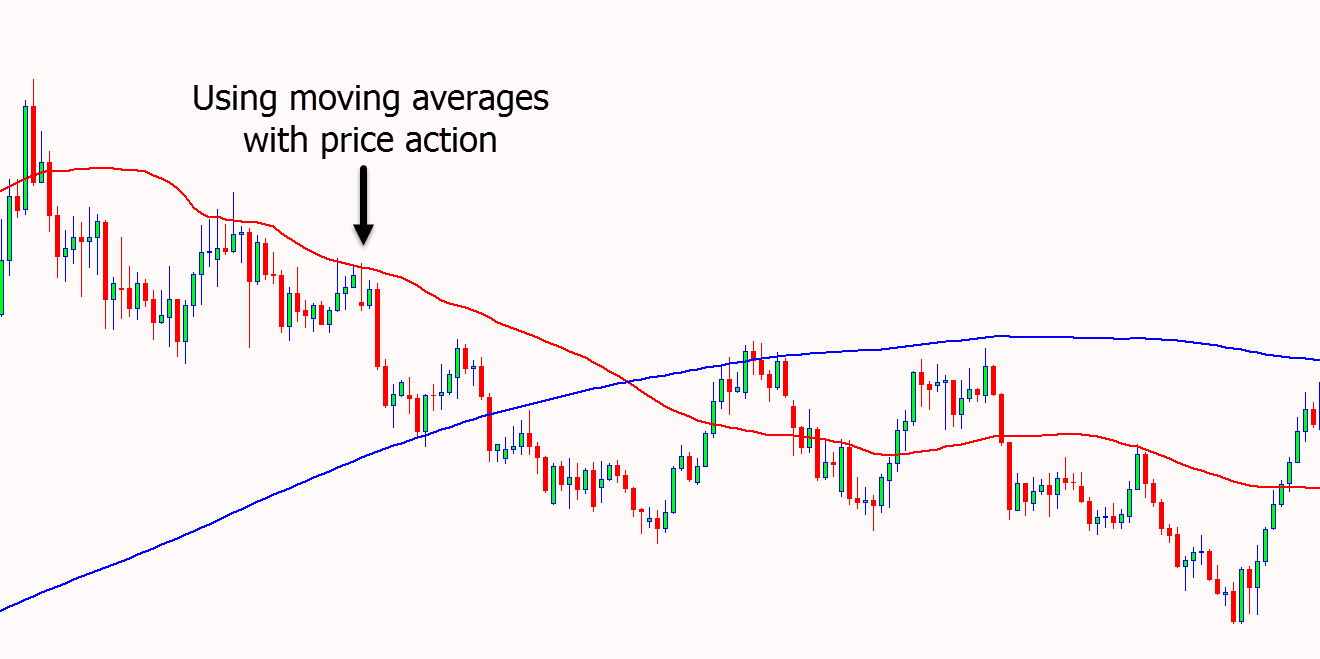
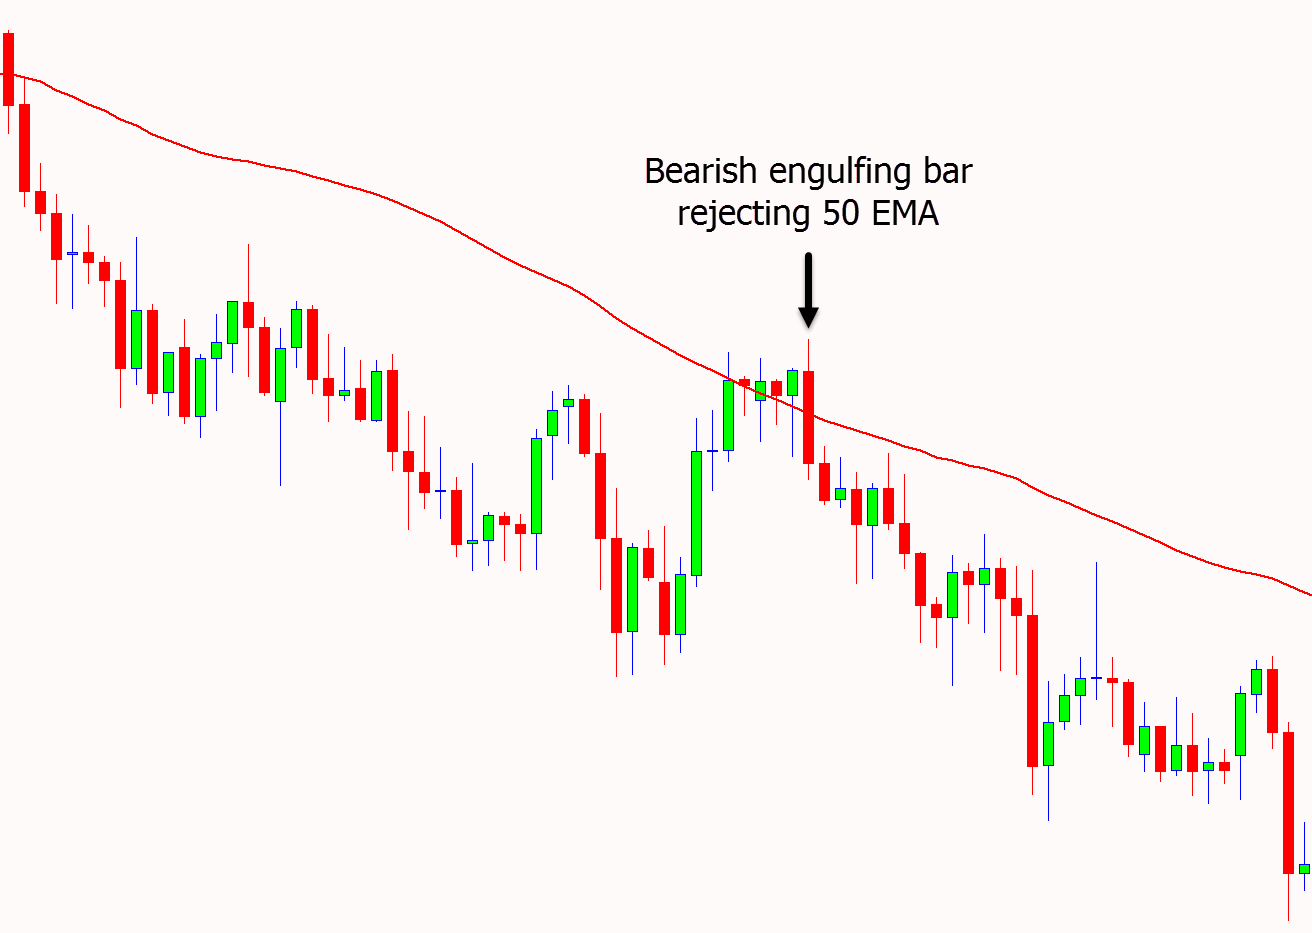
You could be the type of trader who needs to add more confirmation into your trading. You may also want to filter out bad price action or help with finding trends. One way to accomplish this is by combining indicators.
The example below shows how you could use a moving average to first find a trend and then using price action confirm an entry point. As the chart shows; price moved to test the moving average in the trend lower and then formed a bearish engulfing candlestick.
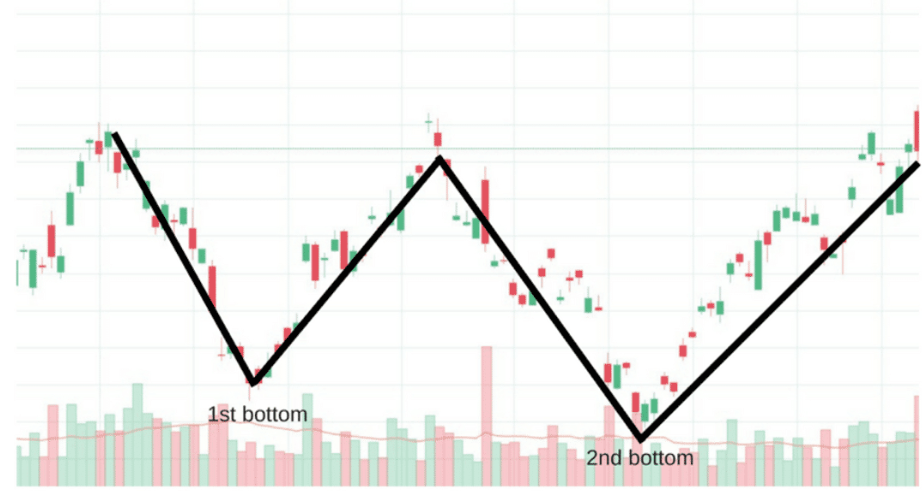
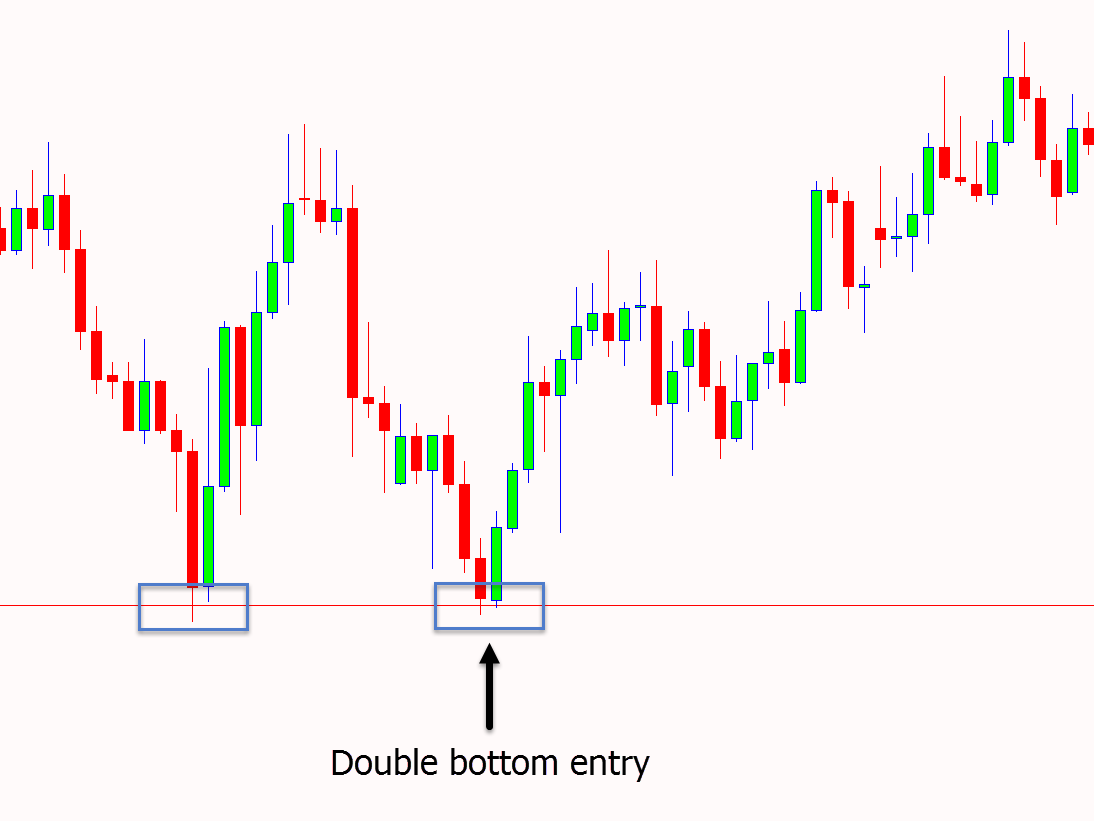
Another simple trading style is looking for bigger overall market moves.
This can be done with patterns such as the head and shoulders or the double top and bottom.
The example below shows how price formed a second bottom. This presented with a bigger overall opportunity to look for long trades.
Recap
When it comes to price action trading, there is much to learn. It’s not as simple as finding one candlestick and jumping into trades. However, that’s what makes it beautiful. Price action trading allows you to customize and find a system that suits your personal style.
To find what works best for you, make sure to test different price action strategies. Start by trying them out on high-quality, free demo charts to get comfortable and confident in your approach.
Note: Get Your Free Price Action Trading PDF Below.
