Technical Analysis PDF Free Guide Download Technical analysis involves predicting price movements on charts for different markets, such as currency pairs. It aims to evaluate securities and uncover...
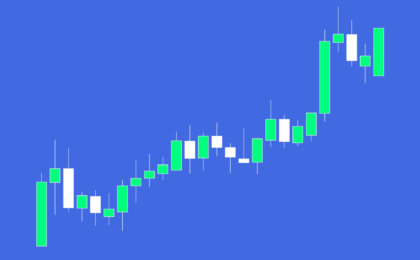
Are you a day trader looking for the best way to increase your profits? Look no further than candlestick patterns. These patterns are a powerful tool in a day trader's arsenal, allowing traders to analyze the market and gain valuable...
When trading and investing in the stock market, your goal is to buy the shares of a company at a low price and make a profit by selling them at a higher price. You have to be registered to trade stocks on an exchange, but you can easily buy and sell shares through a licensed broker who will charge you a fee. However, the vast majority of share trading in today’s world is carried out through online trading platforms...
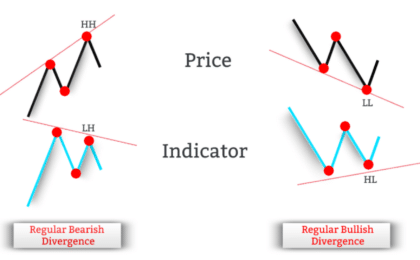
One of the basic tenets of technical analysis is that momentum precedes price. However, prices never move in a smooth line, and momentum will often be out of sync with the price. This mismatch between momentum and the actual price is referred to as a divergence...
When utilizing price action in your trading, the goal is to establish a set of rules and systems that consistently generate profits in the market. Price action trading is not
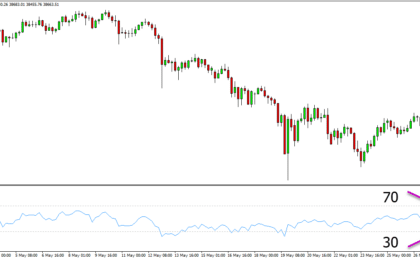
The relative strength index is a convenient and easy-to-use indicator in your trading.
You can use this indicator to see when a market is overbought or oversold and help you make