Technical analysis involves predicting price movements on charts for different markets, such as currency pairs. It aims to evaluate securities and uncover potential trading opportunities by analyzing trading statistics and gathering information.
By using the insights gained from technical analysis, you can discover and execute trades with a higher chance of success.
This post will provide a straightforward overview of technical analysis. You will learn what it is and how to apply it to your own trading strategies. Whether you’re new to trading or an experienced trader, this guide will help you improve your trading abilities. Let’s get started!
NOTE: You can get your free technical analysis PDF trading guide below.
Table of Contents
What is Technical Analysis?
Technical analysis trading centers around studying charts and graphs to interpret price movements effectively.
By comprehending these visual representations, you can evaluate securities, Forex pairs, and other markets. This involves analyzing statistics and price action to forecast future trends.
Technical analysis traders hold a core belief that market prices reflect all available information accurately. They focus on studying price movements rather than relying on fundamental factors.
Some popular technical analysis strategies include analyzing raw price action, using indicators like moving averages and the MACD, and implementing approaches such as swing and trend trading. Incorporating these strategies into your trading can enhance your decision-making and uncover profitable opportunities.
Technical Analysis vs Fundamental Analysis
Most traders who are investing over the longer term are using fundamentals. This means that they are looking at and evaluating the overall value of a stock, Forex pair, or other markets. These investors are taking into account everything from potential upcoming announcements, balance sheets, and what the potential future value could be.
Technical analysis, on the other hand, is not taking into account these pieces of information. A trader using technical analysis will be using their charts and other statistics to make their trades. The information the technical analysis trader takes into account includes price trends, indicator information, and a range of different chart patterns that could help them find where the price is moving next.
Getting Started in Technical Analysis
Getting started with technical analysis trading is simple, but it’s important to note that there is a lot to learn and improve upon.
To begin, it’s recommended to use free demo trading charts. This allows you to practice basic technical analysis strategies without risking real money.
With a demo account, you can refine your technical analysis skills in a risk-free environment. It provides a solid foundation before progressing to more advanced strategies, which we will discuss in the following sections.
Mastering Technical Analysis for Successful Trading
Becoming skilled in technical analysis requires effort and understanding of different strategies. You can focus on studying price movements alone, combine them with indicators, or explore various trading methods.
Regardless of your chosen strategy, keep these important factors in mind:
- Develop a reliable approach for managing risks and rewards.
- Create a strategy that can handle losses and generate overall profits.
- Establish clear and easy-to-follow trading rules.
- Track your trades and adapt to changing market conditions.
Developing precise rules for executing trades can be challenging, but it is crucial for consistent and repeatable results. Having a well-defined trading plan can be extremely helpful in this regard.
Remember, not all trades will be winners in technical analysis. The goal is to have a system that can handle losses while consistently generating profits over time. By focusing on long-term profitability, you can navigate the path to successful trading.
The Best Indicators
Moving Averages
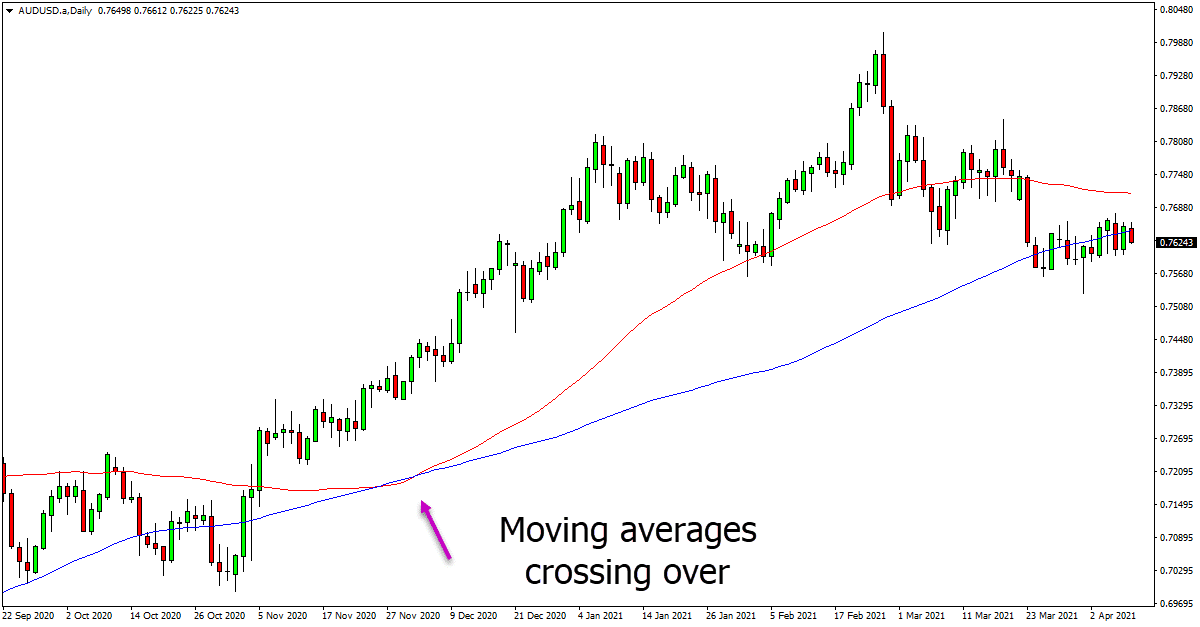
Moving averages are widely used and highly popular indicators in technical analysis. They can be helpful in smoothing out price fluctuations and identifying trends and key support and resistance levels.
Combining multiple moving averages on your chart can enhance your trading signals and improve decision-making.
In its simplest form, a moving average represents the average price over a specific period. For example, a 14-period moving average calculates the average price of the last 14 periods and displays it as a line on your chart. This line indicates the general price direction over that timeframe.
The two most common moving averages are the Simple Moving Average (SMA) and the Exponential Moving Average (EMA). Traders commonly rely on these indicators to analyze price movements and make informed trading choices.
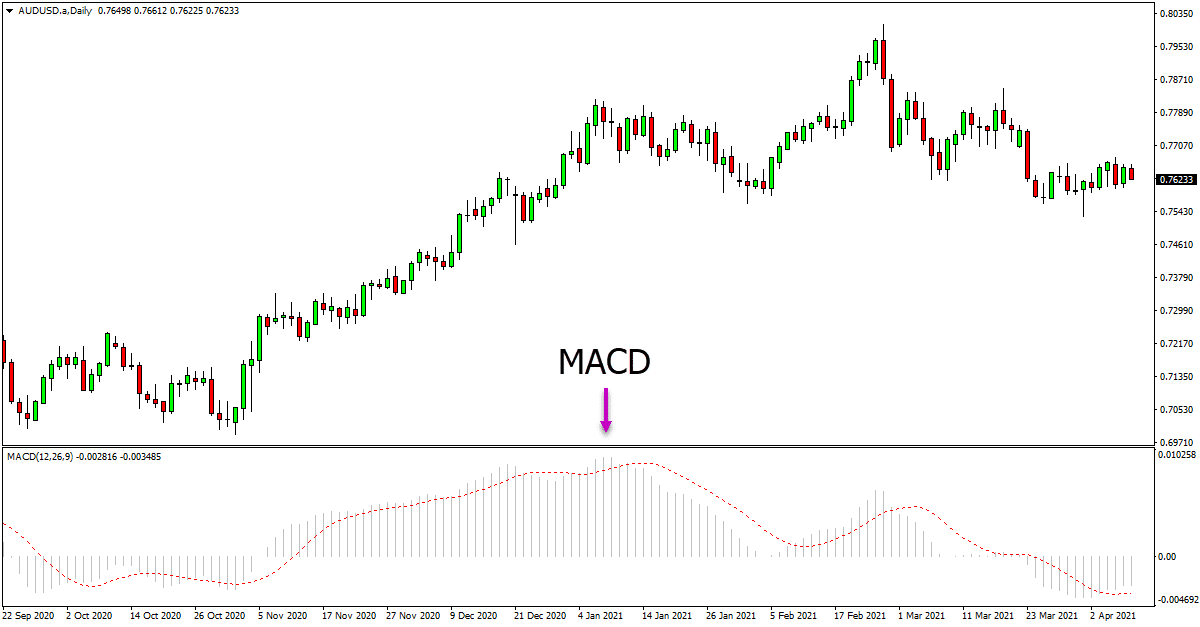
MACD
The MACD is another hugely popular indicator used to find new trends or momentum in many different markets.
The MACD has three key parts:
- MACD line: is created by taking a longer-term EMA and subtracting it from a shorter-term EMA
- Signal line: used to generate buy and sell signals.
- Histogram: measures the distance between MACD and its signal line.
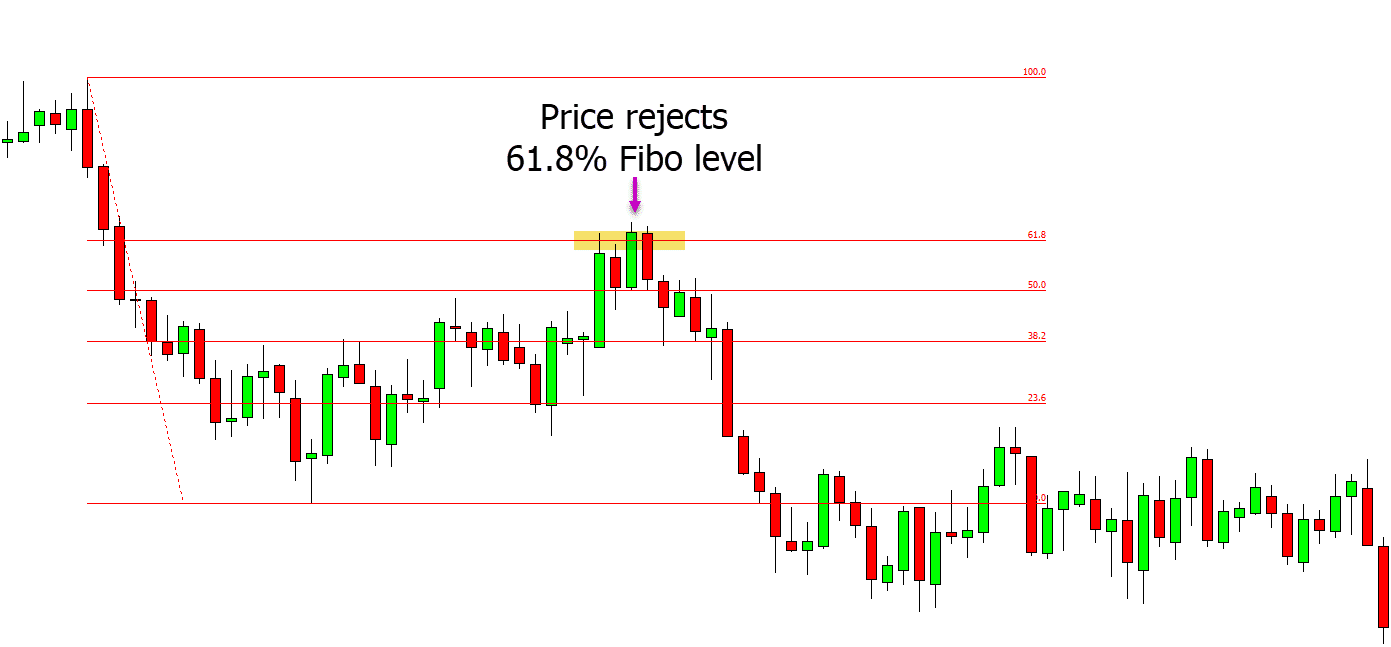
Fibonacci Tool
The Fibonacci tool is an indicator you can use to both make and manage your trades.
Fibonacci is formed with a set of key ratio numbers that include 23.6%, 38.2%, 50%, 61.8%, and 100%.
These key levels will often work as important support or resistance levels.
In the example below price is trending lower. After trending back higher, the price moves into the 61.8% Fibonacci level. At this point it finds resistance and sells back lower with the trend.
Exploring Advanced Techniques
Advanced technical analysis involves combining different methods and strategies to enhance your trading approach. This can include using multiple indicators together or integrating indicators with price action strategies.
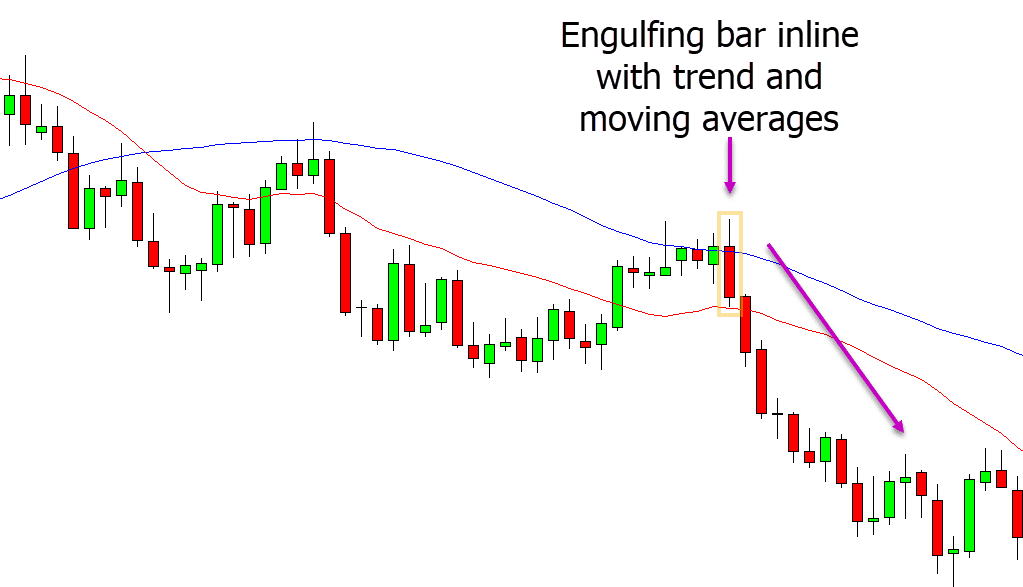
For instance, let’s consider the combination of moving averages and price action signals.
When a moving average crossover indicates a downtrend, and price forms a bearish engulfing bar, which is a signal of a potential price drop, it suggests considering short trades in line with the downtrend. This is just one example of how strategies can be combined for more advanced analysis.
Remember, there are numerous ways to combine strategies for more advanced technical analysis. By expanding your toolkit and integrating various techniques, you can gain deeper insights into the markets and make more informed trading decisions.
Recap
Technical analysis is a valuable tool for predicting price movements and identifying trading opportunities in various markets, such as currency pairs. By utilizing the insights gained from technical analysis, you can enhance your trading decisions and increase the likelihood of successful trades.
Throughout this post, we have provided a clear and practical overview of technical analysis. Whether you are a beginner or an experienced trader, the information shared here will help you refine your trading strategies and improve your overall trading skills.
Remember, this is an ongoing learning process that requires practice and adaptation to changing market conditions. By incorporating the principles of technical analysis into your trading approach, you can deepen your understanding of market dynamics and make more informed trading decisions.
Now, it’s time to apply this knowledge and elevate your trading to new levels.
NOTE: You can get your free technical analysis PDF trading guide below.
