An Accurate Reversal Indicator is a tool or signal used in technical analysis to predict when a current market trend will reverse.
Common indicators include moving average crossovers, such as the Golden Cross and Death Cross, that signal bullish and bearish reversals, respectively.
The Relative Strength Index (RSI) indicates potential reversals when it moves above 70 (overbought) or below 30 (oversold).
The Moving Average Convergence Divergence (MACD) signals bullish reversals when the MACD line crosses above the signal line and bearish reversals when it crosses below.
These are just a few popular accurate reversal indicators. In this post, we discuss the best reversal indicators and how you can use them in your trading.
NOTE: Want a full list of some of the best free MT4 and MT5 indicators for trading? You can find them below.
Table of Contents
What is an Accurate Reversal Indicator
An Accurate Reversal Indicator is a tool or signal used in technical analysis of financial markets to predict when a current trend will reverse direction. Traders and analysts use these indicators to identify potential turning points in market prices, aiming to enter or exit trades at optimal moments.
Here are some common types of reversal indicators:
- Moving Averages: Crossovers of short-term and long-term moving averages (e.g., the 50-day and 200-day moving averages) can indicate trend reversals. For instance, a “Golden Cross” (when a short-term moving average crosses above a long-term moving average) suggests a bullish reversal, while a “Death Cross” (when a short-term moving average crosses below a long-term moving average) suggests a bearish reversal.
- Relative Strength Index (RSI): An RSI above 70 indicates overbought conditions, suggesting a potential bearish reversal, while an RSI below 30 indicates oversold conditions, suggesting a potential bullish reversal.
- MACD (Moving Average Convergence Divergence): The MACD line crossing above the signal line can indicate a bullish reversal while crossing below can indicate a bearish reversal.
- Bollinger Bands: When prices move outside the Bollinger Bands, it can indicate a potential reversal. For example, if prices move above the upper band, they might be overbought and could reverse downward.
These indicators are not foolproof and should be used with other analysis and risk management strategies.
How to Use an Accurate Reversal Indicator
To use an Accurate Reversal Indicator effectively, follow these steps:
- Choose the Right Indicator: Select an indicator that suits your trading style and market conditions. Common reversal indicators include candlestick patterns, moving averages, RSI, MACD, Bollinger Bands, and divergence.
- Analyze the Market Context: Understand the broader market context and trend. Identify the current trend (uptrend, downtrend, or sideways) before looking for reversal signals. Ensure the market is not in a solid trending phase where reversals are less likely.
- Identify Potential Reversal Signals:
- Moving Averages: Observe for crossovers, such as a short-term moving average crossing above a long-term one (bullish) or below it (bearish).
- RSI: Check if RSI is above 70 (indicating overbought conditions) or below 30 (indicating oversold conditions).
- MACD: Watch for the MACD line crossing the signal line, with a bullish signal when it crosses above and a bearish signal when it crosses below.
- Bollinger Bands: Note if the price moves outside the upper or lower bands, indicating potential overbought or oversold conditions.
- Divergence: Look for divergence between price action and an oscillator like RSI or MACD, where the price makes higher highs but the oscillator makes lower highs, or vice versa.
- Confirm the Signal: Use additional indicators or analysis methods to confirm the reversal signal. For example, RSI can be combined with MACD to strengthen the signal or check if the reversal occurs at a significant support or resistance level.
- Set Entry and Exit Points: Once a reversal signal is confirmed, set your entry point close to the signal confirmation. Establish exit points to manage risk, such as setting stop-loss orders below support levels in a bullish reversal or above resistance levels in a bearish reversal.
- Monitor the Trade: Continuously monitor the trade and adjust your strategy as needed. Be prepared to exit the trade if the reversal does not materialize as expected.
- Practice Risk Management: To protect against potential losses, use proper risk management techniques, such as position sizing and stop-loss orders.
By carefully selecting and confirming reversal signals and incorporating sound risk management, you can effectively use Accurate Reversal Indicators to improve your trading decisions.
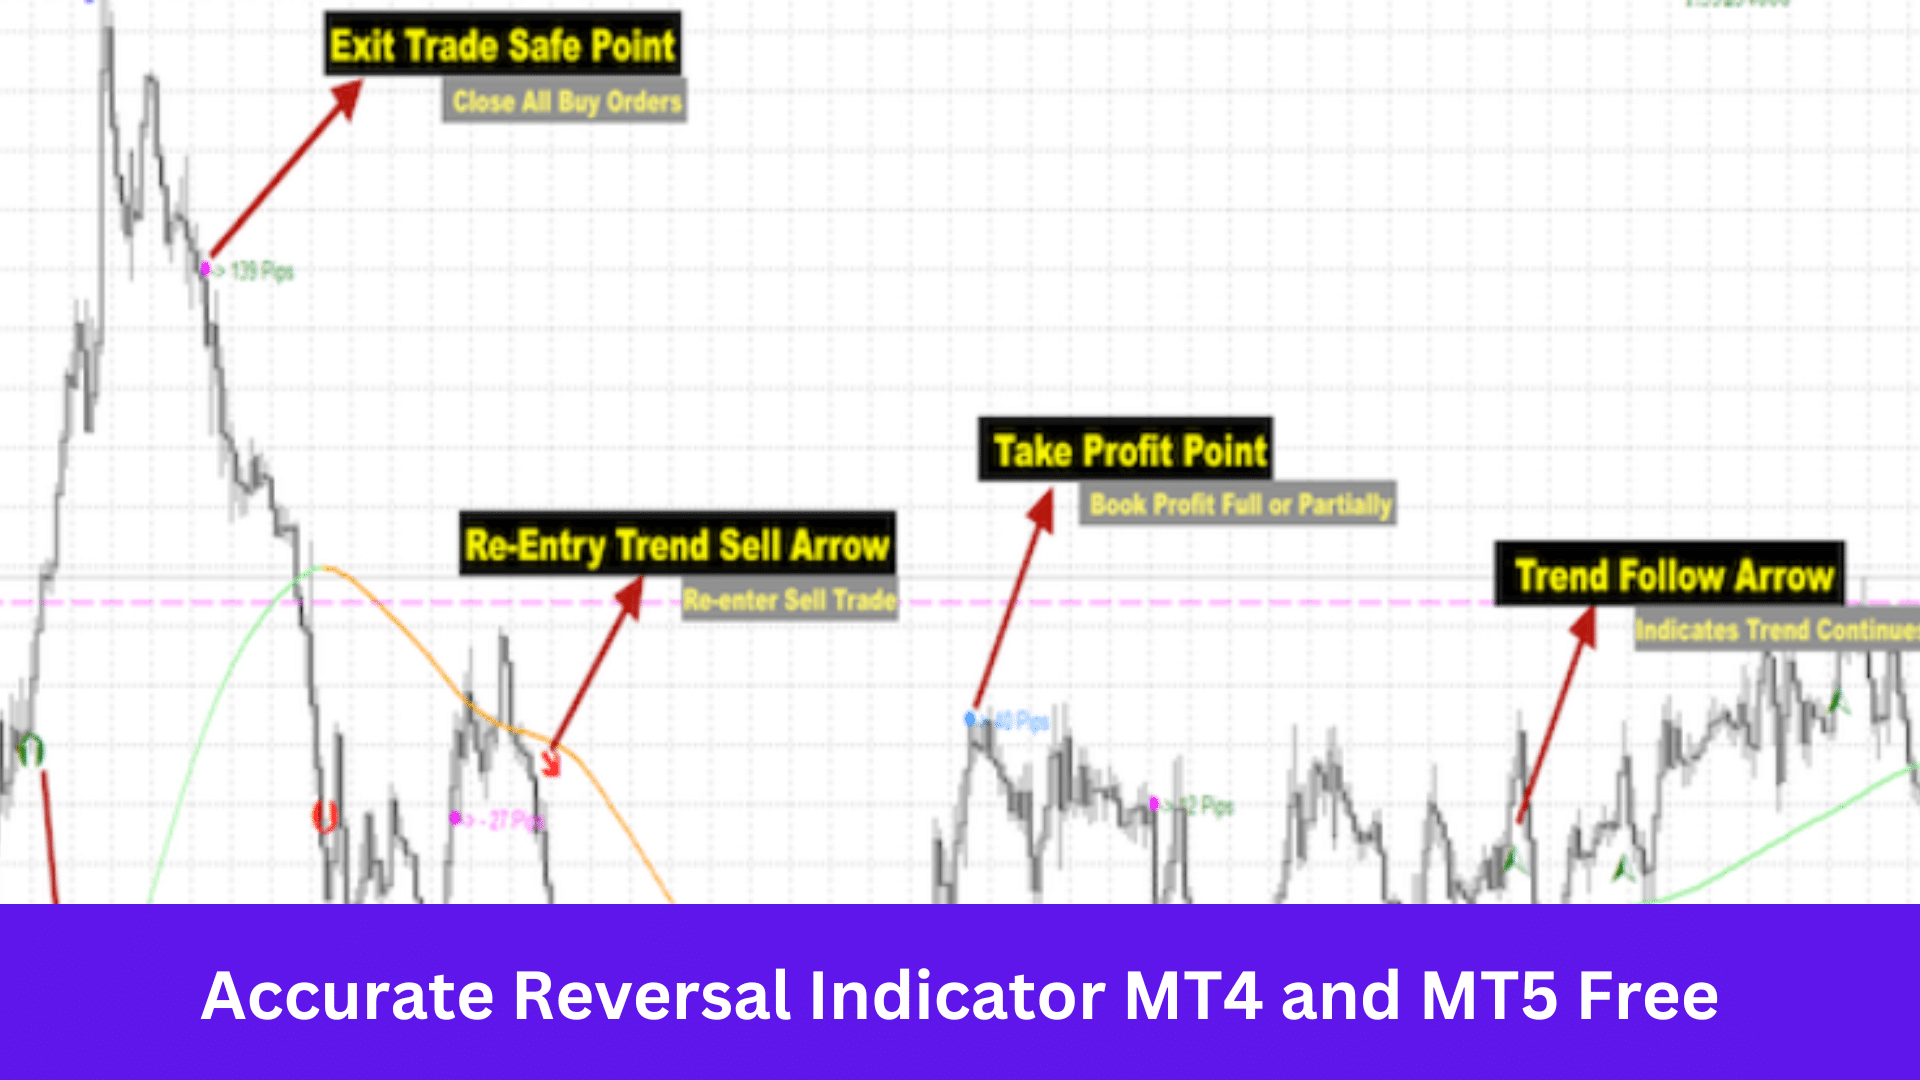
Accurate Reversal Indicator MT4 and MT5
One of the most challenging tasks in Forex trading is accurately determining trend reversal points.
These points are crucial because they allow traders to enter the market at the beginning of a price movement and potentially profit from most of it.
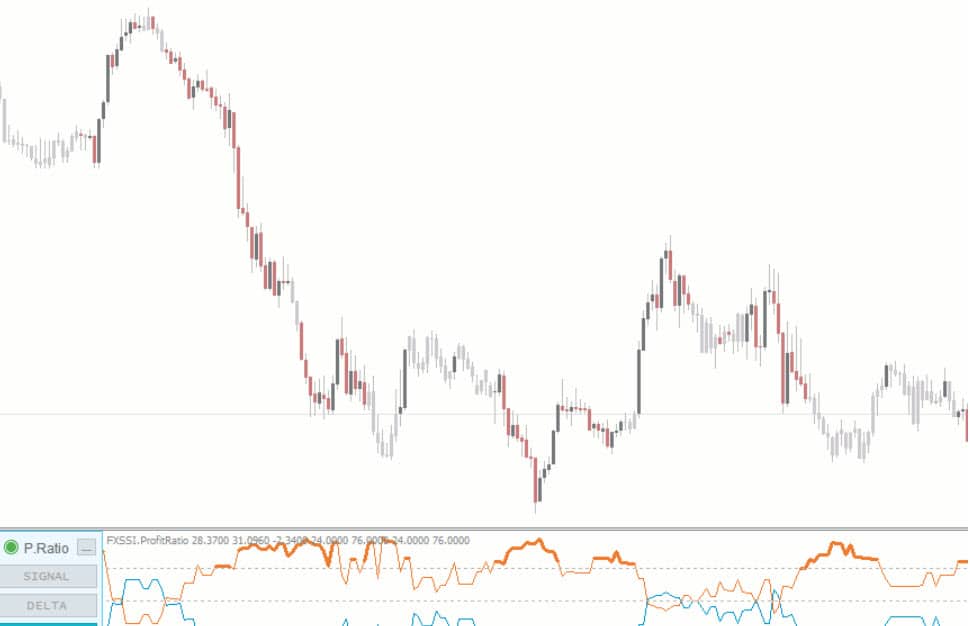
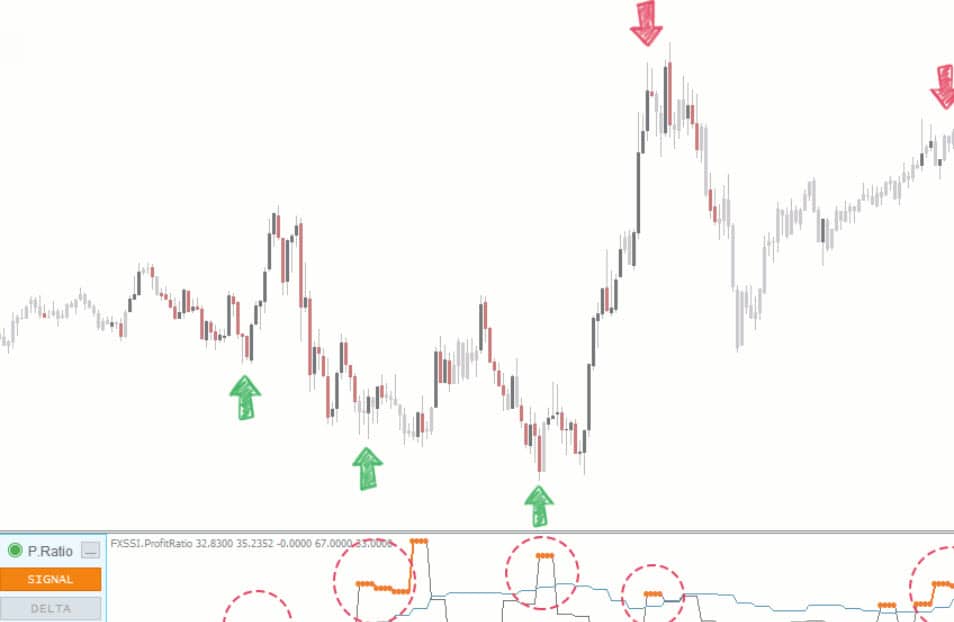
Due to this, various stochastic indicators are popular, as they theoretically predict price reversals. Additionally, accurate reversal indicators within the market sentiment indicator group, such as the ratio of winning traders (Profit Ratio), are also popular.
FXSSI makes this free MT4 and MT5 reversal indicator and can help you predict potential market reversals.
Get your reversal indicator for MT4 and MT5 here.
Note: Don’t know how to install and use these indicators? Read How to Download, Install, and Use MT4 and MT5 Indicators.
Lastly
To use these reversal indicators effectively, choose the right indicator, analyze the market context, identify and confirm reversal signals, set entry and exit points, monitor trades, and practice risk management.
It would be best to practice these reversal indicators on free demo charts before trading with them with real money.
