
Oscillating indicators are to show securities when they are overbought or oversold allowing a trader to enter at the best possible price.
There are different types of momentum oscillators a trader can use, and the MACD is one of the most popular. In this guide we are going to concentrate on the MACD and how to combine with other strategies to enhance a trading strategy.
NOTE: Get the Free MACD PDF Guide Download Below.
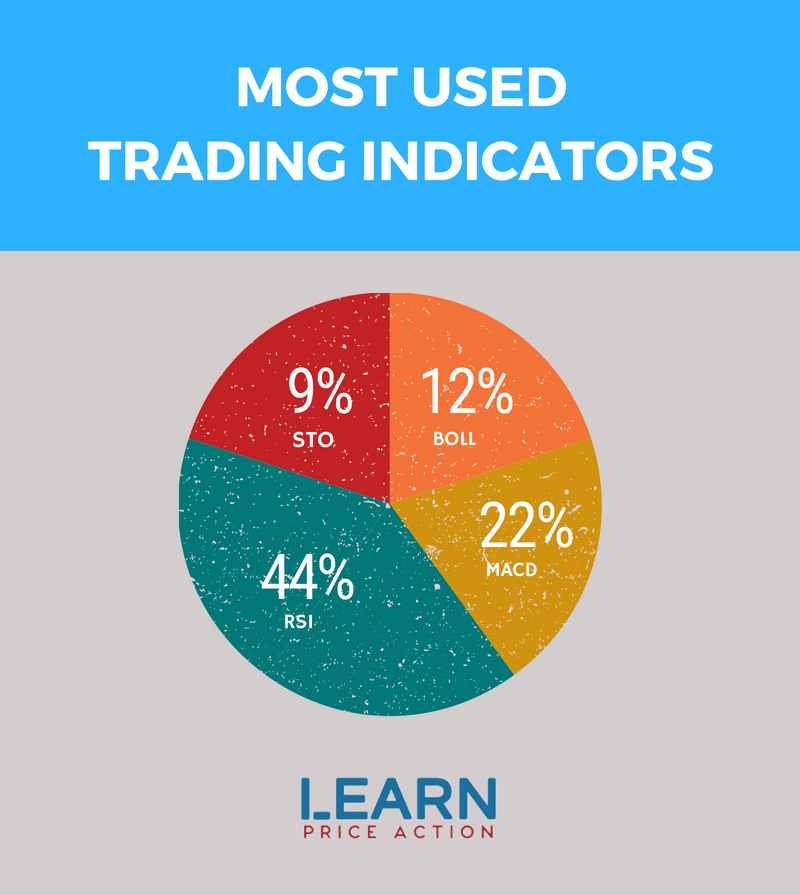
Not including the moving average, the MACD is the second most popular trading indicator.
Table of Contents
What is MACD?
The Moving Average Convergence Divergence (MACD) is a technical indicator used to identify new trends or momentum and show the connection between the price of two moving averages.
Whilst there are different types of indicators you can use in your trading including ‘Lagging, Leading and Confirming‘ the MACD uses the difference between short-term price and long-term price action trends to anticipate future movements.
MACD fluctuates above and below zero lines, highlighting both momentum and trend direction as the moving averages converge and divergence.
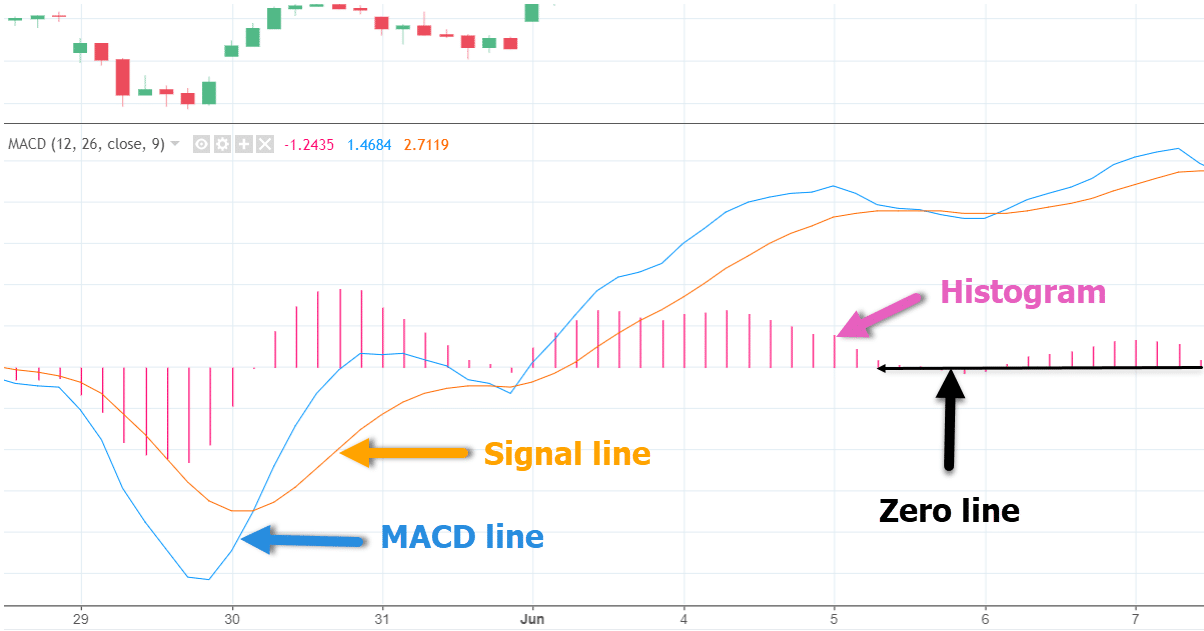
The MACD has three major components that are used to give signals;
-
- MACD line – is a result of taking a longer-term EMA and subtracting it from a shorter term EMA
-
- Signal line – EMA of the MACD line described into 1 component
- Histogram – measures the distance between MACD and its signal line. The difference between the two oscillates around Zero Line
How to Use the Moving Average Convergence Divergence (MACD) in Your Trading?
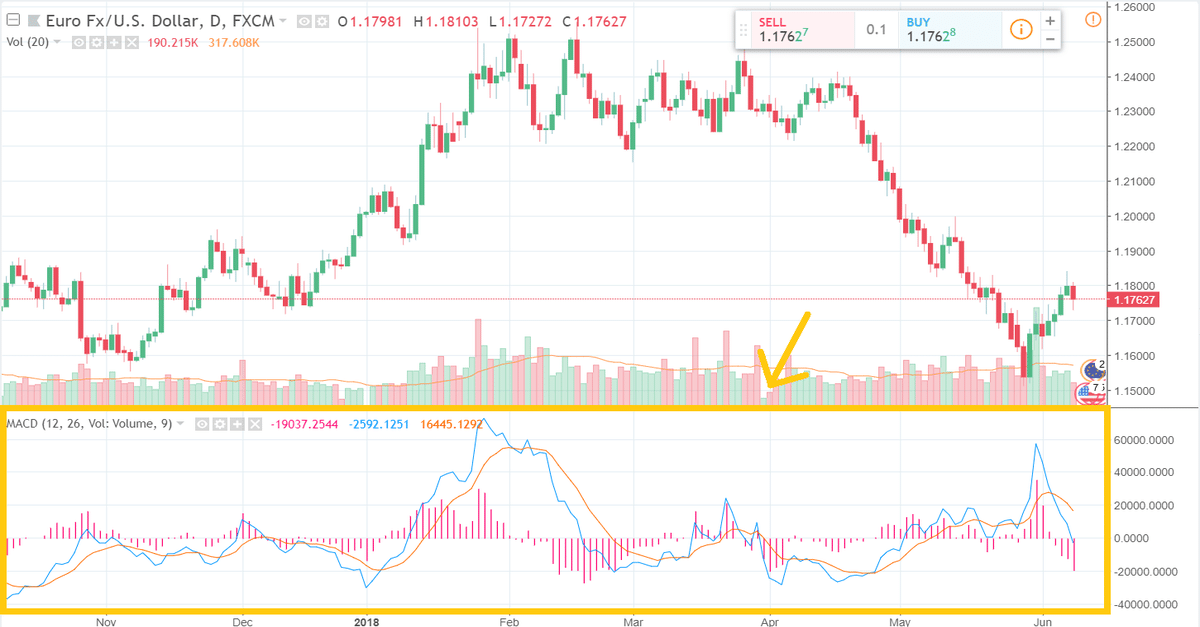
In the MACD chart, there are three numbers for its settings;
- Faster-moving average – the number of periods that are used to calculate
- Slower-moving average – the number of periods that are used
- Difference between the faster and slower moving average – the number of bars that are used to calculate
Examples
The most commonly used MACD parameters are “12, 26, 9”, here’s how to interpret it.
Faster-moving average:
- 12 represents the previous 12 days
Slower-moving average:
- 26 represents the previous 26 days
Difference between the faster and slower moving average:
- 9 represents the previous 9 days moving average or the variation between the fast and slow (plotted by vertical lines called histogram – red lines in the chart above)
Calculation
MACD Line:
(12-day EMA – 26 day EMA)
SignalLine:
9-day EMA of MACD Line
MACD Histogram:
MACD line – Signal line
Your MACD line is the 12-day exponential moving average (EMA) less the 26-day exponential moving average (EMA). You can use closing price for this moving average. The 9-day EMA acts as a signal line and identifies turns because it is plotted with the indicator.
For the histogram, it represents the difference between MACD and its 9-day EMA (Signal Line). If the MACD line is above its Signal Line then its positive and if the MACD line is below its Signal Line, then it is negative.
Remember
The typical settings used as MACD parameters are “12, 26, 9”. You can substitute other values depending on your preference and goals.
How to Trade Using MACD
MACD has two moving averages with different speeds. In other words, one will be quicker to react to price swing movements than the other one.
If a new trend occurs, the fast line will start to cross the slower line. For this reason, the fast line will diverge or move away from the slower line, often indicating a new trend.
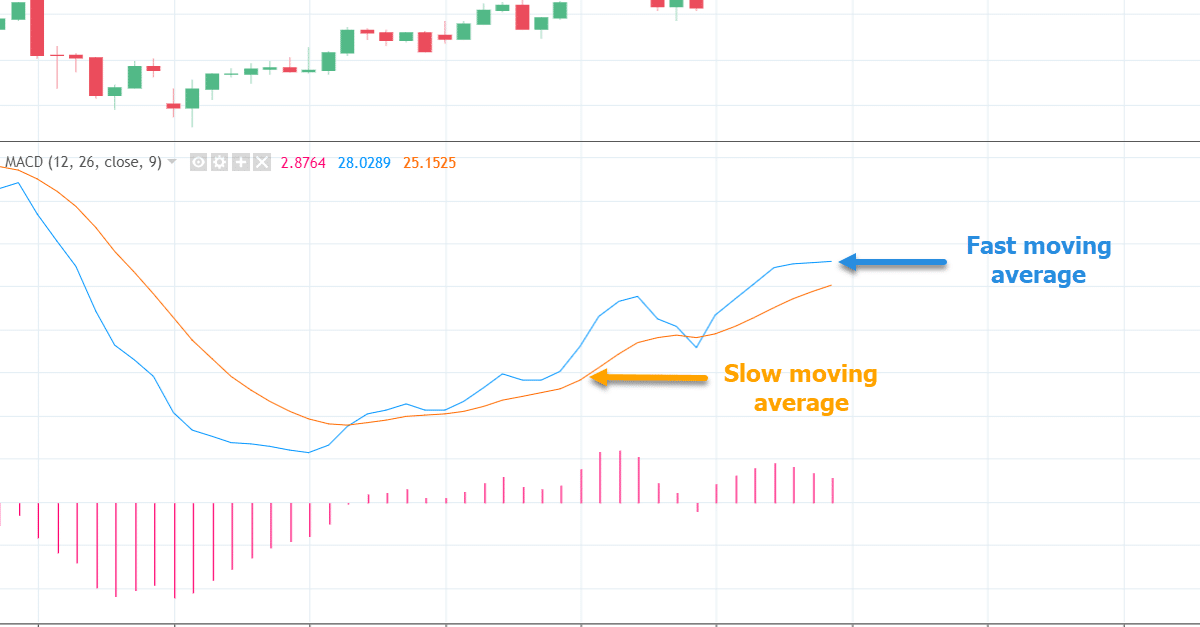
You can see in the image above that when the lines cross, the histogram temporarily disappears because the difference between the lines at that time is 0.
Terminology
The Convergence and Divergence of two moving averages are what MACD implies.
If moving averages move towards each other, it means that a Convergence is occurring. On the other hand, a divergence occurs when the moving averages move away from each other.
There are three different methods to interpret Moving Average Convergence Divergence (MACD).
Crossovers
Signal-line Crossovers
A “signal-line crossover” is a 9-day EMA of the MACD line.
It trails average line and helps determine the turns in the MACD. It shows bullish crossover when the MACD crosses above the signal line, and a bearish crossover if it turns below the signal line.
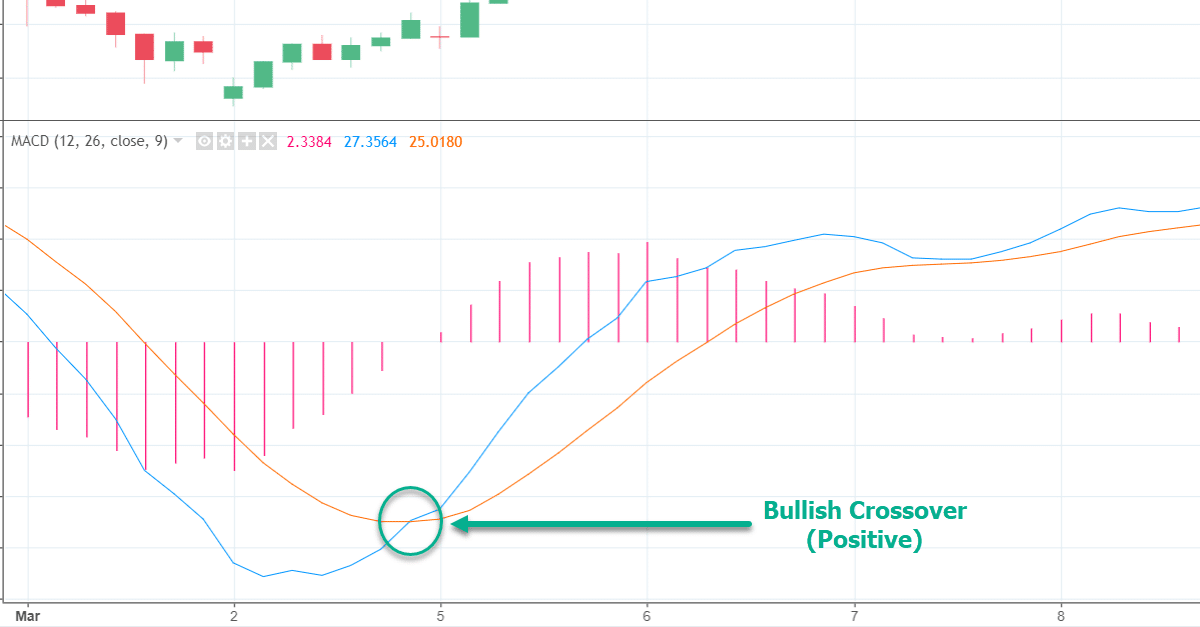
As shown above, the chart clearly shows how a buy entered after the bullish crossover can be profitable. This strategy can also be used to manage or close a short entry.
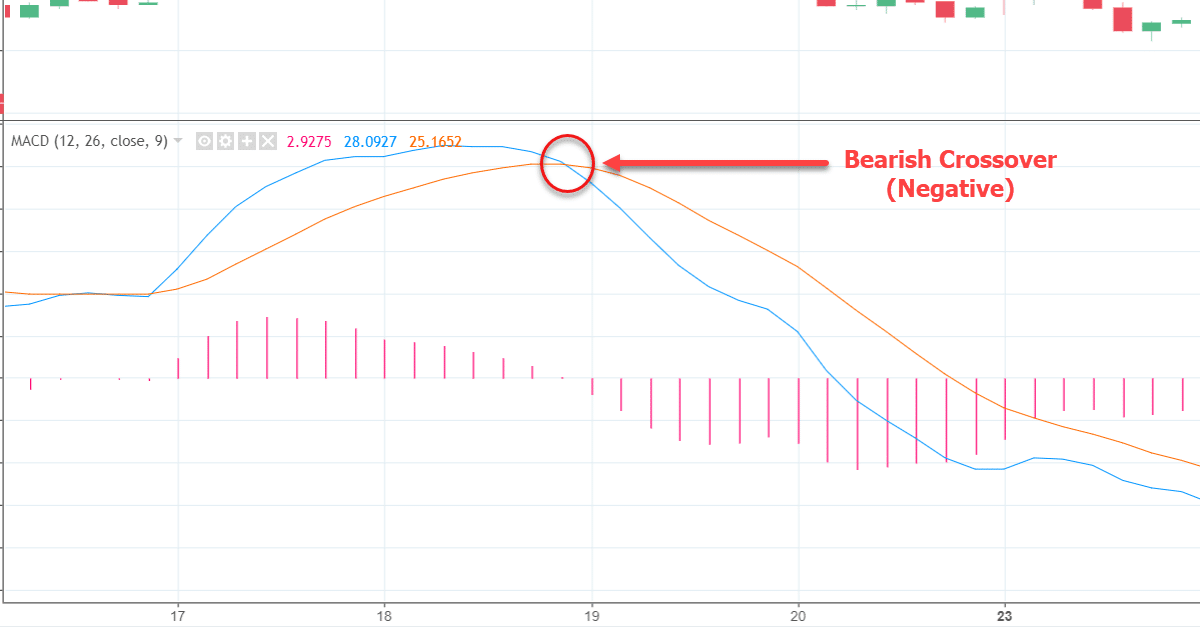
On the other hand, you can use bearish crossovers for short entries or manage/close a long entry.
Center-line Crossover
When the MACD line moves above the zero line to turn positive, then a bullish center-line crossover occurs. This occurs when the 12-day EMA moves above the 26-day EMA.
If the MACD line moves below the zero line to turn negative, then it is a bearish center-line. This occurs when the 12-day EMA moves below the 26-day EMA.
Divergence
If the security price diverges from the MACD, it is a signal of a potential new trend.
This shows a point where the MACD does not follow price action and deviates. When the price action makes a new low, but the MACD does not confirm with a new low, then it is a “positive divergence” or “bullish divergence”.
When the price of a security makes a new low, but the MACD does not confirm with a new high, then it is a “negative divergence” or “bearish divergence”.
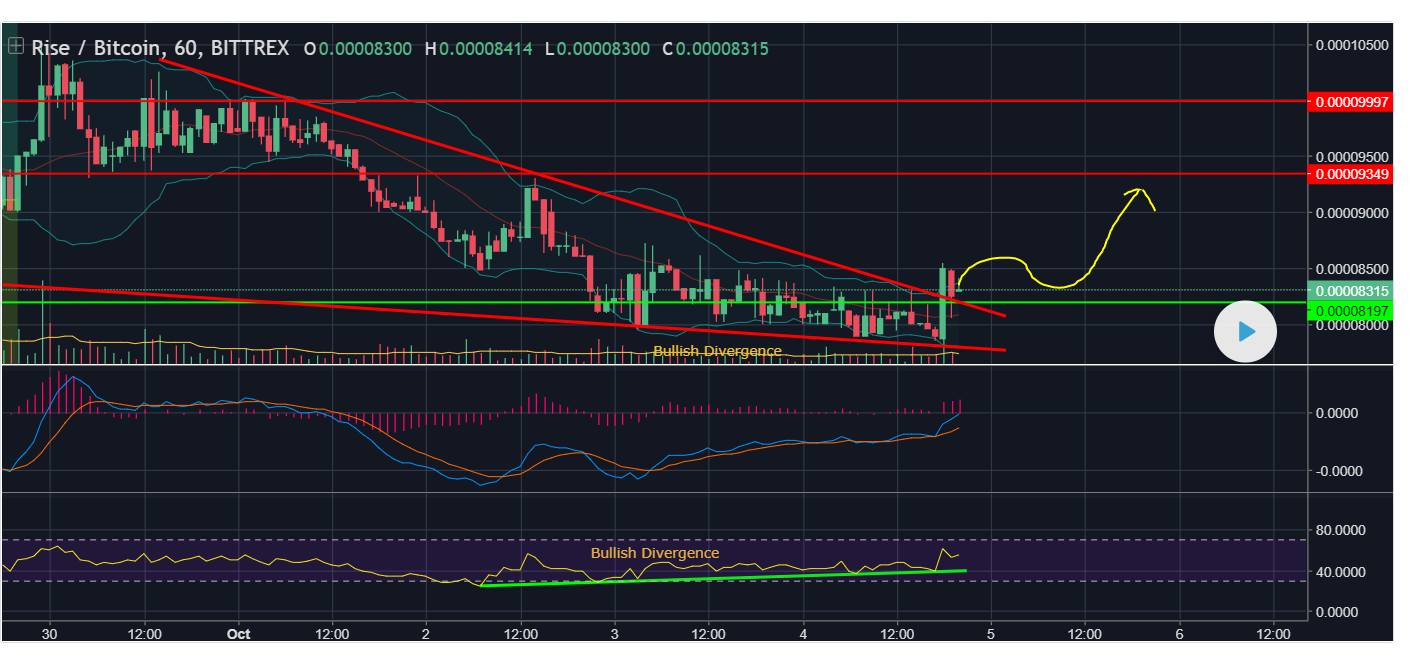
A “Bullish Divergence” or “Positive Divergence” forms when a lower low was recorded by a security and a higher high is created on the MACD.
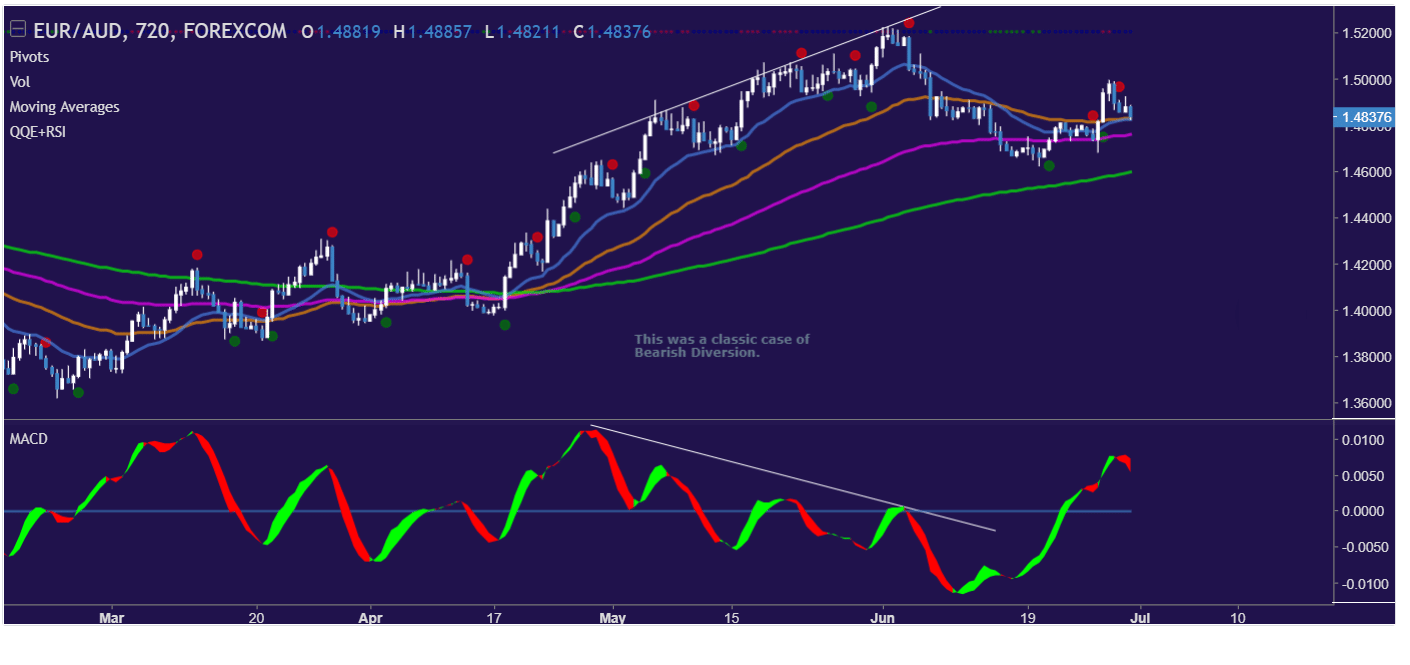
A “Bearish Divergence” or “Negative Divergence” takes place when the security records a higher high and a lower low on the MACD.
What is the Most Popular MACD Combination?
Moving Average Convergence Divergence + Relative Vigor Index (RVI)
The use of Relative Vigor Index is to measure the strength of a trend by comparing the closing price of a security to its price range and smoothing the results with EMA.
In fact, the basic point of combining these tools is to match crossovers. To put it differently, if one of the indicators has a cross, you wait for a cross in the same direction as the other one. If it occurs, you buy or sell the equity and hold your position until the MACD gives you a signal to close the position. See image below;
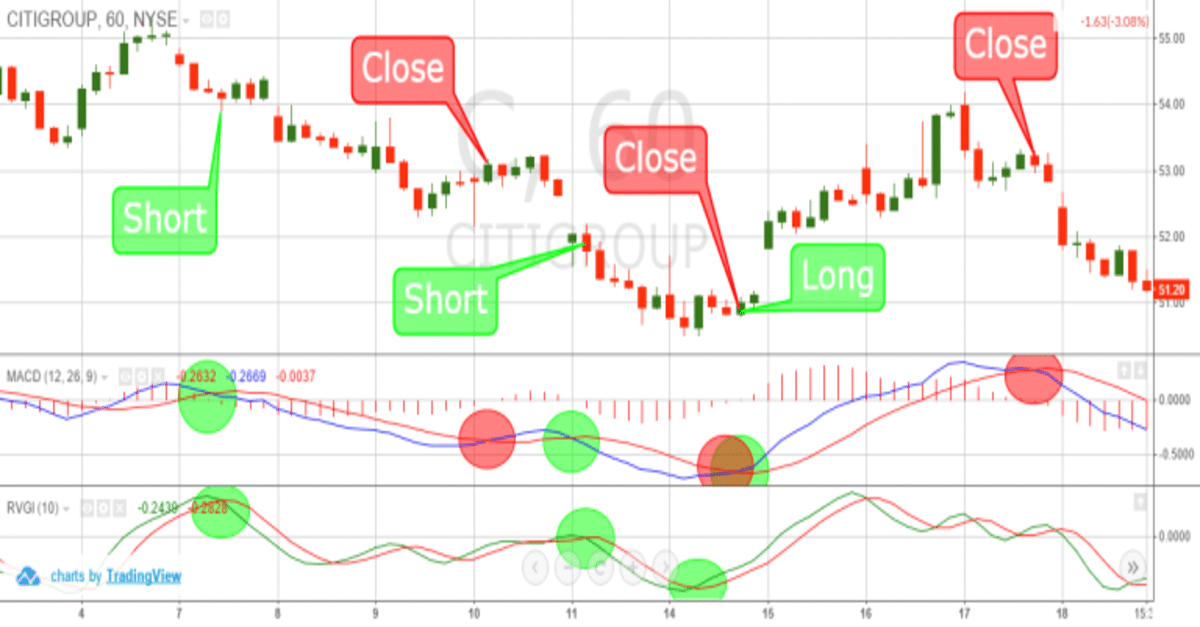
The chart above is the 60-minute chart of Citigroup from December 4-18, 2015. It illustrates that there are two short and one long setups that occur after a crossover between the MACD and the RVI.
The green circles are crossovers and the red circles are where the position should have been closed.
In the final analysis, you would have gained a profit of $3.86 per share with those three positions.
Moving Average Convergence Divergence + Money Flow Index (MFI)
The Money Flow Index – MFI is a type of oscillator that uses both price and volume on measuring buy and sell pressure. It generates less buy and sell signals compared to other oscillators, for the reason that the money flow index requires both price movements and surge to make extreme readings.
This strategy is a combination of the MACD with overbought/oversold stocks or Forex signals produced by money flow index.
If the MFI gives you a signal of a bearish cross over the MACD lines, there is a potential short trade. This strategy is the same way in the opposite direction for long trades.
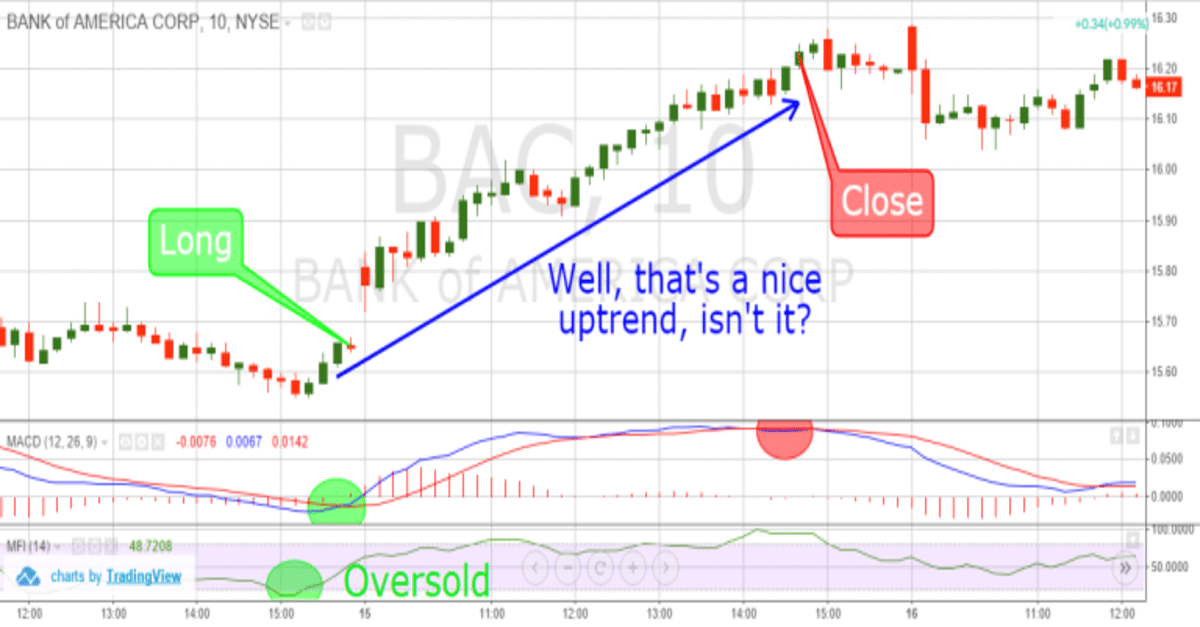
The chart above is the 10-minute chart of Bank of America (BAC). The green circle is the moment when the MFI is signaling that BAC is oversold. After 30 minutes, the MACD has a bullish signal and is now open for a potential long position at the green circle highlighted on the MACD.
You hold your position until the MACD lines cross in a bearish direction as shown in the highlighted red circle on the MACD.
To sum up, this position lets you profit an amount of 60 cents per share for about 6 hours.
NOTE: Get the Free MACD PDF Guide Download Below.
Moving Average Convergence Divergence + Triple Exponential Moving Average (TEMA)
The use of Triple Exponential Moving Average – TEMA is to filter out volatility from conventional moving averages.
It is made up of a single exponential moving average, a double exponential moving average, and a triple exponential moving average.
It can generate a trade signal when the fast line crosses the MACD and the price of a security breaks through the TEMA. You will exit positions whenever you receive contrary signals from both indicators.
The image below is the 10-minute chart of Twitter. In its first highlighted green circle you can clearly see that you have the moment when the prices switch above the 50-period TEMA. The MACD confirms a bullish TEMA signal on the second highlighted circle. This is when you open your long position.
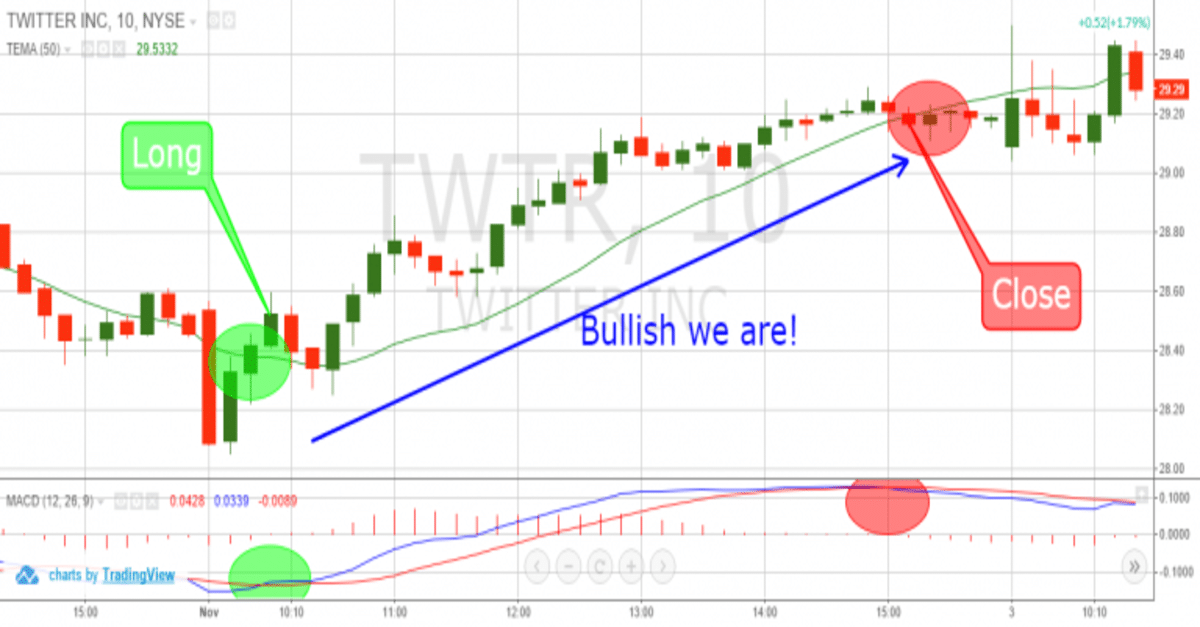
As shown above, the price increases and you get your first closing signal from the MACD in about 5 hours. The price of twitter breaks the 50-period TEMA in a bearish direction after 20 minutes and you close your position. As can be seen, it generated a profit of 75 cents per share.
Moving Average Convergence Divergence + Triple Exponential Average (TRIX)
The use of a Triple Exponential Average – TRIX is to be a momentum indicator. It is an oscillator used to identify oversold and overbought markets.
This strategy offers two options for exiting the market.
- If the MACD makes a cross in the opposite direction, exit the market.
This gives you the tighter and more secure exit strategy. You exit the market right after the trigger line breaks.
- If the MACD makes a cross that is followed by the TRIX breaking the zero line, exit the market.
This strategy is riskier because if there is a significant change in trend, you are in your position until the zero line of the TRIX is broken. It could take a while for that to happen.
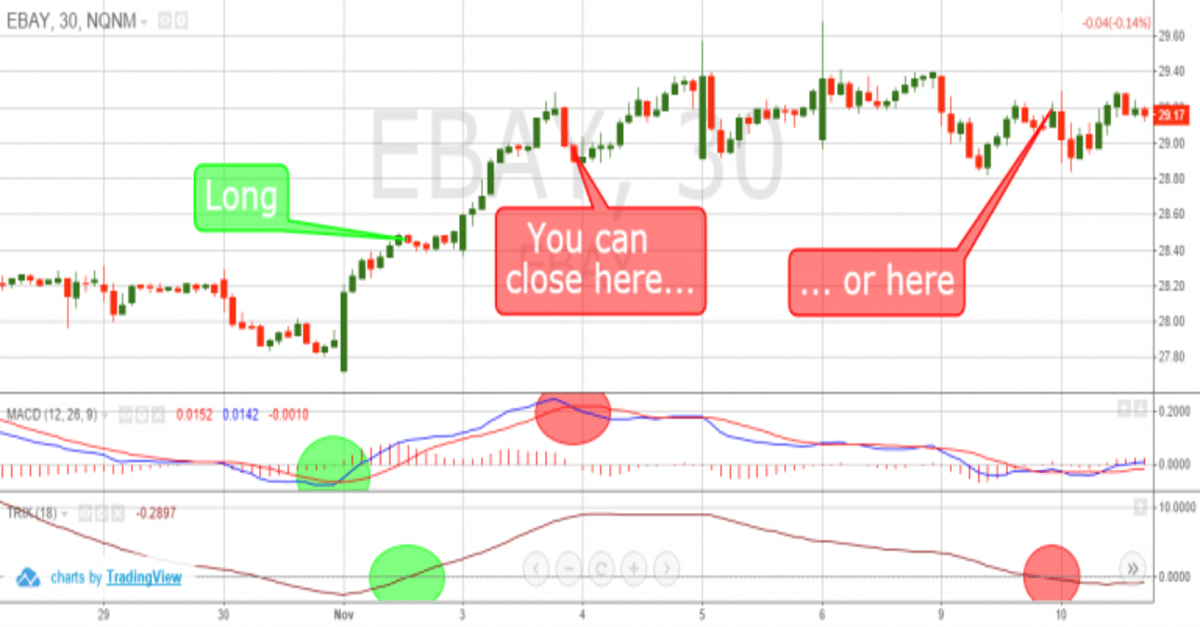
The image above shows the 30-minute chart of eBay. As shown above, the first green circle is a long signal that comes from the MACD. The second highlighted green circle is when the TRIX breaks zero and you enter a long position. On the other hand, the two red circles show contrary signals from each indicator.
In the first case, the MACD gives you the option for an early exit, while in the second case, TRIX keeps you in position. By using the first exit strategy, you would have gained a profit of 50 cents per share, while the alternative approach will generate a profit of 75 cents per share.
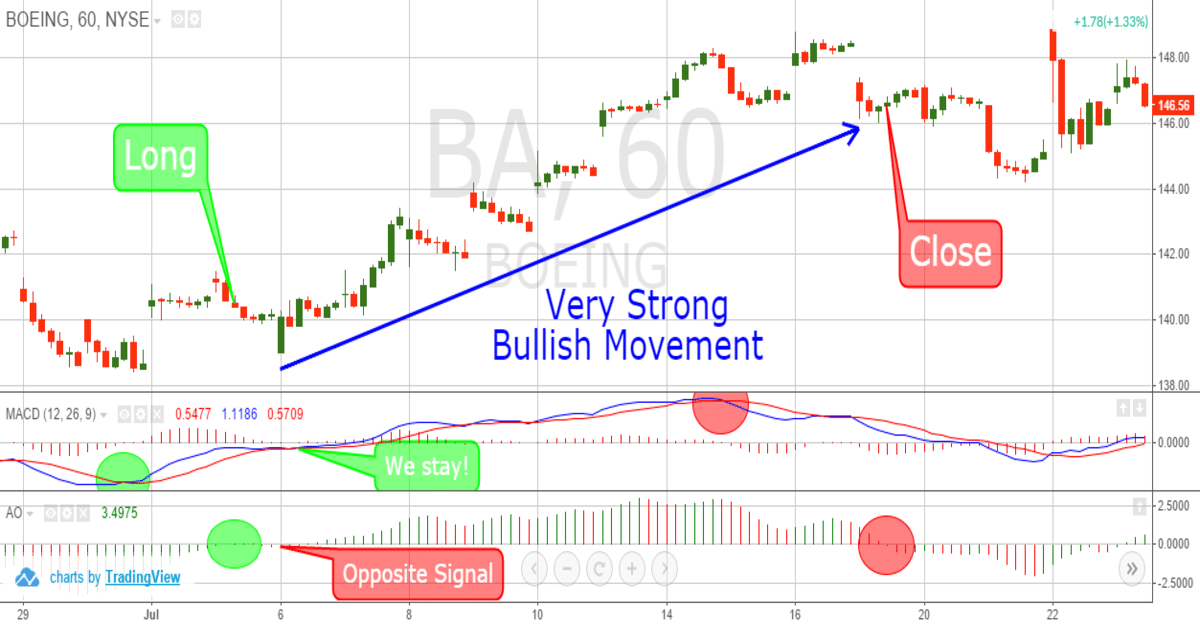
Moving Average Convergence Divergence + Awesome Oscillator (AO)
The use of this indicator is to measure market momentum. The Awesome Oscillator calculates the difference of the 34 and 5-period Simple Moving Averages.
You will enter and exit the market only when you receive a signal from the MACD, confirmed by the awesome oscillator.
Below is the 60-minute chart of Boeing. The two highlighted green circles are signals that indicate to open a long position. The Awesome Oscillator gives you a contrary signal after going long.
Yet, the MACD does not produce a bearish crossover, so you stay with your long position. The first red circle highlights when the MACD has a bearish signal. The second red circle highlights the bearish signal generated by the AO and you close your long position. Altogether, this long position generated a profit of $6.18 per share.
Recap
The best thing about the MACD indicator is that it brings together momentum and trends into one indicator.
As has been noted, you can calculate it by using the difference between two moving averages.
For this reason, the MACD values are dependent on the price action of the underlying security and knowledge of other strategies like technical analysis will improve it’s effectiveness.
NOTE: Get the Free MACD PDF Guide Download Below.
