AUDCAD Trade Analysis
Current Trend: Uptrend.
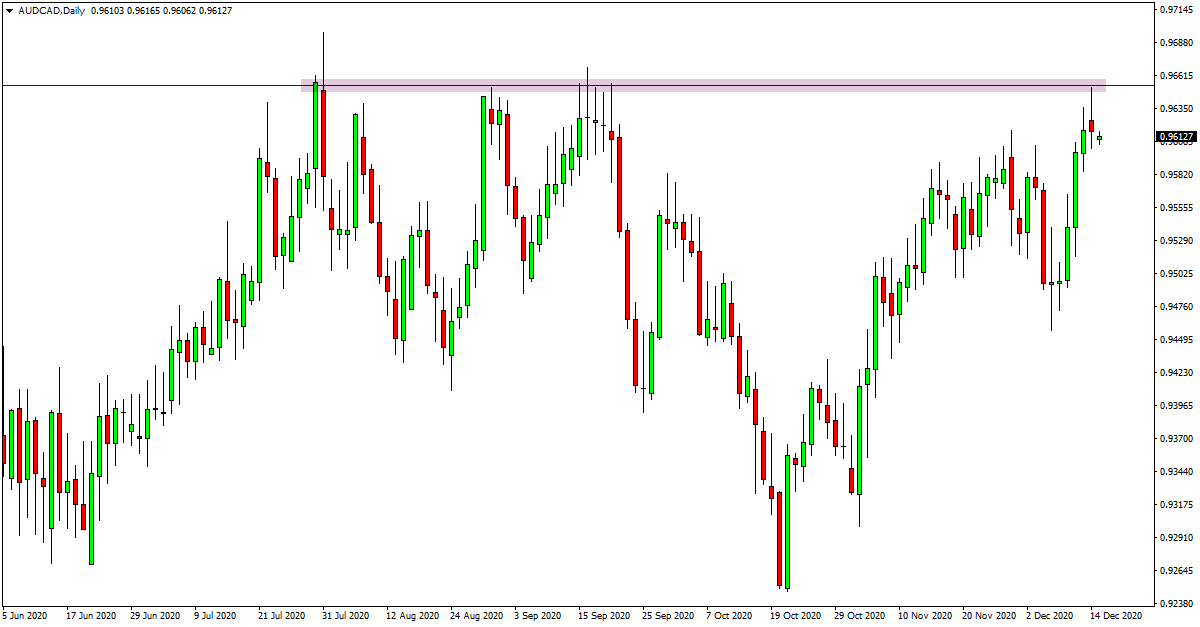
Support Levels: 0.9602.
Resistance Levels: 0.9653.
AUDCAD Daily Chart
AUDCAD Trade Ideas
In yesterday’s trading analysis we discussed the AUDCHF and this pair is showing very similar price action.
Price has tested the same major resistance on the daily chart four times this year and at each test has been unable to breakout higher.
This could soon change as price has been building momentum higher.
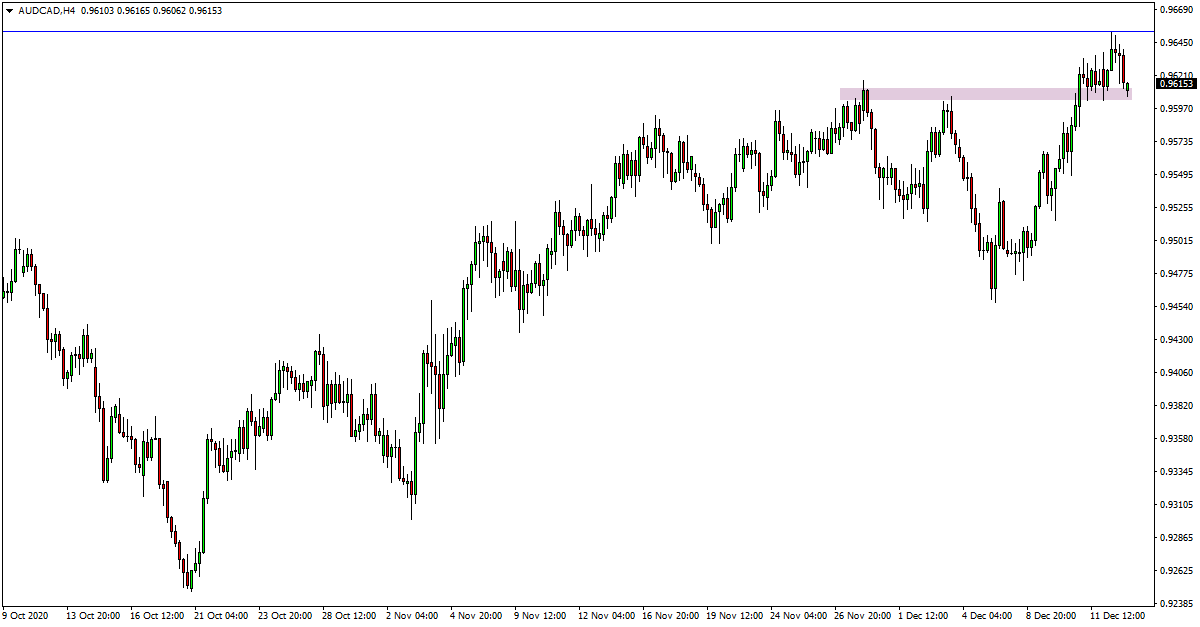
As the attached daily chart shows, we now have a recent higher low. On the 4 hour chart we can also see that there is an important role reversal support level that is propping price up.
If this intraday support can hold with the momentum continuing to build higher, then I will start to look for breakouts higher. If price can move above the recent swing high this could activate potential breakout trades.
AUDCAD 4 Hour Chart
GBPAUD Trade Analysis
Current Trend: Sideways range.
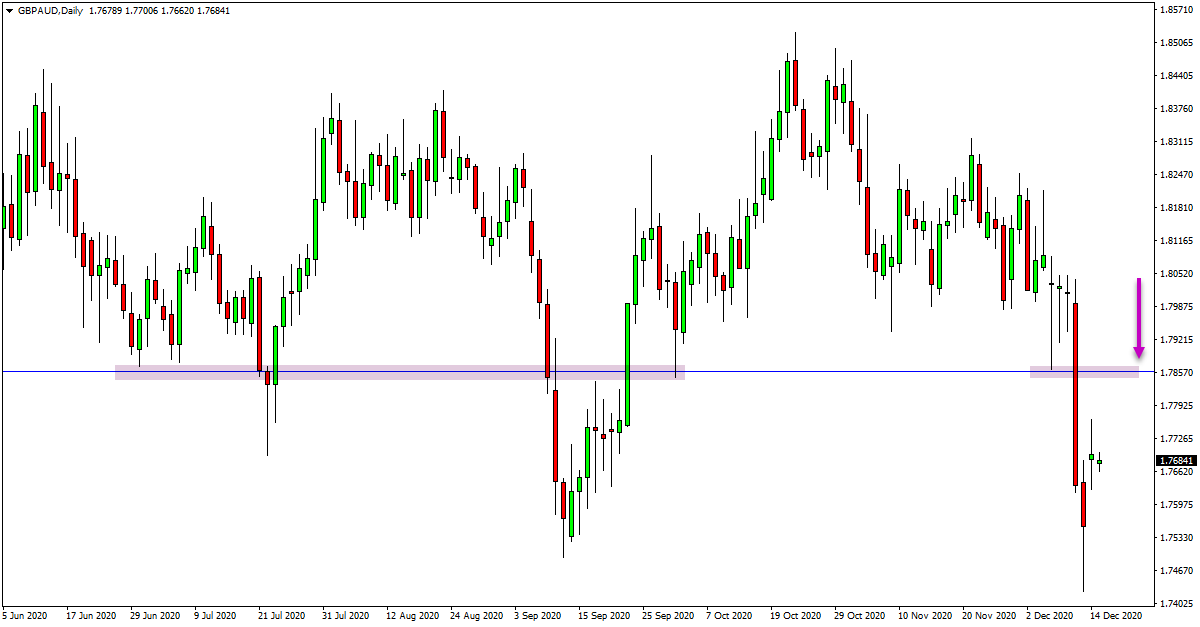
Support Levels: 1.7494.
Resistance Levels: 1.7863.
GBPAUD Daily Chart
GBPAUD Trade Ideas
Whilst this pair is in a very sideways range, there are still some key levels that could provide potential trading opportunities.
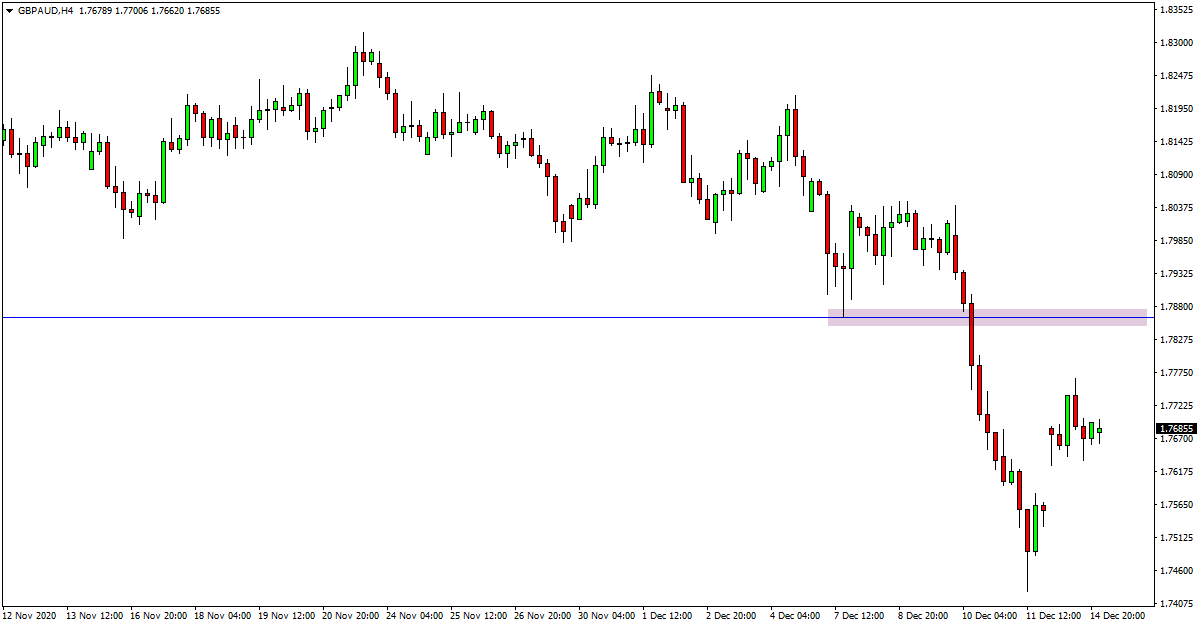
As the attached daily chart shows, price has recently made a strong breakout lower and through the daily support level.
This level could now look to become a new role reversal and resistance area.
If price pushes back higher into this level in the coming sessions, then we could start to look for new short trades on the daily and also intraday time frames.
Short trades at this level would be at a key level and inline with the very short-term momentum lower.
GBPAUD 4 Hour Chart