AUDJPY Trade Analysis
Current Trend: Uptrend.
Support Levels: 77.12.
Resistance Levels: 78.35.
AUDJPY Daily Chart
AUDJPY Trade Ideas
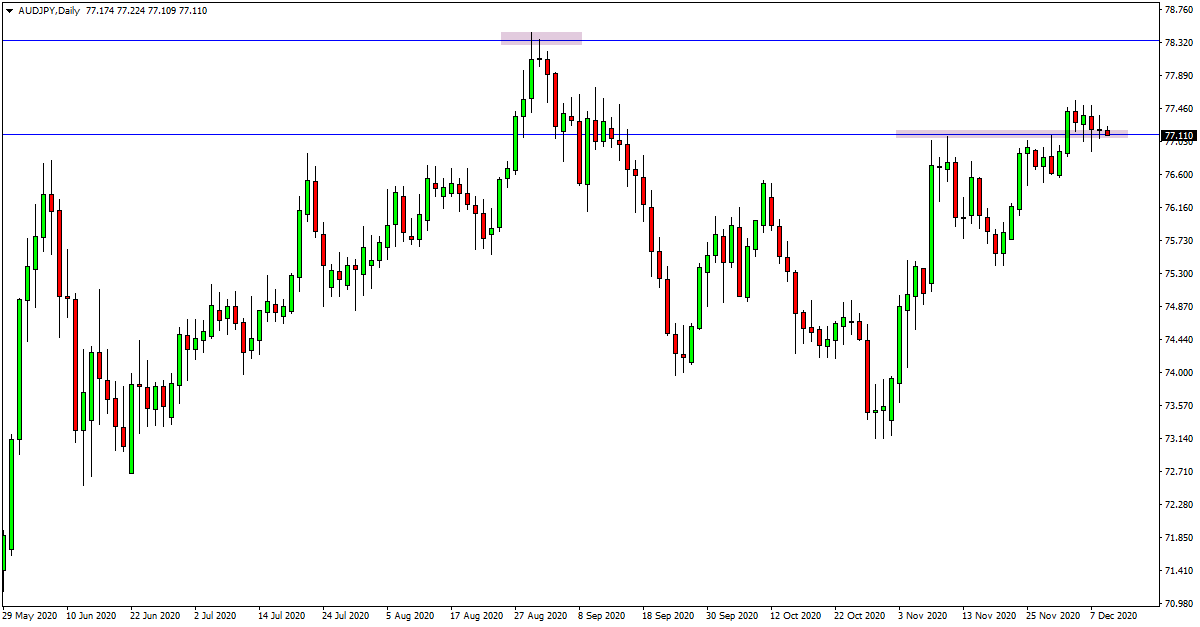
Price action on the daily chart of the AUDJPY is now hovering around an important role reversal level.
As the attached daily chart shows, price in recent times has been in a strong move higher. Price in the last few sessions however has stalled and has moved into a tight sideways pattern.
This sideways pattern is formed just on top of the daily support level around 77.12. This level was recently a strong resistance level and it once again looks to hold the key.
Price has formed a small daily chart inside bar showing price action indecision.
For any continuation of the recent bullish momentum we are going to need to see this role reversal support level continue to hold and for price to break through the highs of the consolidation pattern.
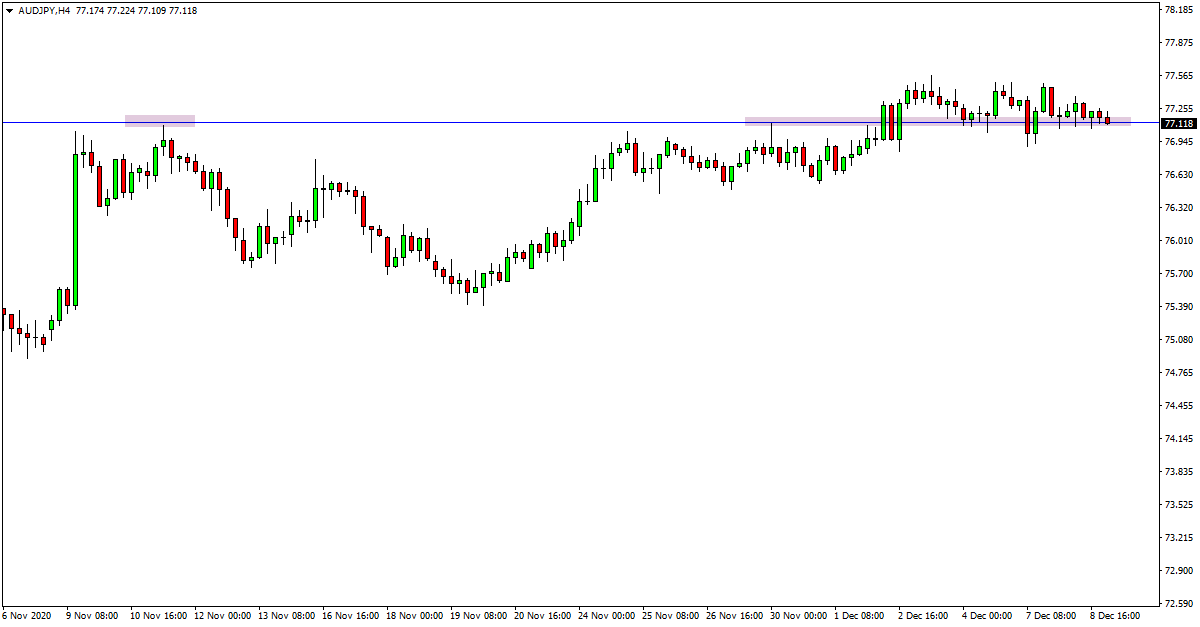
AUDJPY 4 Hour Chart
GER30 Trade Analysis
Current Trend: Uptrend.
Support Levels: 13028.19.
Resistance Levels: 13445.08.
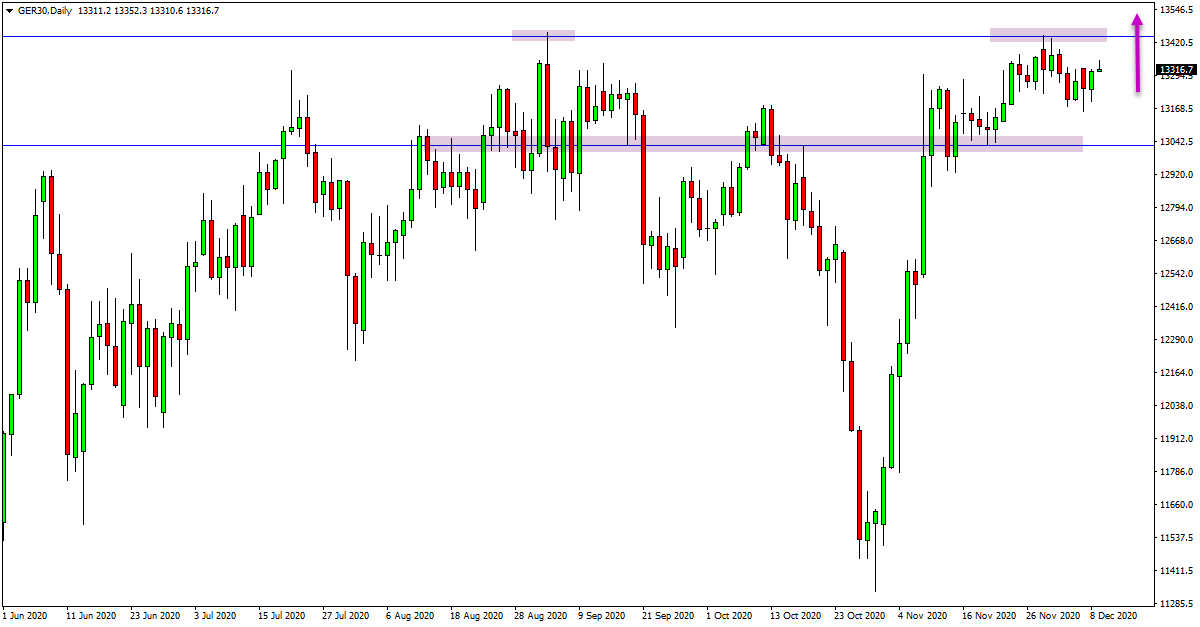
GER30 Daily Chart
GER30 Trade Ideas
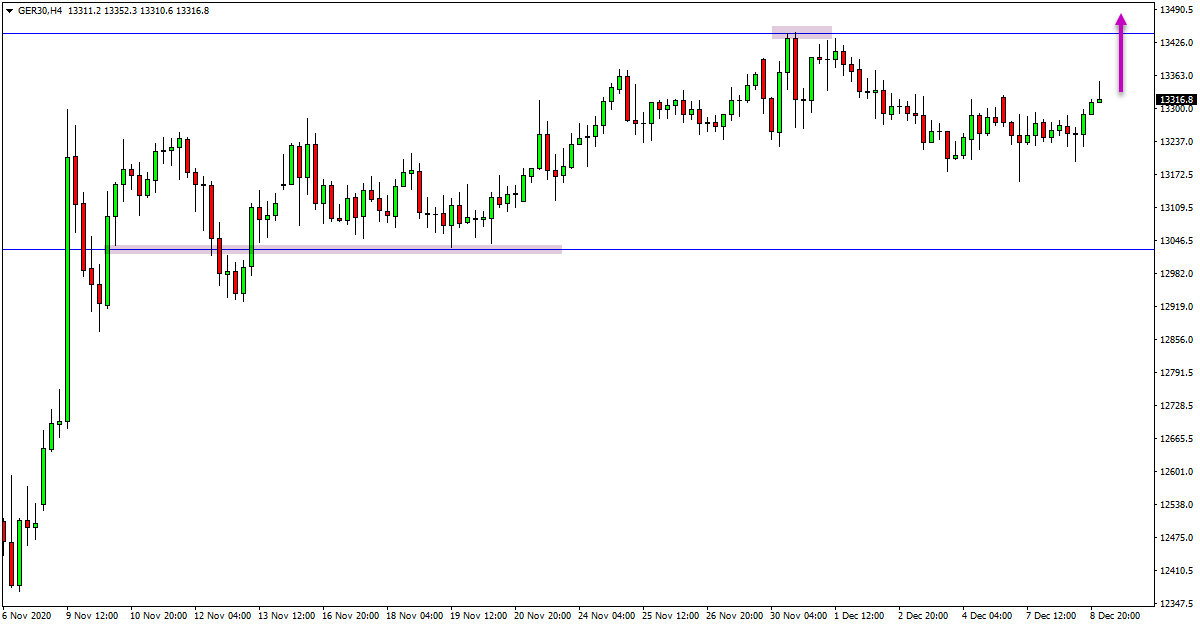
After a very strong move higher, price in recent sessions has stalled.
As the attached daily chart shows, price has moved higher into resistance before moving into consolidation.
This resistance around 13445.08 has been a key level in recent months and looks to hold the key for the next major move in this market.
I am now looking for this level to break and for potential long trades to activate.
Any potential long trades would need to see price move through this resistance level, but if that can happen we could then look for price to move into the yearly highs that were set all the way back in February.
GER30 4 Hour Chart