GBPAUD Trade Analysis
Current Trend: Sideways range.
Support Levels: 1.7872.
Resistance Levels: 1.8000
GBPAUD Daily Chart
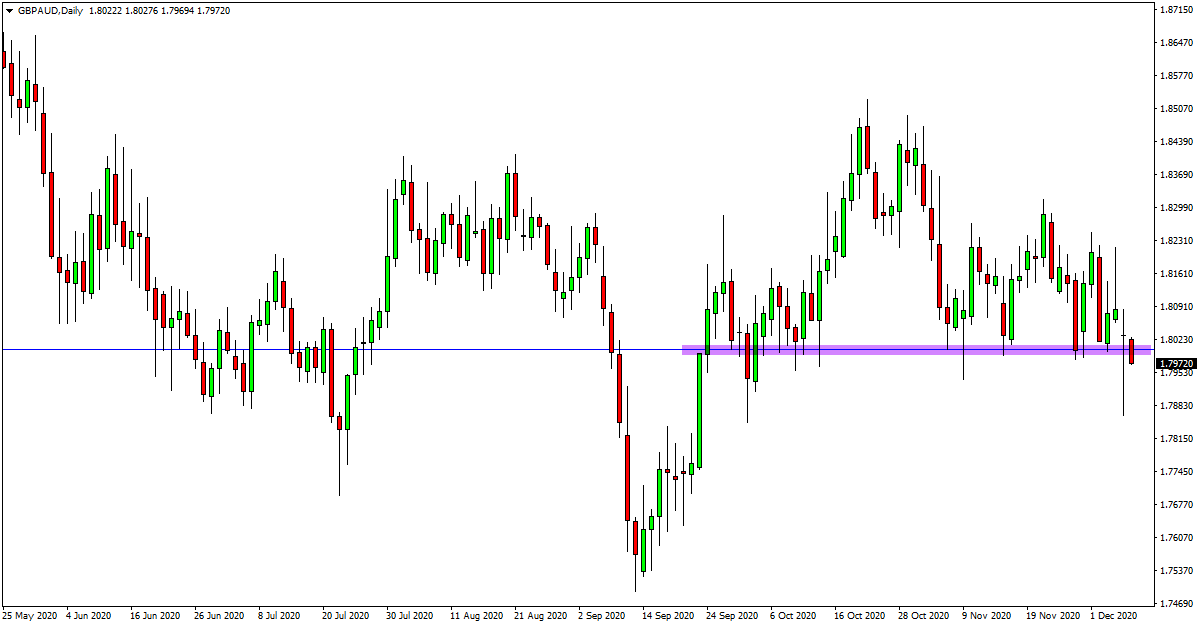
GBPAUD Trade Ideas
Price action is at a key point in this pair for where it heads next.
As the daily chart shows, price is hovering around a major daily chart support and resistance level. This level is also a major psychological round number of 1.8000.
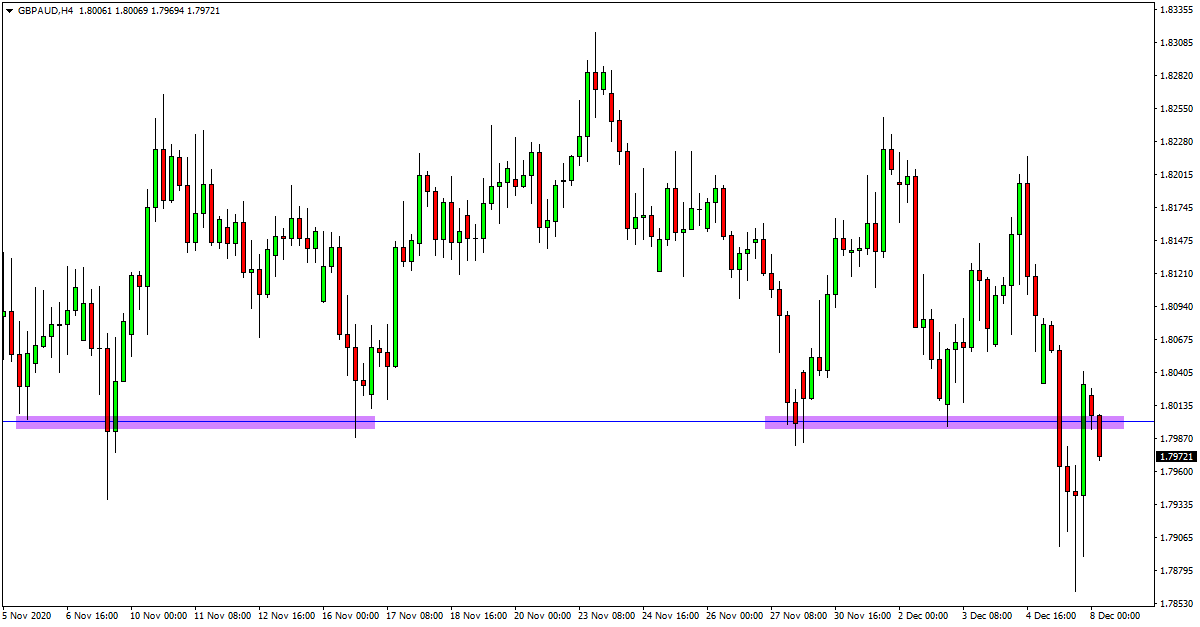
After attempting to breakout lower in the last session, price quickly reversed and snapped back higher.
As the 4 hour chart shows, price moved back higher to test the old support and new role reversal resistance level.
This level now looks to hold the key. If we can see a rejection of this level, then we could look for a new extended leg lower with potential short trades.
GBPAUD 4 Hour Chart
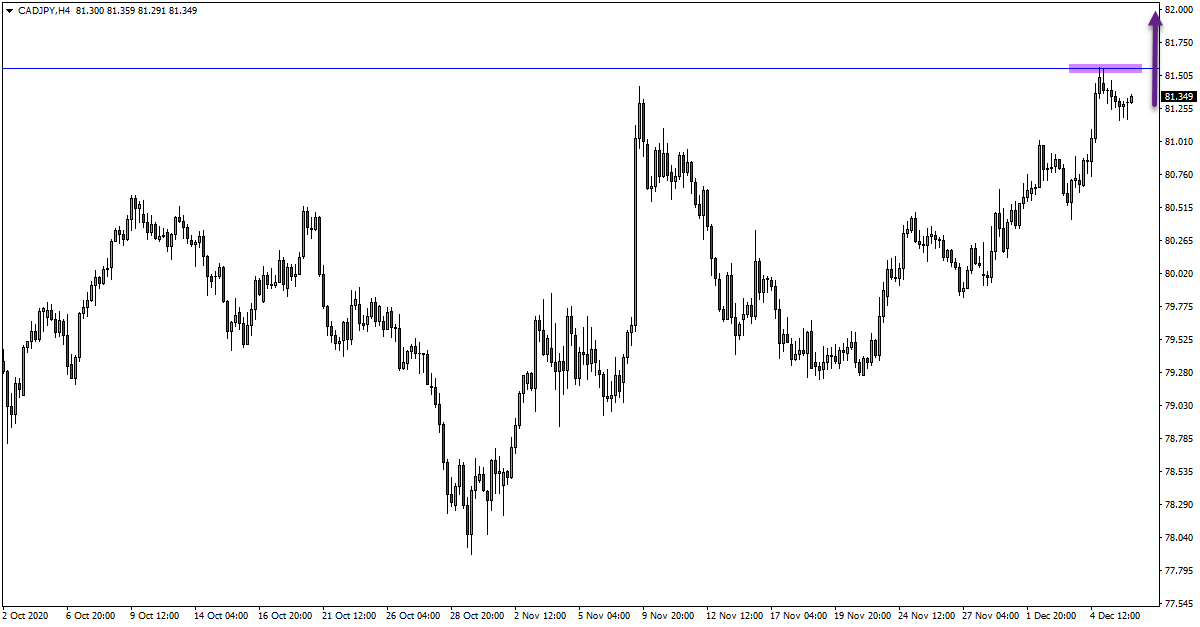
CADJPY Trade Analysis
Current Trend: Uptrend.
Support Levels: 80.64.
Resistance Levels: 81.55.
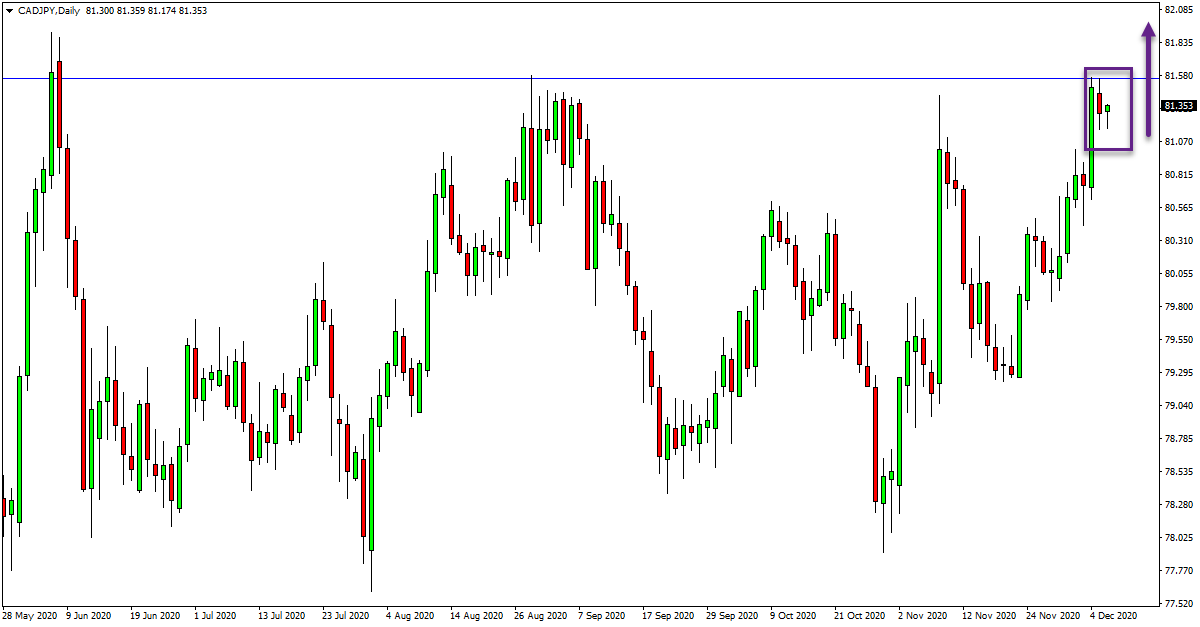
CADJPY Daily Chart
CADJPY Trade Ideas
Price action on the daily chart of this pair has now formed an inside bar.
This inside bar comes on the back of a strong move higher in recent times. As the attached daily chart shows, this inside bar is also formed at the daily resistance level.
This pause and consolidation at resistance is to be expected after such a strong move higher in recent times.
Whilst this level has held strongly in recent times, if price can break higher and through the inside bar, then it could activate potential long trades.
Long trades would be inline with the recent strong momentum higher and would open the way for price to move into the open space out higher.
CADJPY 4 Hour Chart