GBPAUD Trade Analysis
Current Trend: Sideways range.
Support Levels: 1.7425.
Resistance Levels: 1.7863.
GBPAUD Daily Chart
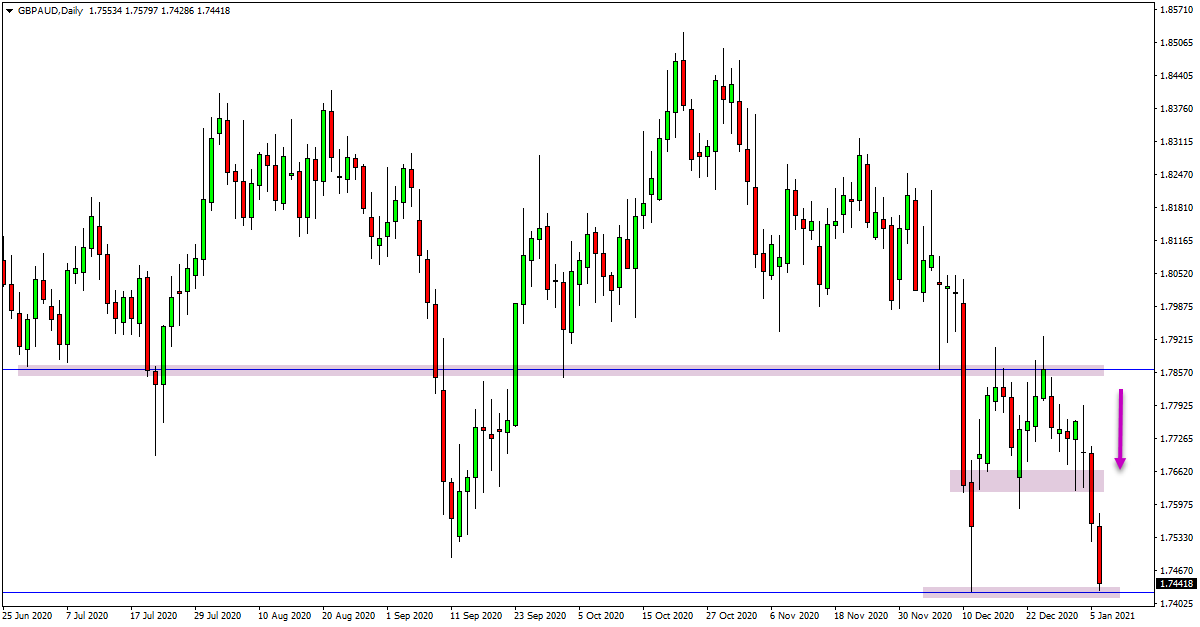
GBPAUD Trade Ideas
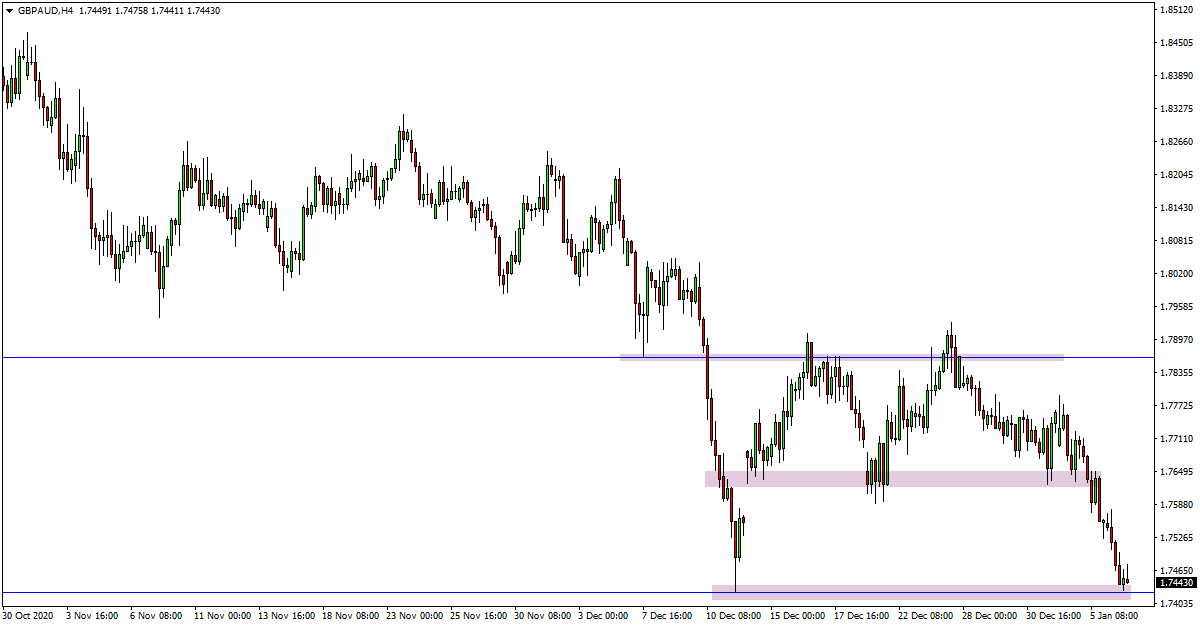
Price action on the GBPAUD daily chart has been trading in a box and range pattern.
Whilst there is an overall larger range in play, price has been moving from box to box. As the attached daily and 4 hour chart shows, price is now in another one of these boxes with a clear high and low.
Price is now testing the box support level and we could look to see if this level holds and price pops back higher.
If we can get a quick move back higher we can look for short trades.
There is a resistance of interest around 1.7592 that could provide a potential level to look for new short trades in the coming sessions.
GBPAUD 4 Hour Chart
NZDCHF Trade Analysis
Current Trend: Uptrend.
Support Levels: 0.6300.
Resistance Levels: 0.6383 and 0.64253.
NZDCHF Daily Chart
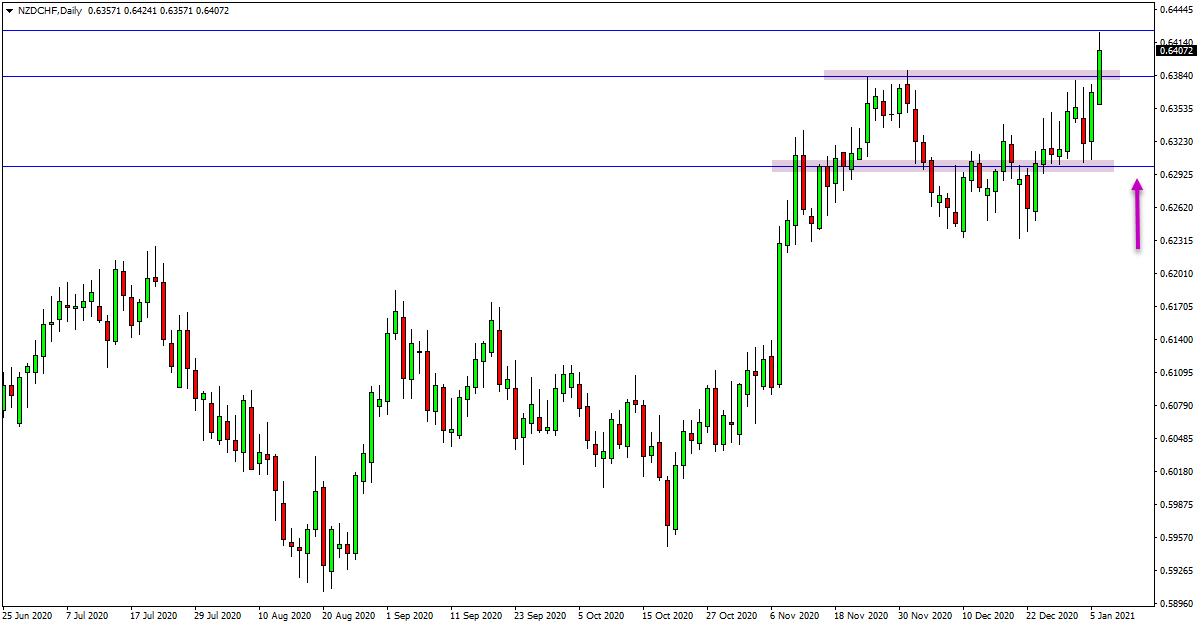
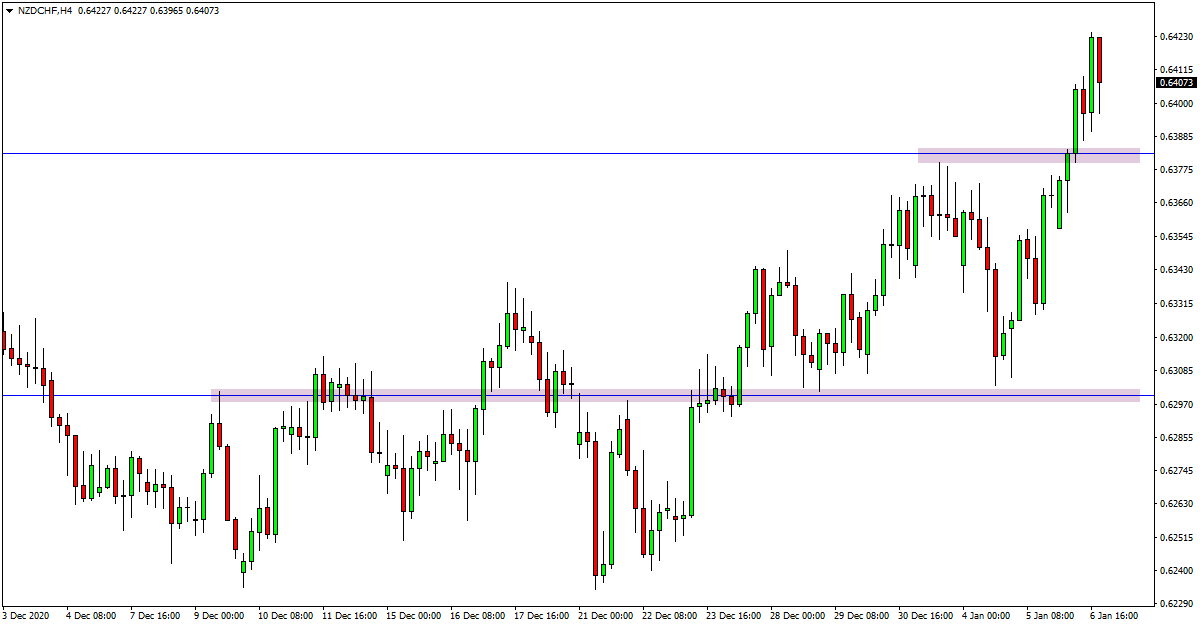
NZDCHF Trade Ideas
Price action on the daily chart of the NZDCHF is now trying to breakout higher and through a swing high resistance level.
This level around 0.6383 looks a key level to watch in the coming sessions.
Whilst the overall trend is higher on this pair, it would not surprise to see price make a false break of this level and make a move back lower.
Until we see whether this level successfully breaks higher or it turns into a false break I will continue to monitor it.
I would prefer to see price pullback lower into the daily support and round number around 0.6300 where new long trades inline with the trend higher could be looked for.
NZDCHF 4 Hour Chart