GBPCHF Trade Analysis
Current Trend: Short-term higher.
Support Levels: 1.1969.
Resistance Levels: 1.2203.
GBPCHF Daily Chart
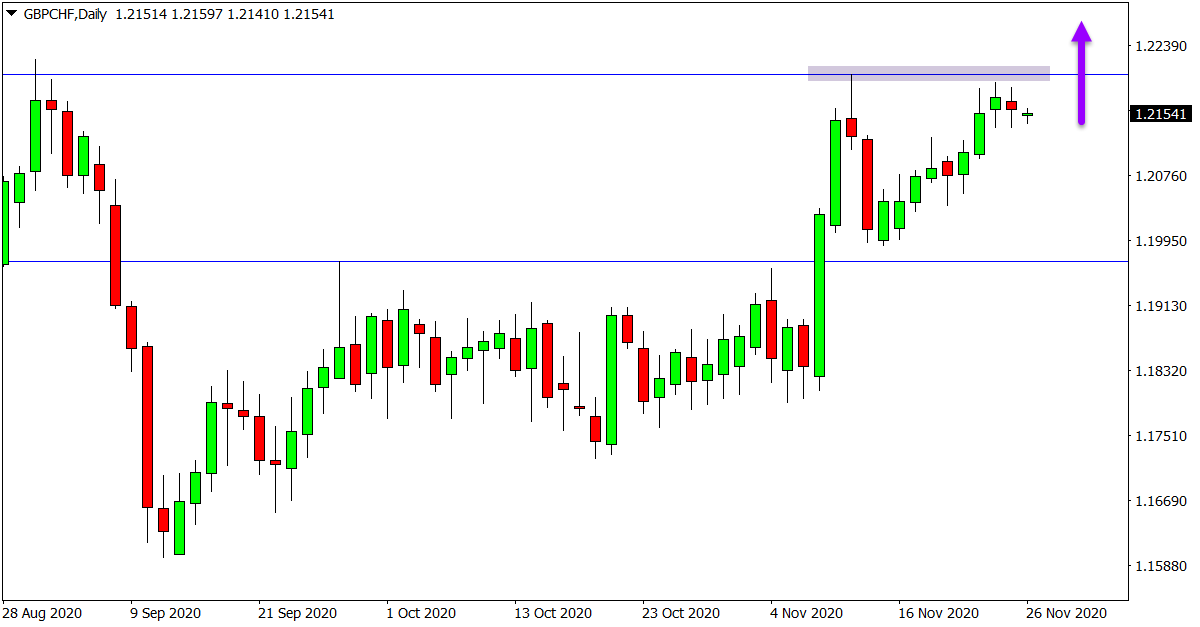
GBPCHF Trade Ideas
This looks a very interesting pair to keep a close eye on in the coming sessions.
Whilst we have a fairly clear-cut overall sideways range pattern, price in more recent times has been building bullish momentum.
This momentum could now look to make a new test of the major daily resistance level and a fresh breakout higher.
If we can see a breakout higher in the coming sessions, then it could activate long trades inline with the recent bullish momentum.
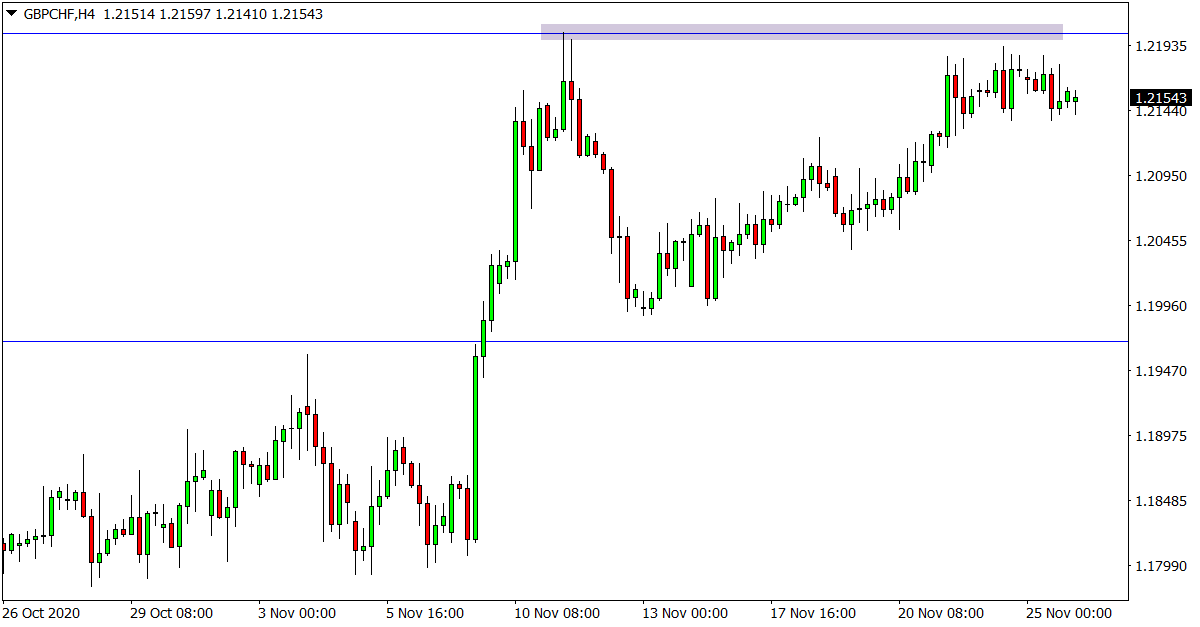
GBPCHF 4 Hour Chart
GOLD Trade Analysis
Current Trend: Lower on intraday time frames.
Support Levels: 1759.35.
Resistance Levels: 1850.12.
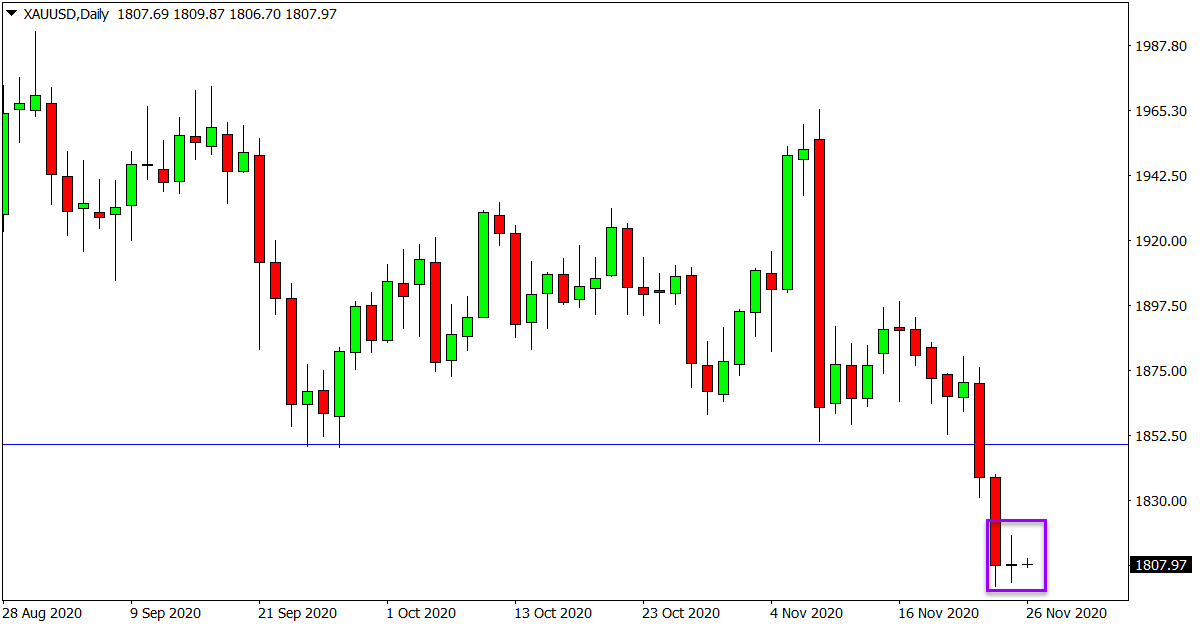
GOLD 4 Daily Chart
GOLD Trade Ideas
We recently discussed this market and the bearish momentum price was building for a breakout lower.
Price has now filled the breakout and has also formed a small daily chart inside bar.
As the attached daily chart shows, this is a small consolidation candlestick after the large breakout and it is a price action pattern you will commonly see after a large move.
If price can now move lower and break the consolidation and inside bar lows, then we can look for this momentum to continue and another large leg lower into the next support around 1759.35.
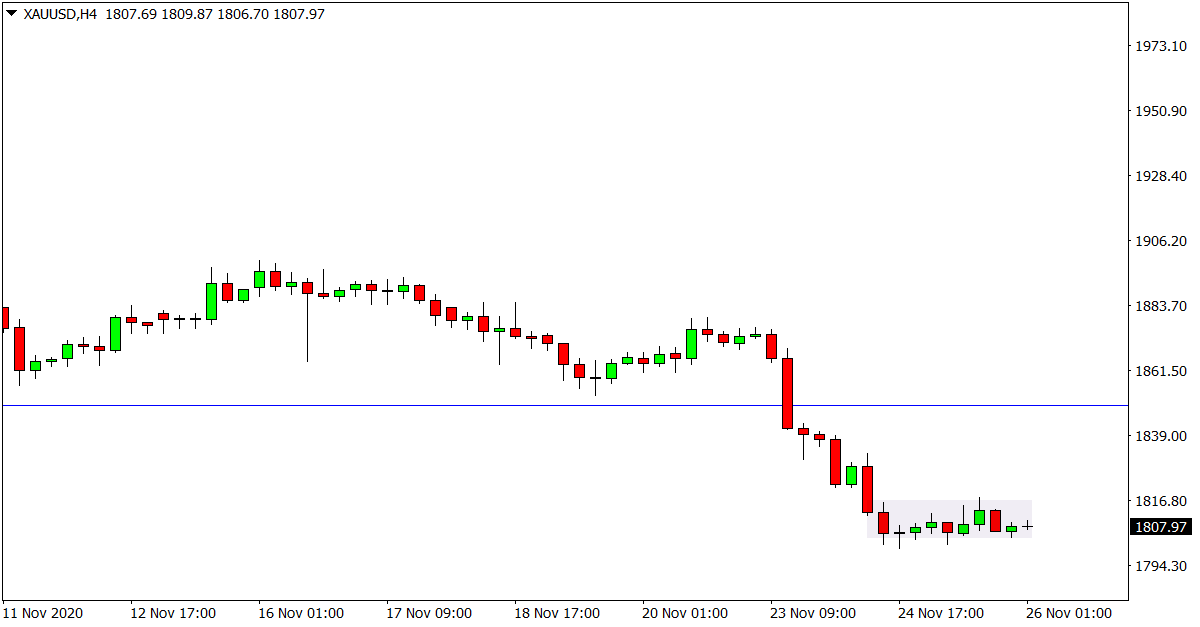
GOLD Hour Chart