GBPJPY Trade Analysis
Current Trend: Very sideways range.
Support Levels: 137.52.
Resistance Levels: 140.31.
GBPJPY Daily Chart
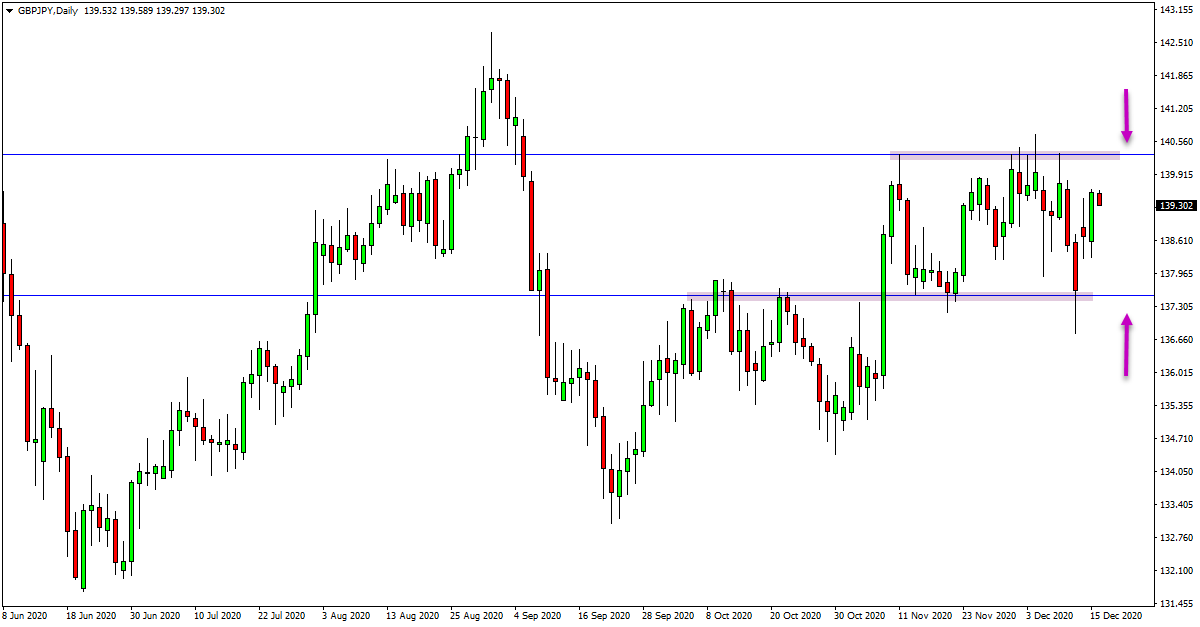
GBPJPY Trade Ideas
Price action on the GBPJPY is currently stuck in a very sideways range pattern.
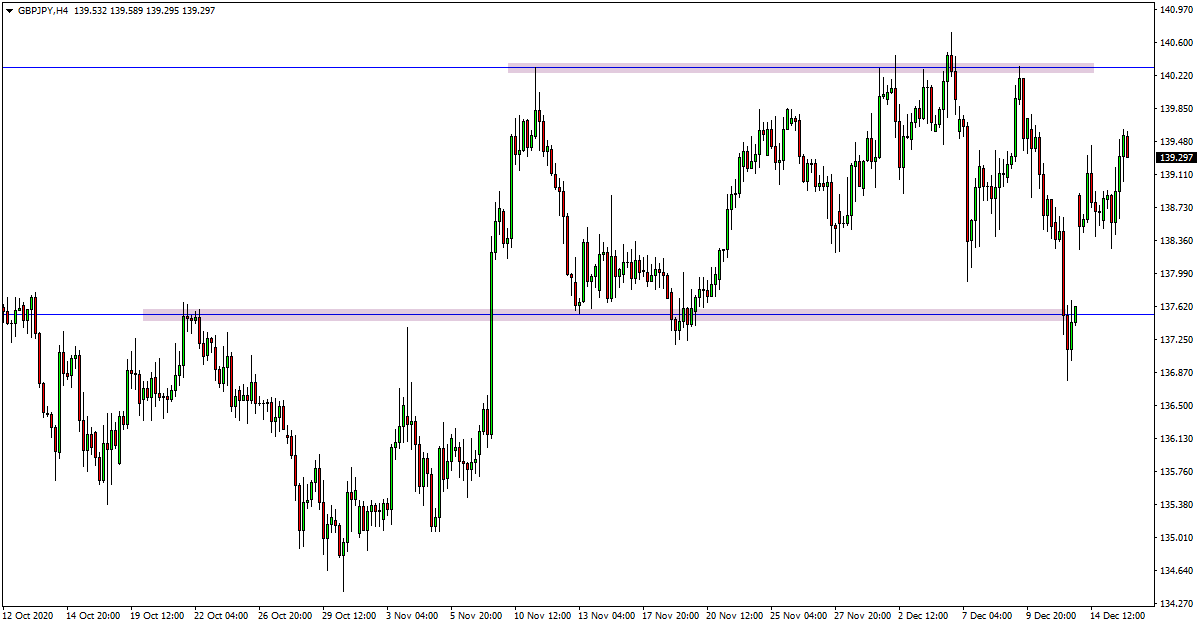
The attached 4 hour chart shows this sideways ranging price action the clearest. Price in the last four weeks has been trading within the same support and resistance levels.
Whilst this continues to hold and price continues to range, the best play looks to be finding trades from the range high and low support and resistance area.
With that in mind, I am not looking to make any trades within this range as the price action is far too choppy. Any potential trades would need to be taken from the main support or resistance levels.
GBPJPY 4 Hour Chart
CHFJPY Trade Analysis
Current Trend: Uptrend.
Support Levels: 116.57.
Resistance Levels: 117.63.
CHFJPY Daily Chart
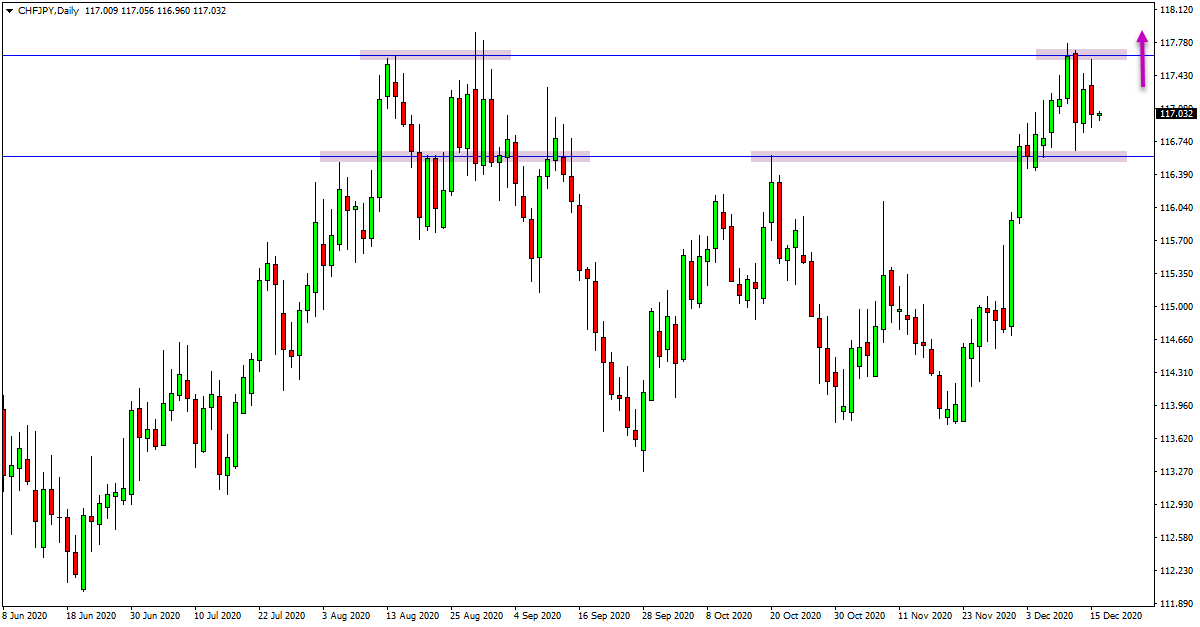
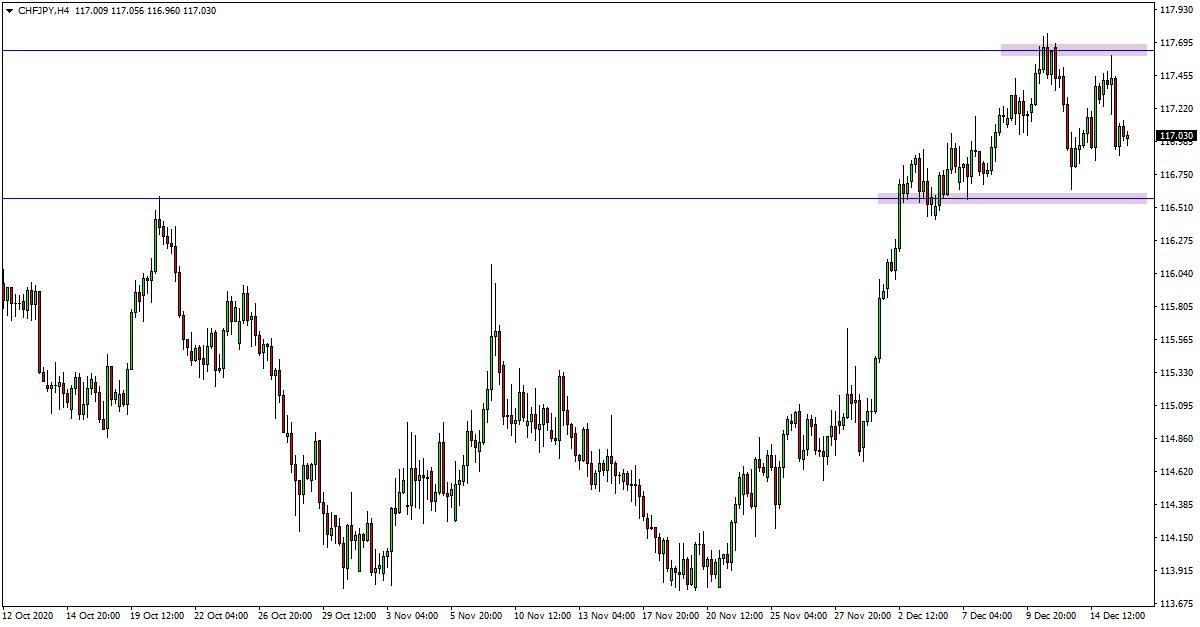
CHFJPY Trade Ideas
Whilst this JPY has also been in a tight range and box in recent sessions, in the medium term the momentum has been higher.
The box and range is tighter on this pair and instead of looking to make range trades, I would far prefer to look for long trades if price can break through the daily resistance level.
If price can look to break through this resistance around 117.63, then it could activate potential long trades.
There is a solid amount of space for price to move higher into with the next resistance of importance coming in around 118.53.
CHFJPY 4 Hour Chart