Whilst a lot of traders will use the daily chart time frame to make their trades, one of the best charts that you can use to make high probability trades is the 4 hour chart.
The 4 hour chart is suited to many styles of trading from swing trading through to reversal and momentum trading.
In this post we go through why you would want to use the 4 hour time frame and two H4 trading strategies you can start using in your own trading.
Table of Contents
Why Use the 4 Hour Chart?
The 4 hour chart is the perfect happy medium between being a small time frame such as the five or fifteen minute time frame and a longer time frame such as the daily chart.
With the 4 hour chart you are still able to see the intraday price action clearly, but you are also not prone to the whipsaw and gaps that can occur on time frames such as the one minute chart.
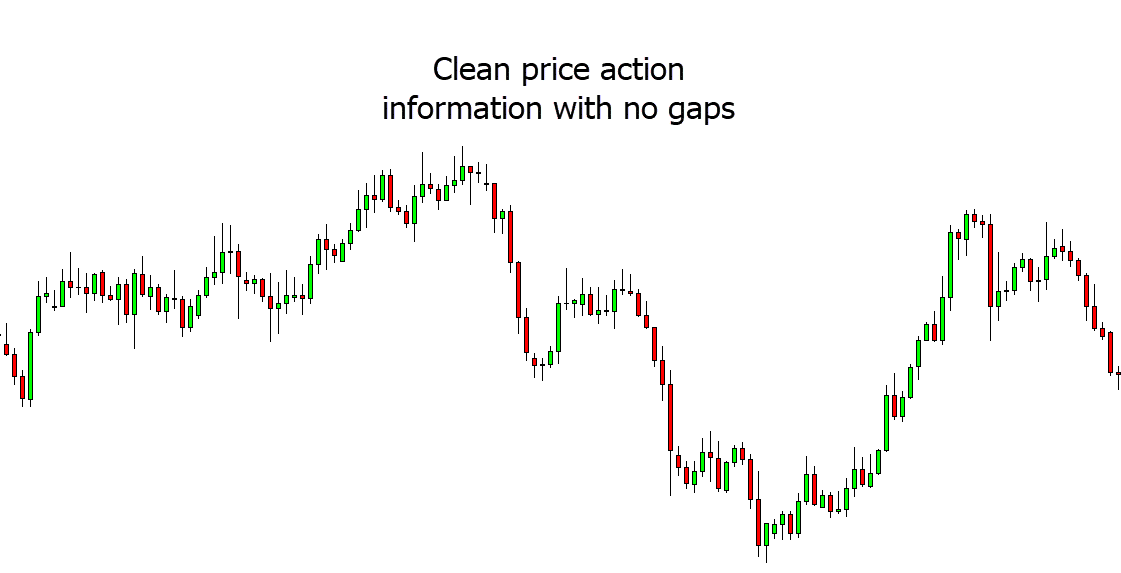
Like the example chart below shows, the 4 hour chart gives you a clear price action picture that allows you to find and make high probability winning trades.
The Best H4 Chart Trading Strategy
Whilst there are many trading strategies you can use to make trades on the 4 hour time frame from using indicators and technical analysis, in this post we concentrate on how you can use raw price action to make high probability trades.
Using raw price action will allow you to find and make high quality trades that repeat over and over again. Also, once you have perfected these strategies on the 4 hour chart, you can use them on other time frames.
Trading High Probability Reversals
This is one of the simplest trade setups you can use on your 4 hour charts and you can also use it in different scenarios.
You can look for reversals within the trend, against the trend or like in the example below when a clear range has formed.
The key when making reversal trades is that you are looking to trade away from a key support or resistance level.
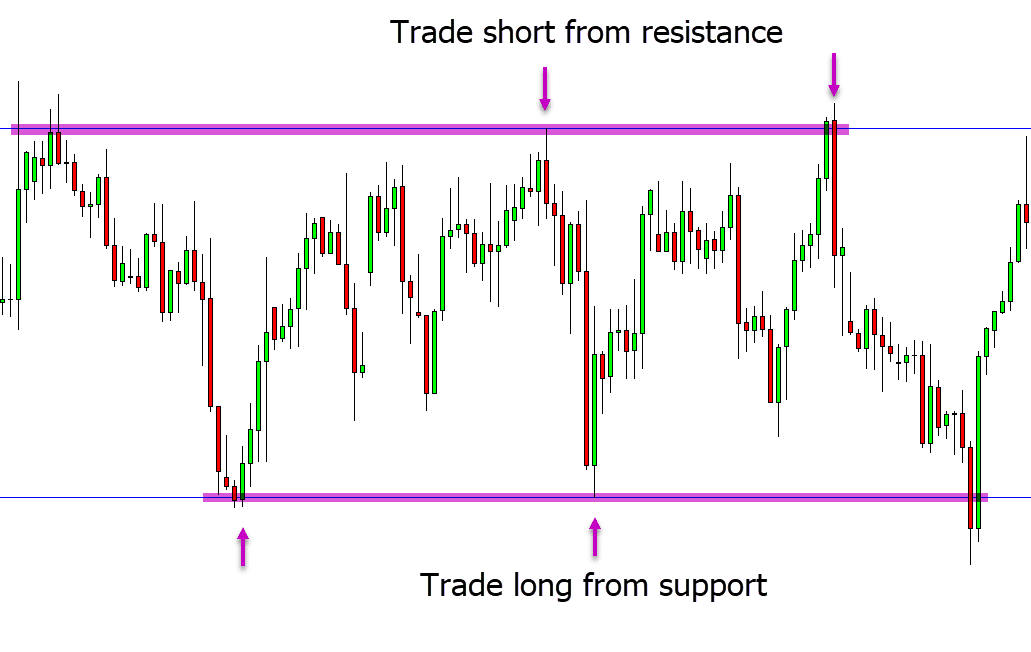
For example see the chart below; price is in a clear range. We can also see that price has been respecting the range high (resistance) and low (support) levels. Whilst these levels continue to hold we can look to trade long reversal trades from the support and short reversal trades from the resistance.
To further increase our trades odds we can add Japanese candlesticks at these areas. For example; when price moves into the resistance area we could then be looking for a reversal candlestick to form to confirm that price is looking to reject the resistance and make a new move back lower.
Trading Aggressive Breakouts
This is a riskier and more aggressive strategy, but it does come with higher rewards.
When price makes a breakout on the 4 hour time frame they can often be explosive and lead to very large reward winning trades. However, breakouts can also often turn into fake outs so it is important you use small stop loss levels and aim for higher reward winning trades to cover any losses and to remain profitable.
The key to making 4 hour chart breakout trades is to find a major area of support or resistance that price has respected on multiple occasions.
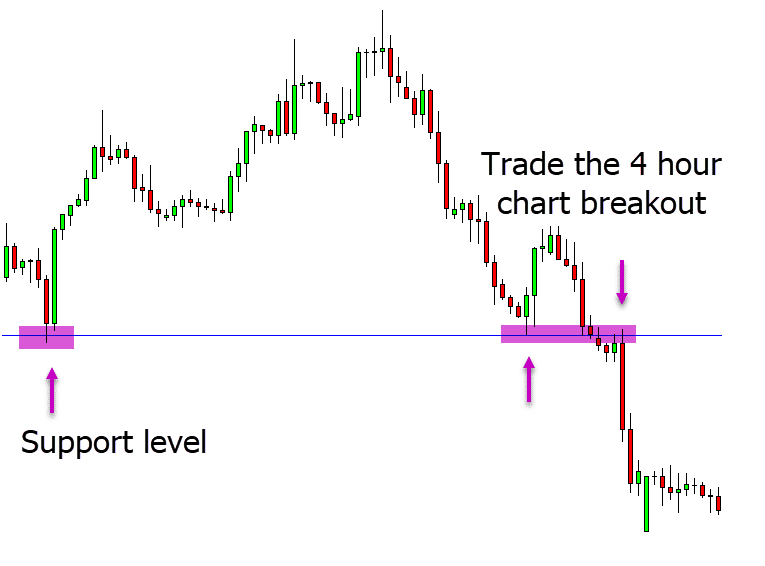
For example, see the chart below. Price had been respecting the obvious support level on multiple occasions.
When price is looking to make a breakout lower and through this support level we could have a sell stop order ready to activate so we are entered into the trade automatically as price breaks lower.
Lastly on Using H4 Trading Strategies
There are many different strategies you can use to make high probability and profitable trades on the 4 hour charts.
The 4 hour charts are the perfect chart for both new and advanced trades. They allow for swing trading and also breakout and momentum trading.
Make sure that whatever new strategy you are looking to test for the first time you do it on free demo charts risking no real money. You should never risk real money in a live trading account until you know that the strategy or system you are using works and can consistently make you profits.


