Incorporating the use of multiple time frames into technical analysis and price action trading can be a powerful tool for traders. This strategy allows traders to better determine when to enter and exit trades, and where to place a stop loss.
With multiple time frame trading, traders can gain an advantageous viewpoint from which to interpret market movement, providing them with more insight into the market’s direction.
NOTE: Download your multiple time frame strategy free PDF guide below.
Table of Contents
What is Multiple Time Frame Trading?
When multiple time frame trading, you are using more than one time frame to analyze an asset’s price. For example, if trading the EURUSD, you may be looking at the daily chart, the 4 hour chart, and also the 30 minute chart.
You would use multiple time frames to analyze a trade because it can give you an excellent idea of what price is doing overall. Each time frame has its own trends and movements.
The higher the time frame, the stronger the price action and signals area. However, also the slower price is moving. The shorter the time frame, the more noise and false moves you will encounter.
If you can combine multiple time frames, then you can start to gain a very clear picture of exactly what the price action is doing.
Trading Methodology
The methodology behind using multiple time frames is that you can start to build a clearer picture of the price action and technical analysis story.
For example, you may find that the higher time frames, such as the daily chart, are trending higher, so you begin looking for long trades. Whilst you could stay on the daily time frame to make your trade, your entry will not be ideal, and your stop loss will be wide.
You could use the information you have from the daily chart and start to move lower through the time frames. You could use a smaller time frame such as the 30 minute chart to find the ideal long trade entry that gives you a tight stop loss and a much bigger potential risk to reward ratio.
Confluence
The main reason that so many traders use multiple time frames in their trading is because it gives their trades a level of confluence.
When trading with one time frame only, that is all the information you have. When using multiple time frames, you start to build a really clear picture of the overall price action story.
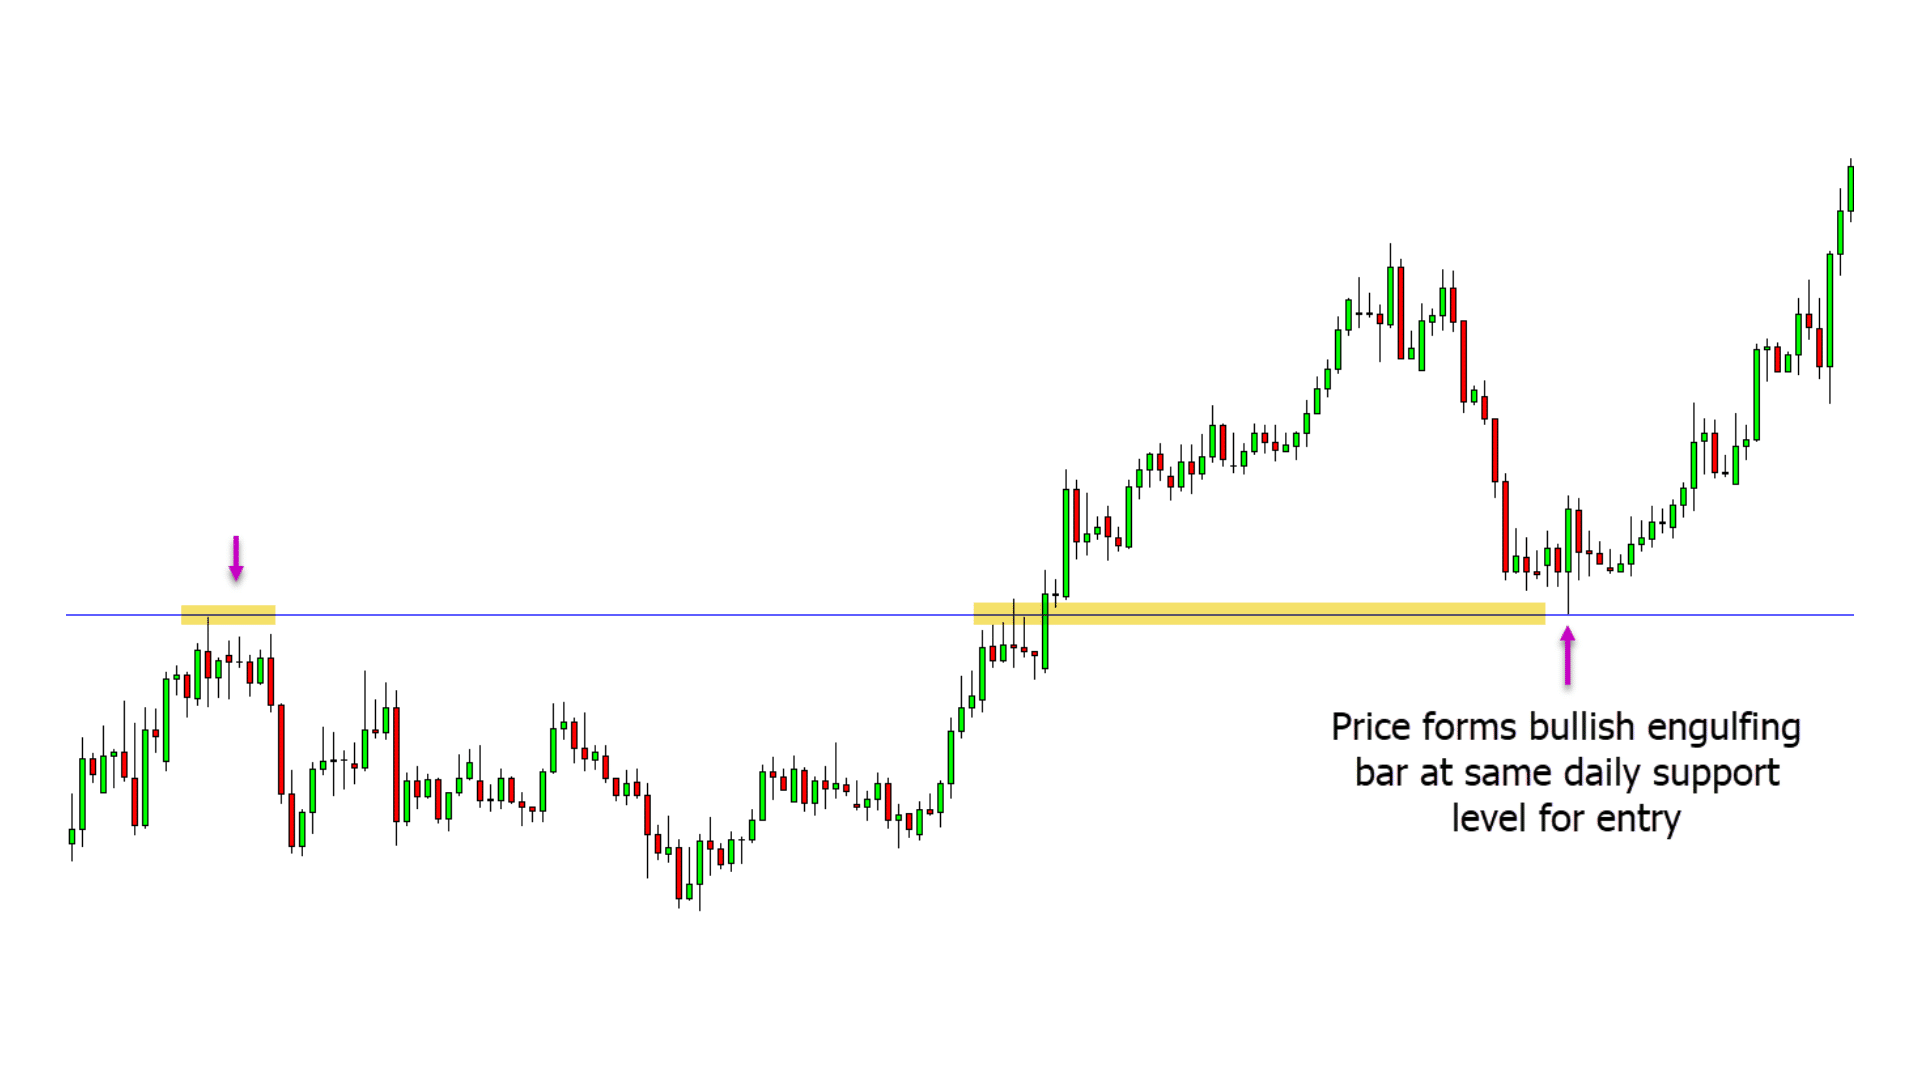
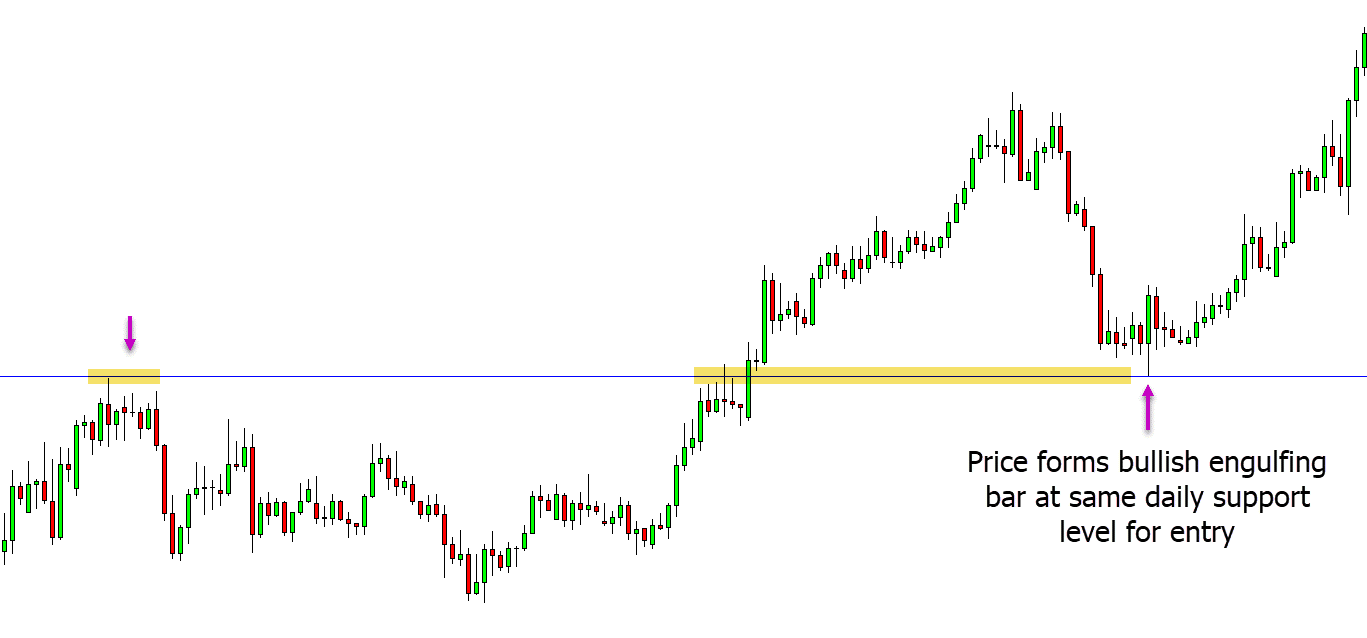
In the example below, we can see that the daily chart price is in a trend higher. We can also see that price has pulled back lower into an important support level.
The second chart below shows the same pair; however, this is the 1 hour time frame. We could use this smaller time frame to look for a better entry signal to go long that would give us a tighter stop loss. In this example, the price has formed a bullish engulfing bar at the daily support level inline with the daily chart trend.
Trading 3 Time Frames
Most traders when analyzing their trades over multiple time frames will use three time frames.
The reason for this is because you normally want a higher time frame, such as the daily or weekly time frame that shows you the overall price action picture. You then want an intraday time frame such as the 4 hour or 1 hour time frame that shows you what has been happening on the intraday charts. And lastly, you want a smaller time frame that will help you find the best trade entries. These time frames are normally smaller time frames like the 30 minute and 15 minute time frames.
The higher time frame, such as the daily chart, will show you a clear picture if the price is in a trend or ranging and will have fewer false signals. As you start to move to lower time frames, there will be more noise on your charts and many more false signals.
If you can combine the higher time frames with the lower time frames, you can start to get a really good idea of where the market is looking to head next. You can also start to make tight entries.
Indicators
One of the letdowns of most trading platforms is that they do not allow for indicators to be easily used across multiple platforms. For example, if you want to see what a moving average is doing on the 1 hour chart, then you have to move to the 1 hour chart.
When multiple time frame trading, it can be convenient to see what is going on with other time frames without moving to them. For example, if analyzing a Forex pair on the daily chart, it can be convenient to know what a certain moving average is doing on the 1 hour chart without moving off the daily chart.
Whilst it is not built directly into their charts, MetaTrader allows you to install and use some free custom indicators that will let you do exactly this. Some of the popular ones are moving averages, RSI, and stochastic that can all be used when multiple time frame trading.
You can checkout some popular multiple time frame trading indicators here.
Strategy
One of the best strategies when multiple time frame trading is to trade with the higher time frame momentum and use the smaller time frames to pinpoint your entries.
As an example, there are three charts of the same Forex pair below, the daily, 4 hour, and 30 minute chart.
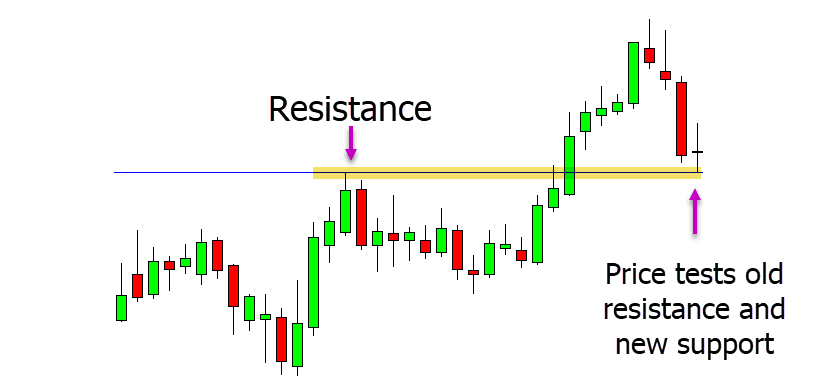
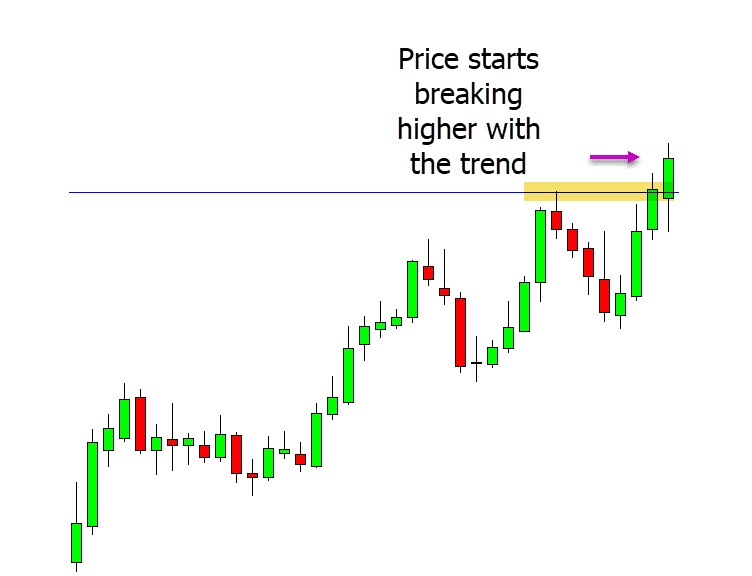
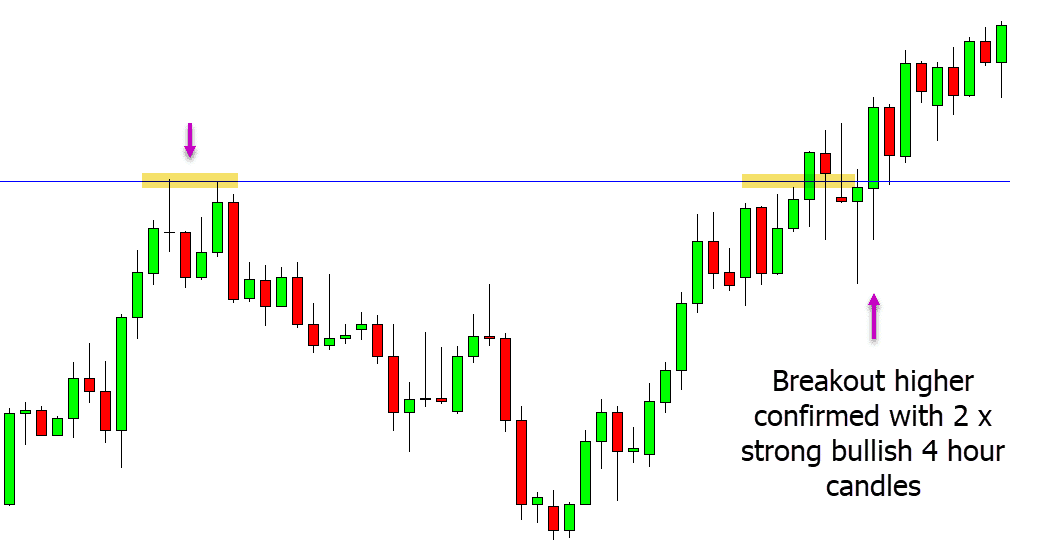
In the first daily chart, we can see the price starting to break higher with the trend and through an important resistance level.
On the second chart that is the 4 hour time frame, we can see that price has confirmed this breakout with two large bullish candles. This lets us know that we should be looking for long trades with this new momentum.
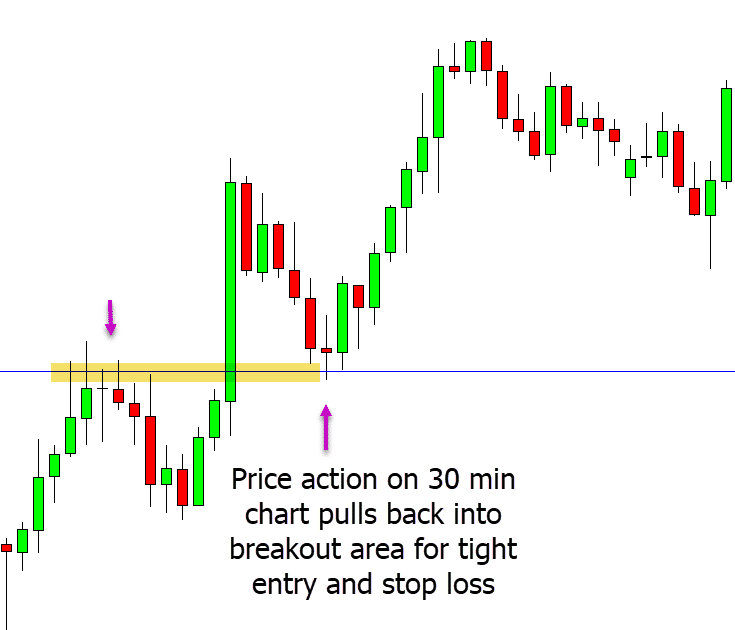
On the smaller 30 minute chart, we are now looking for our trade entry. This smaller time frame gives us a better entry with a smaller stop loss and a bigger potential risk to reward level.
When price pulls back into a clear support level, we can make a long entry and profit from the next move higher that is in line with the higher time frames trends.
NOTE: Download your multiple time frame strategy free PDF guide below.
