The standard deviation indicator is a simple yet very effective indicator you can use in your trading.
The standard deviation indicator or “StdDev / SD” shows you the volatility in a particular market and whether higher volatility is likely in the coming sessions.
When you combine the standard deviation indicator with your other technical analysis and trading indicators, you can start to find and make some very high probability trades.
This post goes through exactly what the standard deviation indicator is and how you can start using it in your trading in your Metatrader charts.
NOTE: Want a list of some of the very best free MT4 and MT5 indicators you can use in your trading – for FREE? You can get them below.
Table of Contents
What is the Standard Deviation Indicator
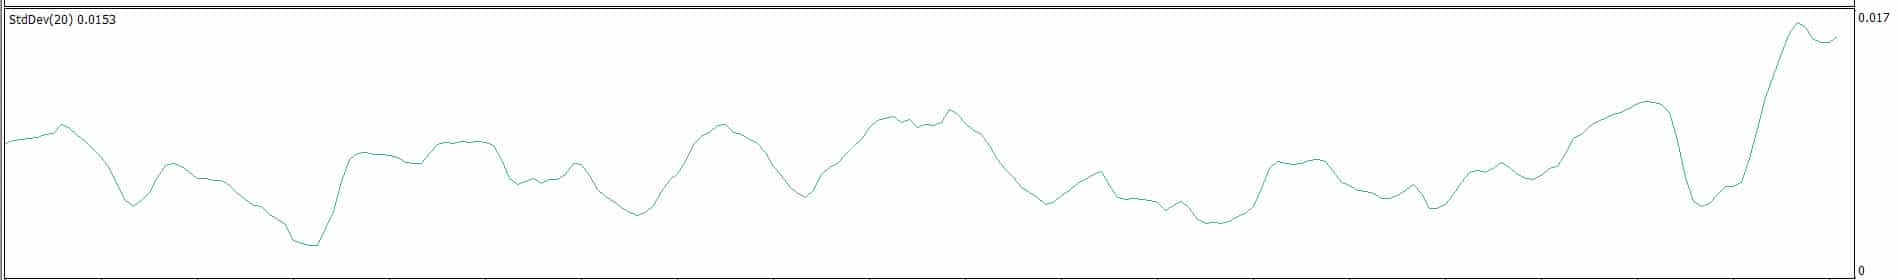
The standard deviation indicator is a handy indicator that you can quickly use to see the market volatility.
It shows you this by comparing the current volatility to what it usually is on average.
When this reading for the standard deviation starts to increase, you can see it as there being high current volatility. You could also expect this volatility to calm down in the coming sessions.
On the other hand, you could expect higher volatility levels in the coming sessions when the reading is very low.
As we are just about to discuss, you can use these readings to find when the market is looking to make a potential reversal, either higher or lower.
How to Use the Standard Deviation Indicator
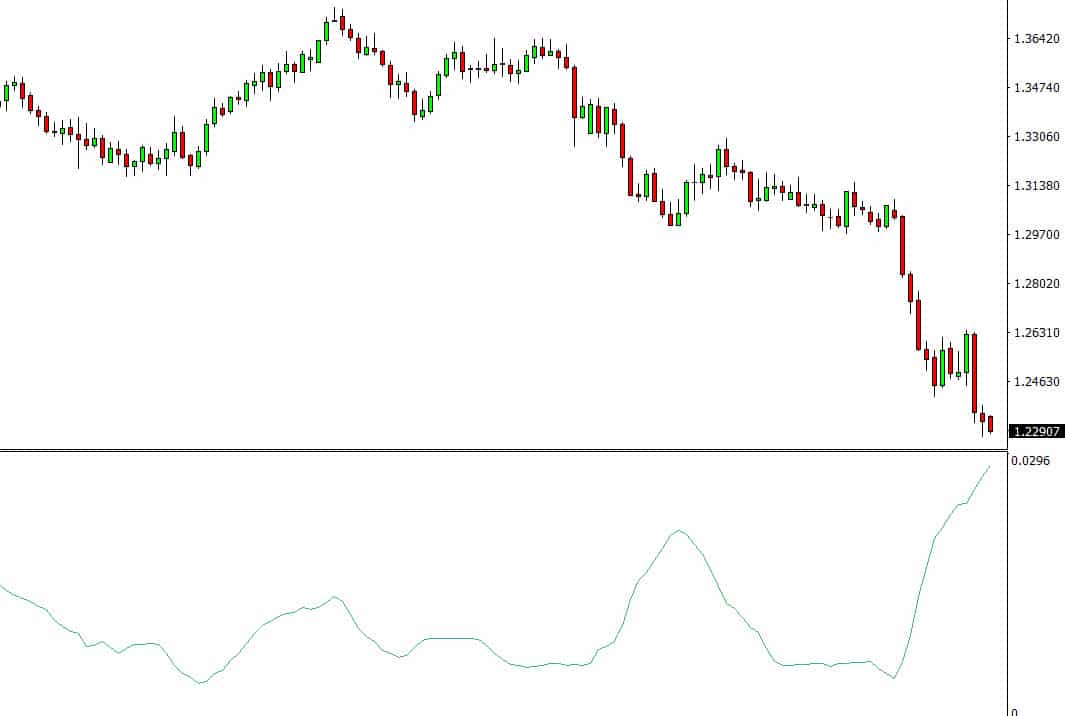
The standard deviation indicator is straightforward to use, and you can use it to find potential market reversals.
If the reading from the standard variation is high, the market is unstable, and you can look for lower amounts of activity in the coming sessions.
On the other hand, if the reading is relatively low, you can expect more volatility in the coming sessions.
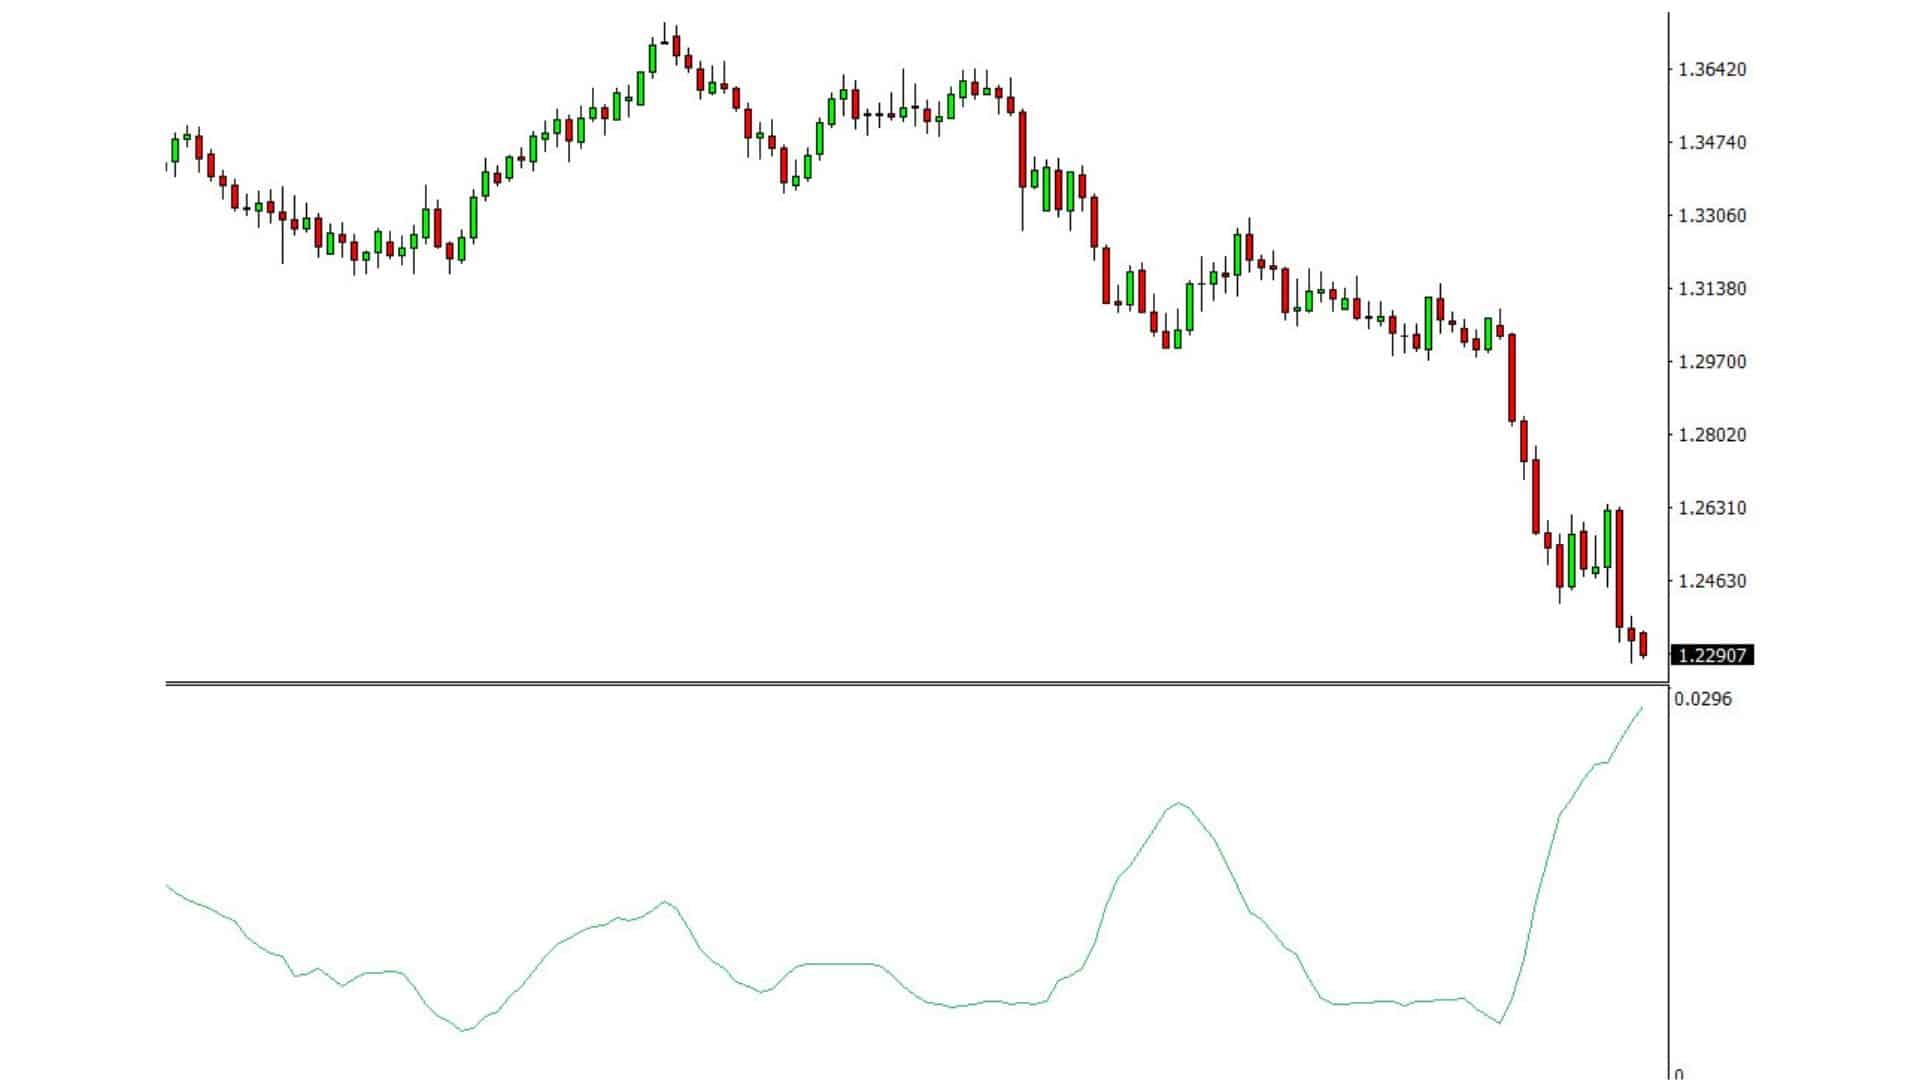
One way traders use this indicator is to identify when the market could be bottoming or topping.
If you see the price move into a swing high and the reading starts to move higher, you can read this as traders in that market are becoming nervous. You also then start to look for potential sell-offs and moves back lower.
On the flip side, when the price moves lower into a swing low and the amount of volatility increases, you could start looking for reversals higher. When you see a swing low that is accompanied by higher volatility, it is thought that the market is panic selling, and a rebound back higher could soon be on the cards.
Standard Deviation Indicators for MT4 and MT5
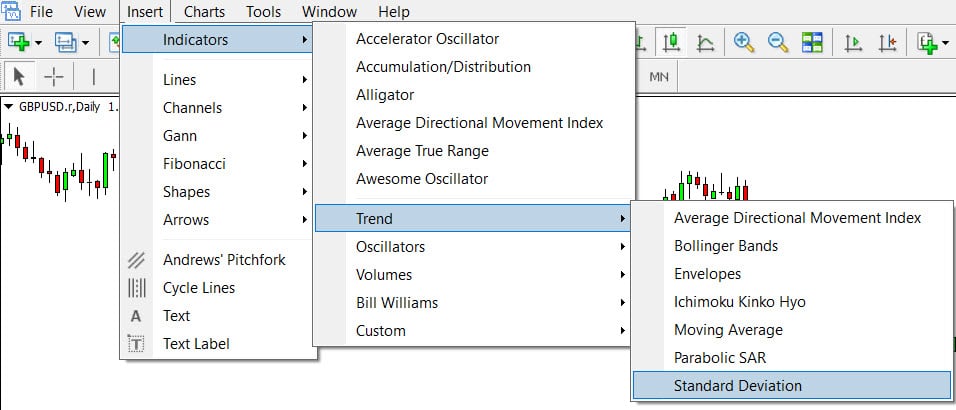
To start using the standard deviation indicator in your MT4 or MT5 charts, all you have to do is the following;
- Open your MetaTrader charts.
- Go to “Insert” >> “Indicators” >> “Trend” and finally select “Standard deviation.
- A box with the standard deviation indicator settings will pop up.
- In this box, you can customize your settings for the indicator, including changing colors and the periods you want to use.
- Select “Ok,” and the indicator will be added to your selected chart.
See the chart example below of how to add this indicator to your charts.
Note: Don’t know how to install and use these indicators? Read How to Download, Install and Use MT4 and MT5 Indicators.
Lastly
The standard deviation indicator is quite a straightforward indicator that can quickly help you identify a spike in volatility and when the volatility levels may be about to change.
The best way to use this indicator is to combine it with your other favorite trading strategies and indicators. An example could be using your technical analysis and price action strategies to confirm when a price reversal will occur, taking the volatility information into account.
As with any new trading strategy or indicator, make sure you practice using this indicator on free demo or virtual money charts before you ever risk any real money.
