USDCAD Trade Analysis
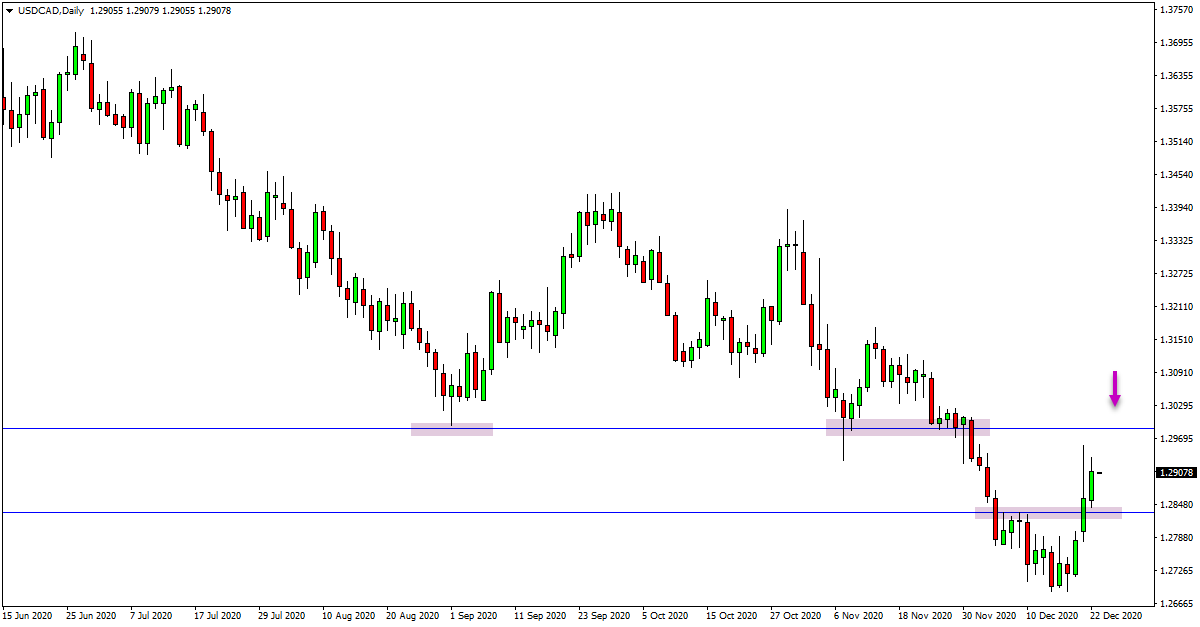
Current Trend: Downtrend.
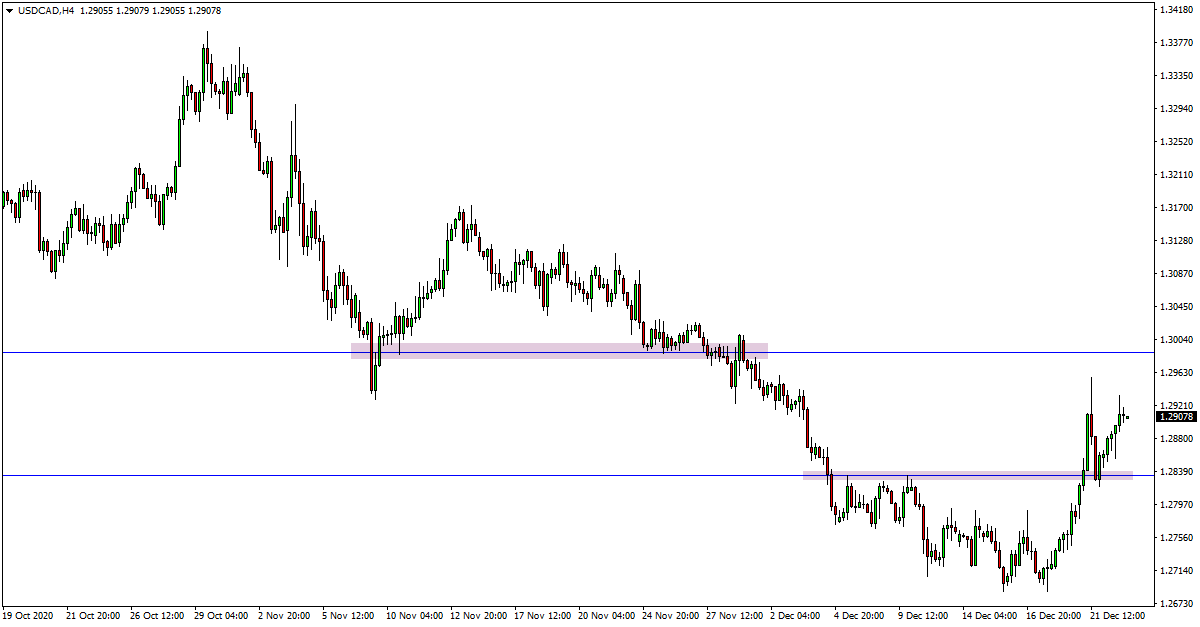
Support Levels: 1.2834.
Resistance Levels: 1.2988.
USDCAD Daily Chart

USDCAD Trade Ideas
For the majority of this year price action on this pair has been in a strong trend lower.
If you zoom your own daily chart out you will see that trading has been moving all one way. Whilst we have seen many regular pullbacks higher (as we see with all trends), price has continued to go on making new lower lows.
Whilst this trend continues to hold we can continue to look for new short trades.
Price in the last few sessions has rotated back higher and could be now forming one of these pullbacks within the trend.
Just overhead is a major resistance level and if we can see price form some bearish price action at this level it could be a high quality level to get short with the trend lower.
USDCAD 4 Hour Chart
CADJPY Trade Analysis
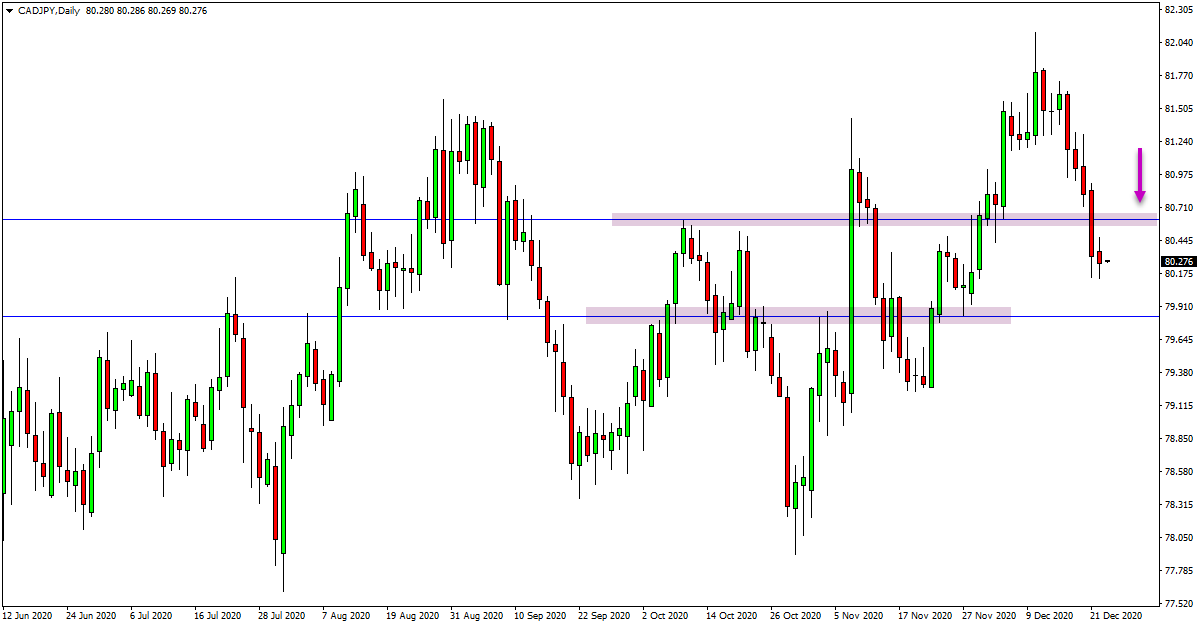
Current Trend: Sideways.
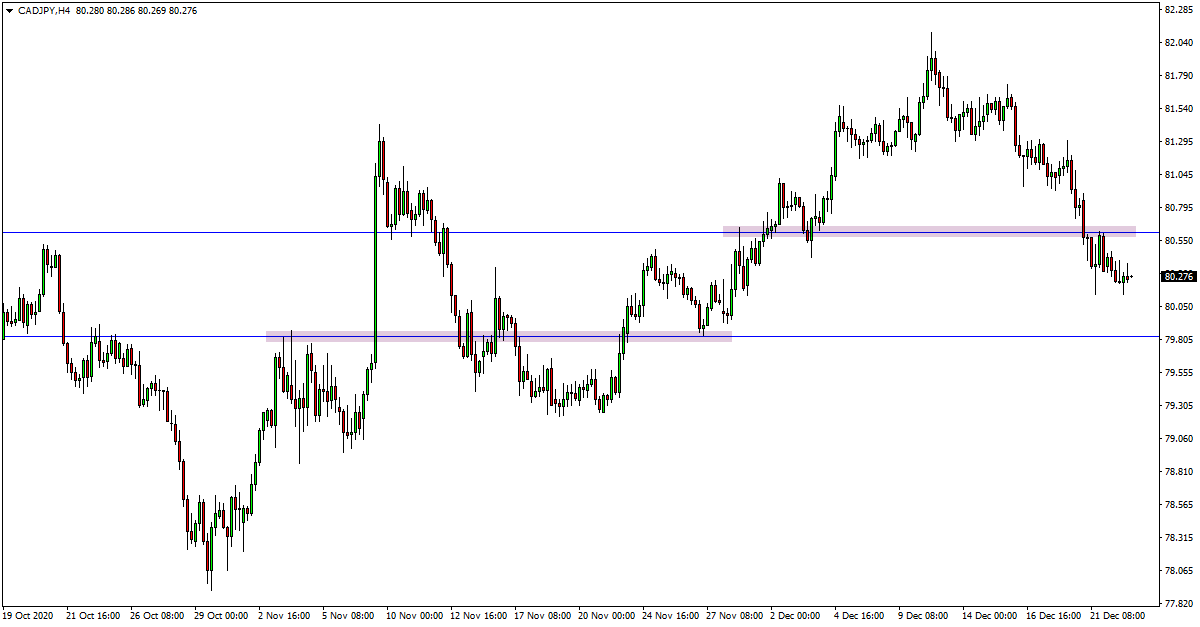
Support Levels: 79.83.
Resistance Levels: 80.61.
CADJPY Daily Chart
CADJPY Trade Ideas
Price on this pair has now moved lower and broken below a daily chart role reversal level.
Because this market has been very sideways and moving in ranges for the previous few months without a clear trend we can look to trade both sides of the market.
The best play could now be looking to trade with the very short term momentum lower.
If price can now pop higher back into this role reversal resistance level it could be a high quality level to start looking for intraday short trades.
Short trades could be looked for on the 4 hour time frame and below.
CADJPY 4 Hour Chart


