USDCAD Trade Analysis
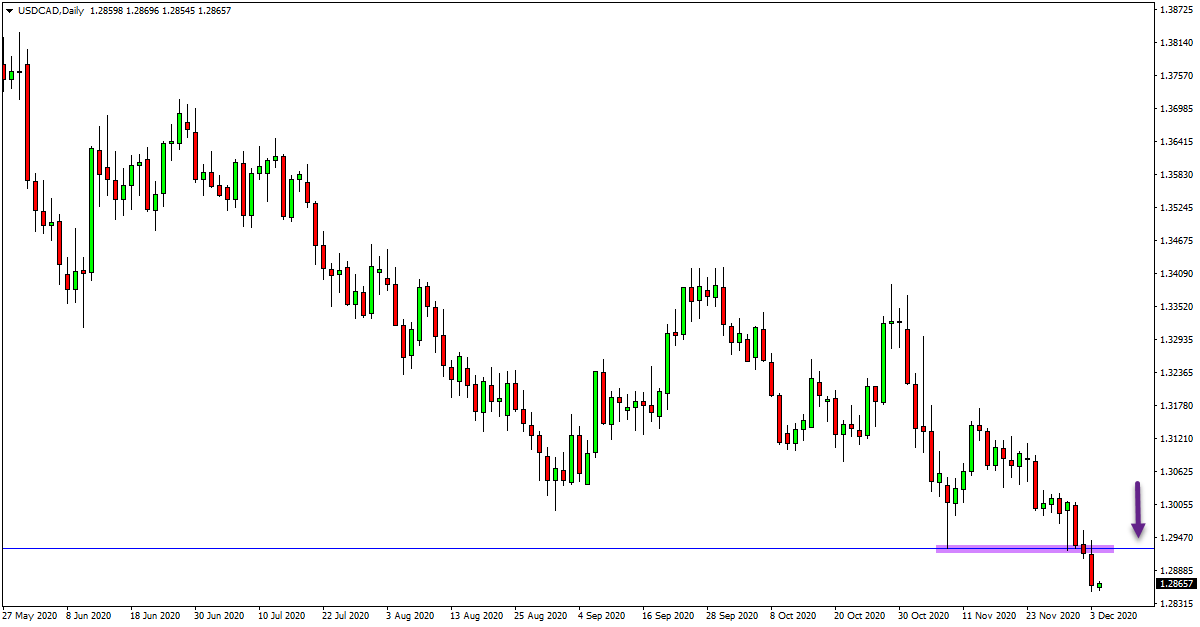
Current Trend: Downtrend.
Support Levels: 1.2829.
Resistance Levels: 1.2927.
USDCAD Daily Chart
USDCAD Trade Ideas
Price on the USDCAD has now broken lower and through the daily chart support level.
This level around 1.2927 looks a key level in the coming sessions and could be a quality level to keep an eye on.
If price rotates higher, this level could act as a role reversal and new resistance level. It could also be a high quality level to start looking for short trades.
Short trades at this level on either the daily or smaller intraday time frames would be inline with the recent strong momentum lower and at a key daily resistance level.
This is a key level to keep an eye on in the coming sessions.
USDCAD 4 Hour Chart
GOLD Trade Analysis
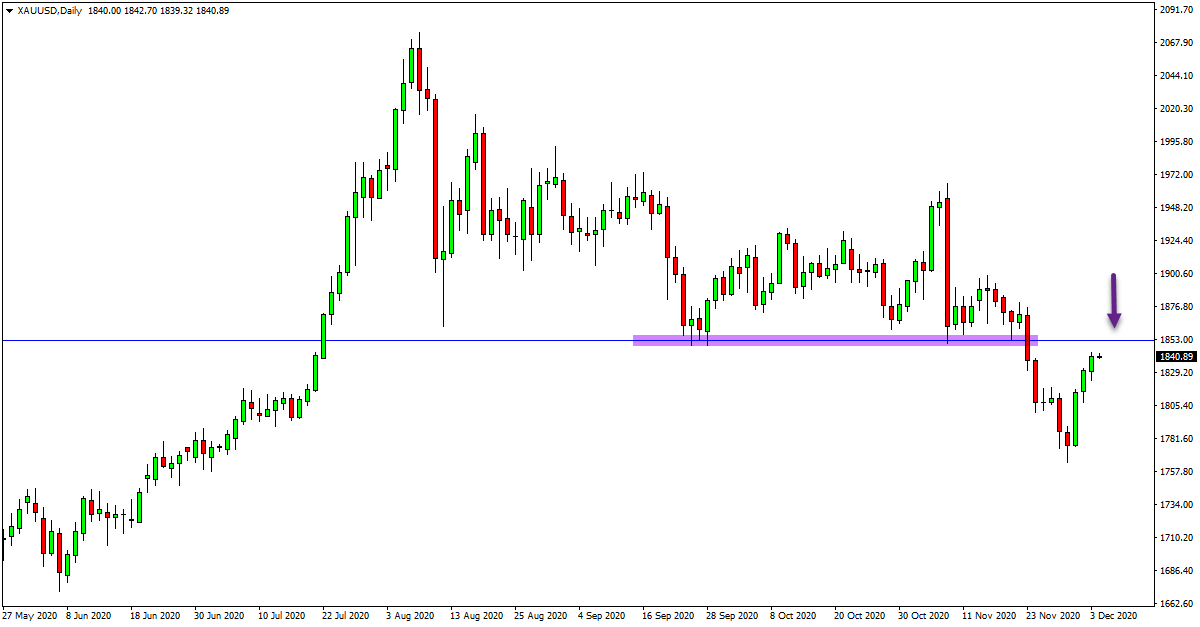
Current Trend: Downtrend.
Support Levels: 1765.64.
Resistance Levels: 1852.08.
GOLD Daily Chart
GOLD Trade Ideas
After breaking lower and through the range support level that had been containing prices, Gold made a solid move lower.
As the attached daily and 4 hour charts show, price made an agressive sell off once this level was cleared.
Price is now in retrace mode and moving back higher and back into the same level it recently broke out of.
This level looks a quality level to keep an eye on for potential short trades in the coming sessions.
If we can see some rejection at this level, then we can start to look for short trades on the daily and smaller intraday time frames.
GOLD 4 Hour Chart


