USDJPY Trade Analysis
Current Trend: Downtrend.
Support Levels: 102.60.
Resistance Levels: 103.91.
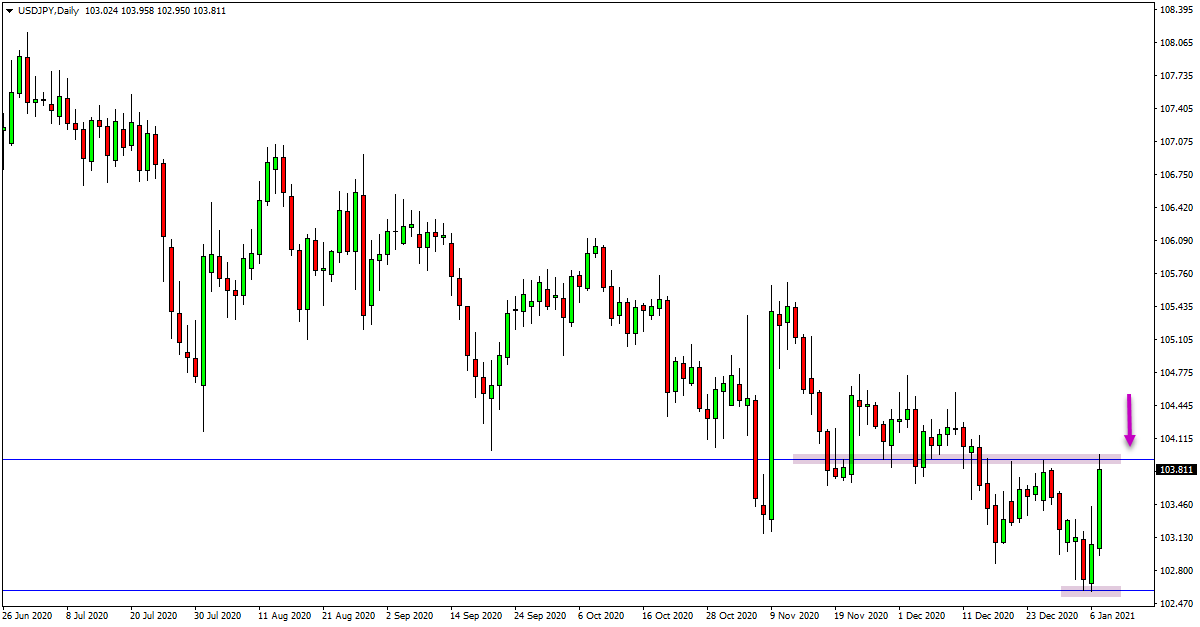
USDJPY Daily Chart
USDJPY Trade Ideas
Price action has been steadily trending lower on the USDJPY over the past few months.
As the attached daily chart shows, within this move lower we have been seeing a series of lower highs as price pulls back and then sells off back lower. Price has now formed another one of these pullbacks in the last two daily sessions and has moved back into a daily chart resistance.
This resistance around 103.91 now looks an important level for this pair and a level to watch for potential short trades.
If we can see some form of bearish rejection at this level we could start to look for new potential short trades on the daily and smaller intraday time frames.
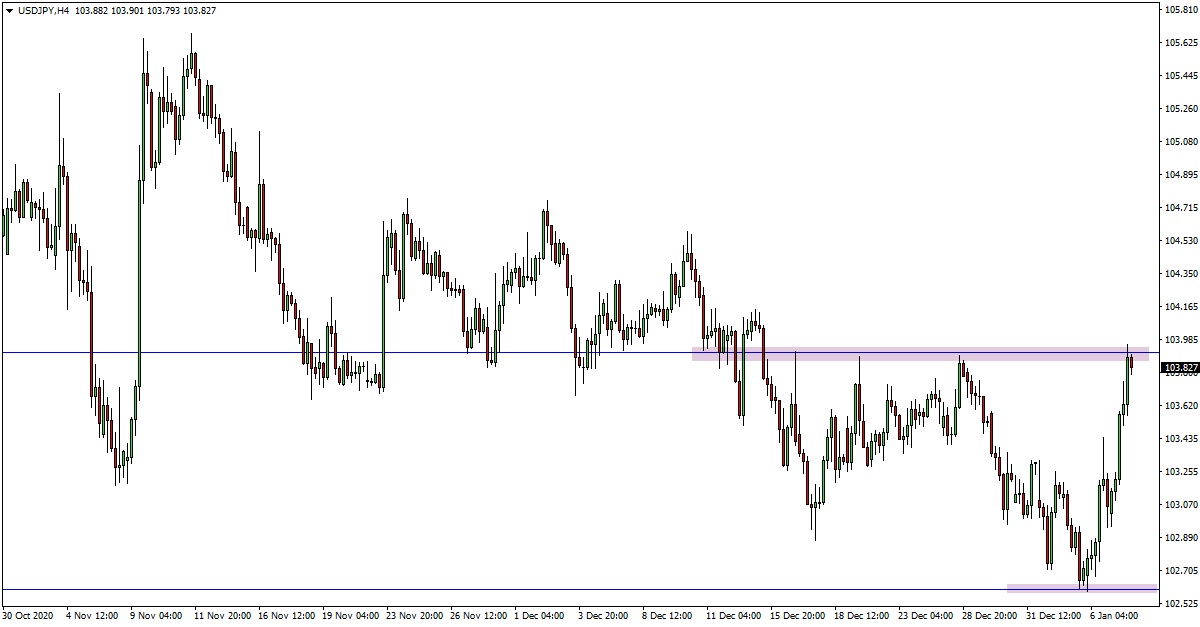
USDJPY 4 Hour Chart
AUDCHF Trade Analysis
Current Trend: Uptrend.
Support Levels: 0.6820.
Resistance Levels: 0.6877.
AUDCHF Daily Chart
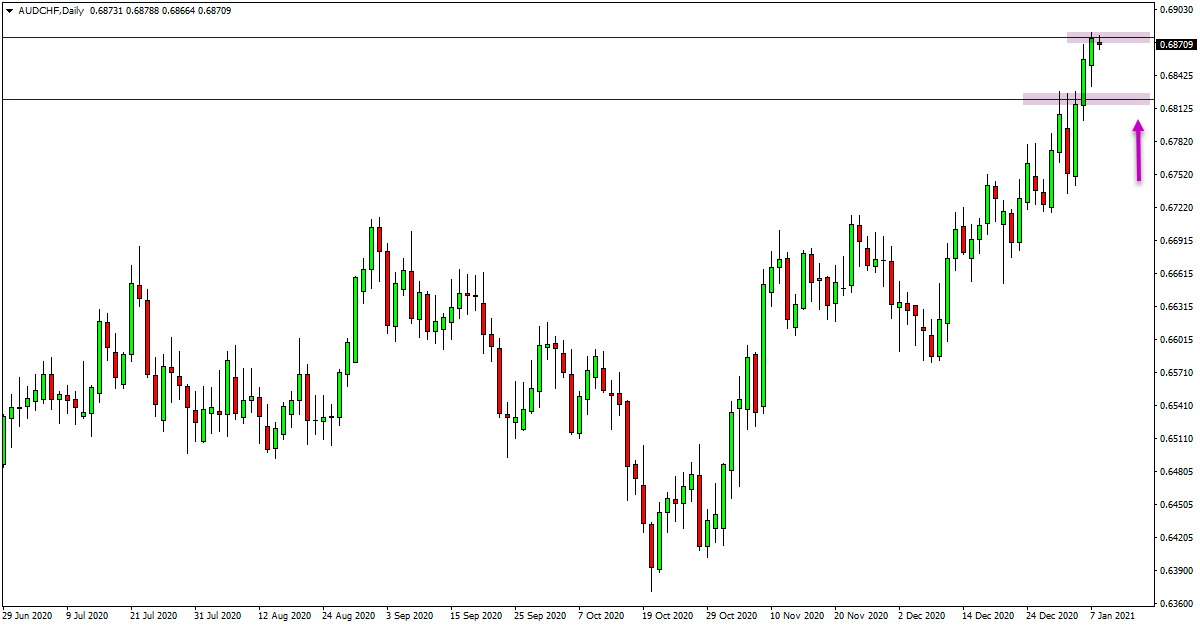
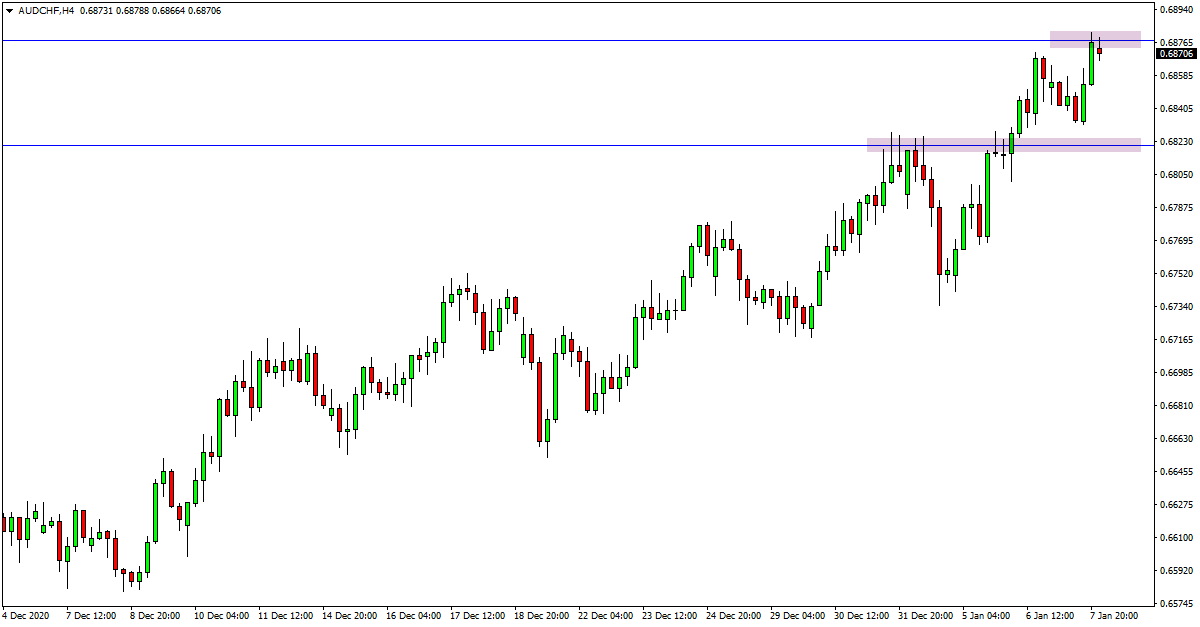
AUDCHF Trade Ideas
Price action on the AUDCHF has been in a strong trend higher since March of last year. Whilst there have been periods of sideways range movement, the trading overall has all been higher.
Until this momentum and trend changes, the best play looks to be finding trades inline with this trend higher.
Price has now run into a daily chart resistance level and we could see price pop lower. If we can see a quick retrace lower we could look for long trades from value areas.
The nearest support of interest comes in around 0.6820 which could be a quality level to start looking for new long trades.
AUDCHF 4 Hour Chart