USDSGD Trade Analysis
Current Trend: Downtrend.
Support Levels: 1.3160.
Resistance Levels: 1.3250.
USDSGD Daily Chart
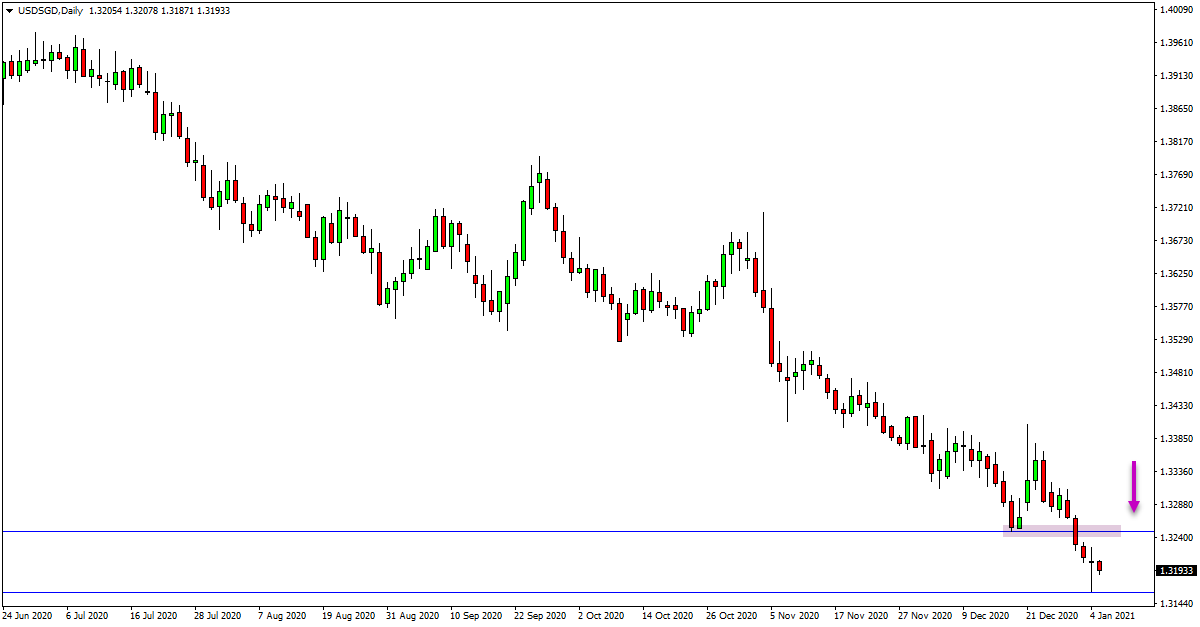
USDSGD Trade Ideas
Price on the USDSGD has now been trading in a strong trend lower for the past nine months.
As the attached daily chart shows, whilst price has been in a strong and consistent move lower, there have still been plenty of rotations higher and chances to enter short trades from value areas.
Price has now moved into a support level and formed a bullish reversal candlestick. If we can see price move back higher from this support we could start to look for new short trades inline with the trend lower.
Just overhead is a strong daily chart resistance around 1.3250 that could be a quality level to look for new short trades.
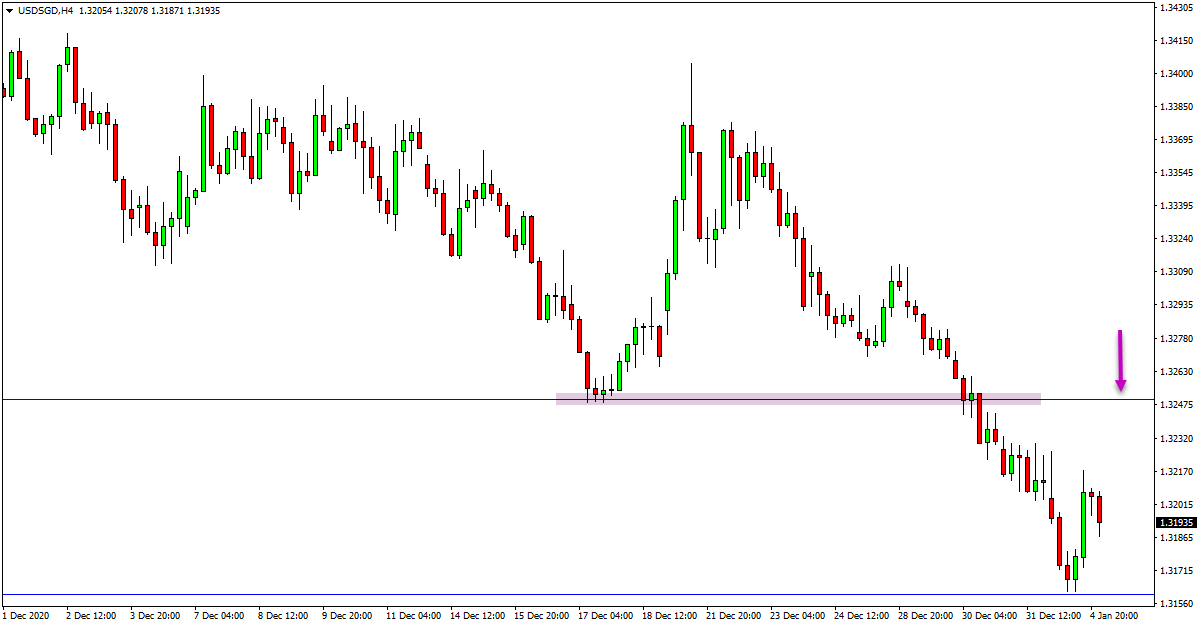
USDSGD 4 Hour Chart
GOLD Trade Analysis
Current Trend: Uptrend intraday charts.
Support Levels: 1906.84.
Resistance Levels: 1960.15.
GOLD Daily Chart
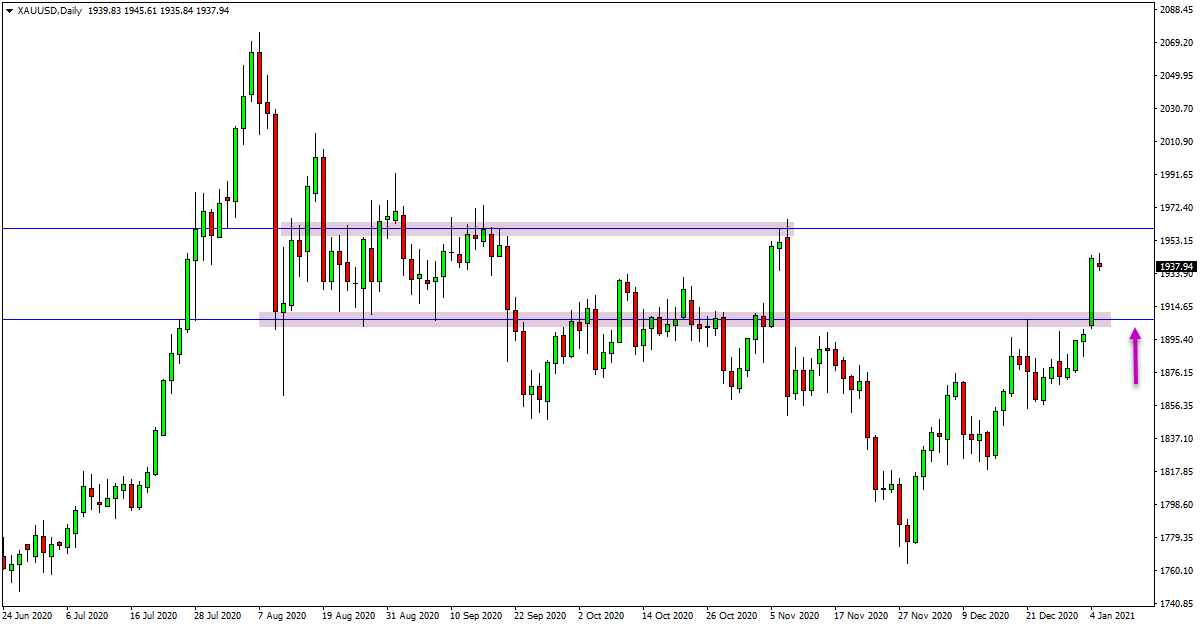
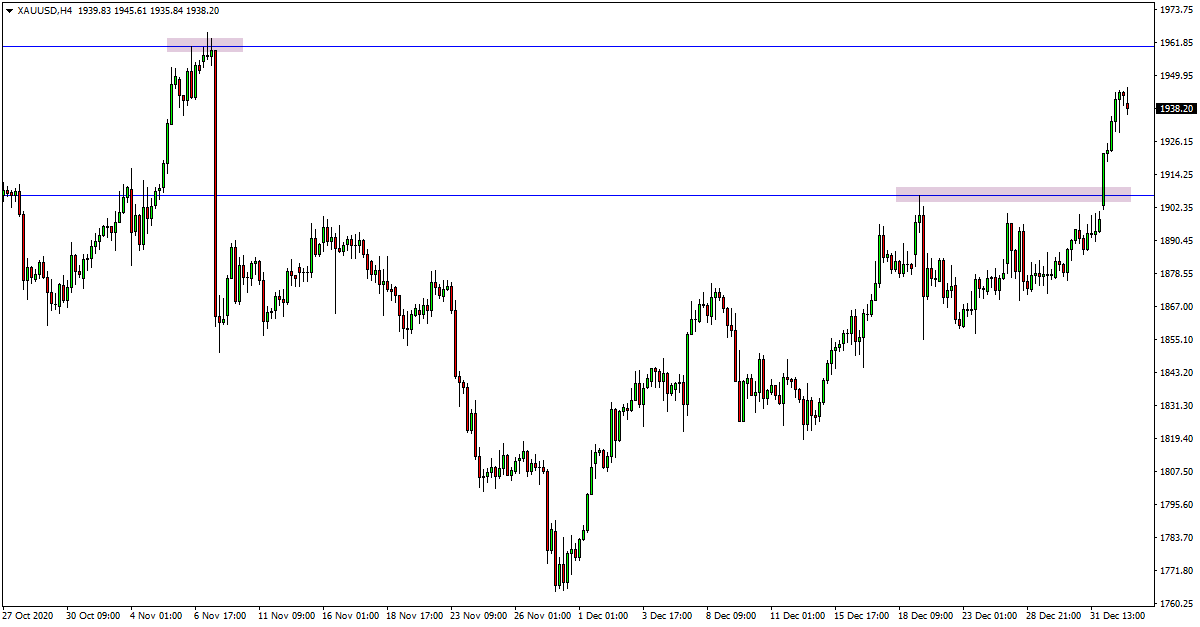
GOLD Trade Ideas
Price on the daily chart of this market has been sideways and range bound for months now.
However, on the intraday charts such as the 4 hour time frame and below price has broken higher and is looking to form a new trend.
As the attached 4 hour chart shows, in recent sessions this move higher has had some very strong momentum.
Looking to trade inline with this momentum could be the best play, looking for trades on the smaller intraday time frames.
If price can now make a sharp pullback lower into the old resistance and new role reversal support level we could look to get long.
GOLD 4 Hour Chart