Having an indicator that can help you predict future price trends can be extremely helpful. That is what the Vortex indicator was designed for.
This post goes through precisely what the Vortex indicator is, how to use it and how you can use it for free in your MT4 and MT5 charts.
NOTE: Want a full list of some of the best free MT4 and MT5 indicators you can use in your trading? You can get them below.
Table of Contents
What is the Vortex Indicator
Etienne Botes and Douglas Siepman created the Vortex indicator. They unveiled this indicator in the 2009 edition of Technical Analysis of Stocks & Commodities.
The idea of the Vortex indicator is that it can help you identify and find new price action trends. It does this by using the previous price data to develop its movement.
You can use the Vortex indicator on many different markets such as stocks, Forex, or commodities, and you can also use it on all of your additional time frames.
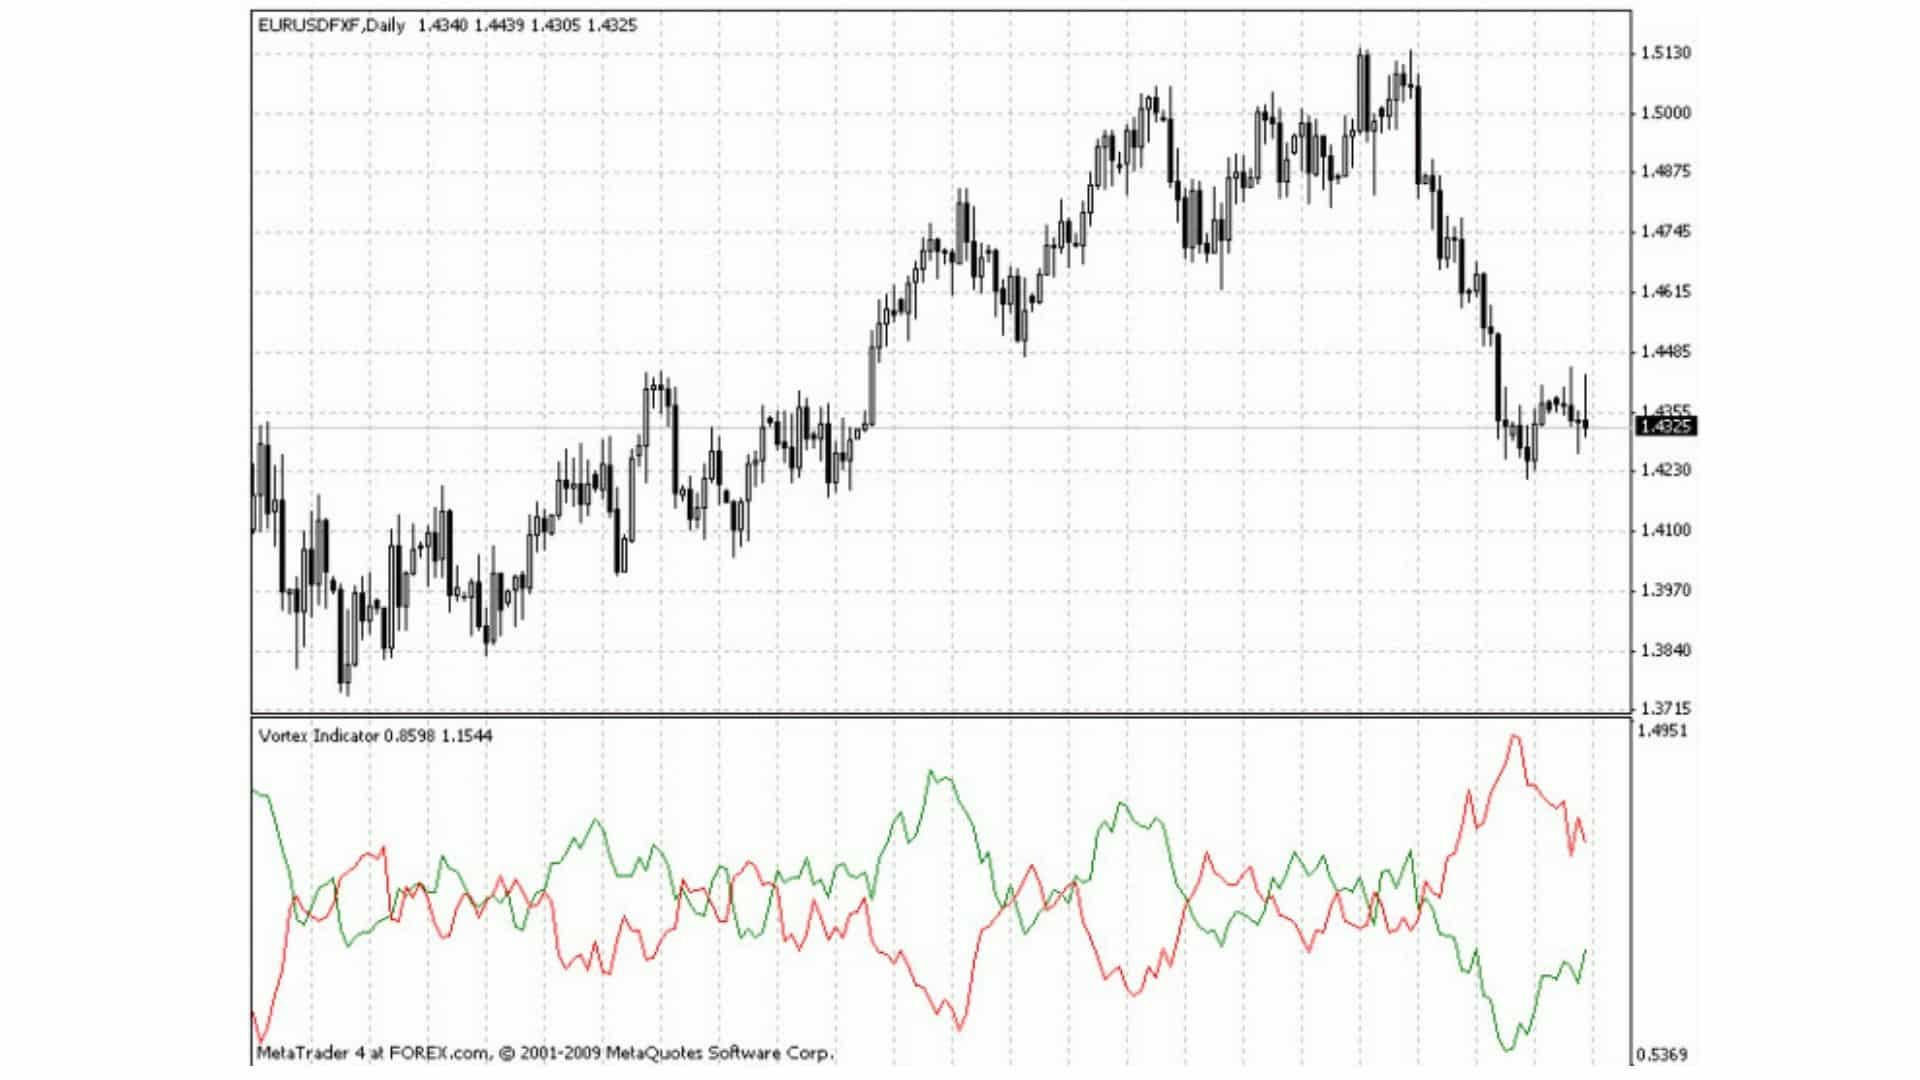
When you add the Vortex indicator to your chart, you will be given two intersecting lines. When these lines start to intersect, you will see that they create a Vortex shape. This movement will help you identify activity and trends both higher and lower.
How to Use a Vortex Indicator
The Vortex indicator is a simple indicator that is very easy to read and use.
The Vortex connects the highs of a candlestick with the low of the following candlestick. These are then plotted on your chart with two intersecting lines.
These lines can provide valuable information and help you identify higher and lower trends. When price begins to start trending more powerfully, you will see the two lines diverge and move away from each other. On the other hand, when the price is ranging or stagnant, you will see these two lines come closer together.
The easiest way to read this indicator is by concentrating on what the two lines are doing in relation to each other.
It is known as a positive Vortex when the positive Vortex line crosses above the negative Vortex line.
On the other hand, it is known as a bearish Vortex when the negative line crosses above the bullish Vortex line.
This indicator is based on the 2009 Technical Analysis of Stocks and Commodities issue, where the Vortex was first introduced.
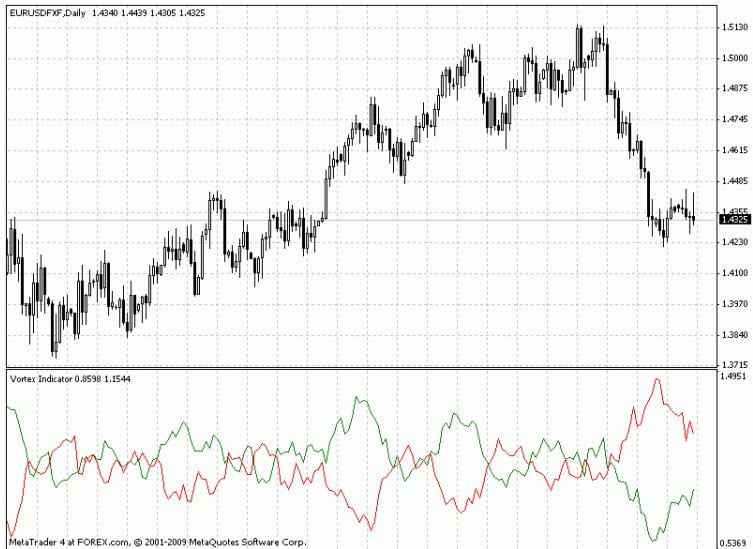
After you have downloaded and installed this indicator in your MT4 charts, you will see the two Vortex lines added at the bottom of the chart.
You can then use the information these two Vortex lines produce to help you find bullish and bearish movements.
Vortex Indicator for MT4 and MT5
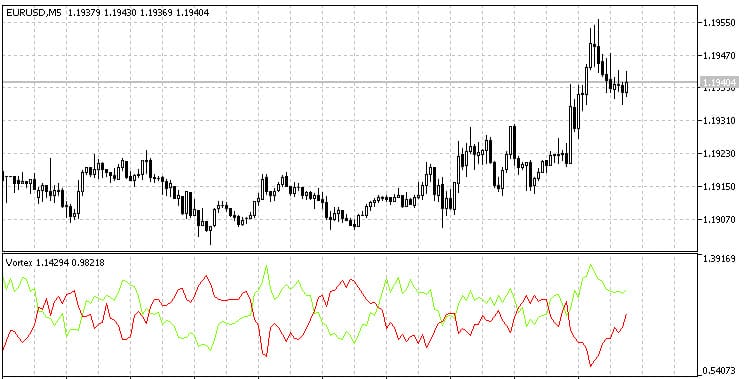
This is also a straightforward indicator and is similar to the MT4 version.
After you have downloaded and started using this Vortex indicator in your MT5 chart, you will be given two lines at the bottom of your charts.
You can then use the information these lines produce to make and manage your trades. You can also start to find new trends emerging both higher and lower.
When the bullish Vortex line moves above the bearish line, it is called a bullish Vortex.
Conversely, when the bearish line moves below the bullish line, it is known as a bearish Vorex.
Get your Vortex indicator for MT5 here.
Get your Vortex indicator for MT4 here.
Lastly
Identifying and trading bullish and bearish trends can be extremely handy in your trading.
The Vortex is designed to help you find these moves and profit from them.
Lastly, always make sure you use free demo accounts with virtual money when testing new systems or indicators before you ever risk real money.
