One of the best and easiest ways to increase your chances of making winning trades is to trade with the trend. The average directional movement index or ADX is an indicator that will not help you find a trend, but can show you how strong a trend is.
This is an extremely popular indicator because whilst there can be many trends, knowing how strong or weak a trend is can be a huge advantage.
In this post we look at exactly what the average directional movement index indicator is and how to use it in your trading.
NOTE: Download Your Free ADX Indicator PDF Below.
Table of Contents
What is the Average Directional Movement Index?
The average directional movement index was created by J. Welles Wilder in the 1970s.
The ADX combines two indicators to create a smoothed moving average that is then shown on your charts.
The two indicators are the positive directional indicator that is known as +DI and the negative directional indicator that is known as -DI.
Whilst you can use different periods of time to set this indicator, the default setting is 14 periods. You can use the ADX on all time frames and in many different markets including Forex, Stocks and Cryptocurrencies.
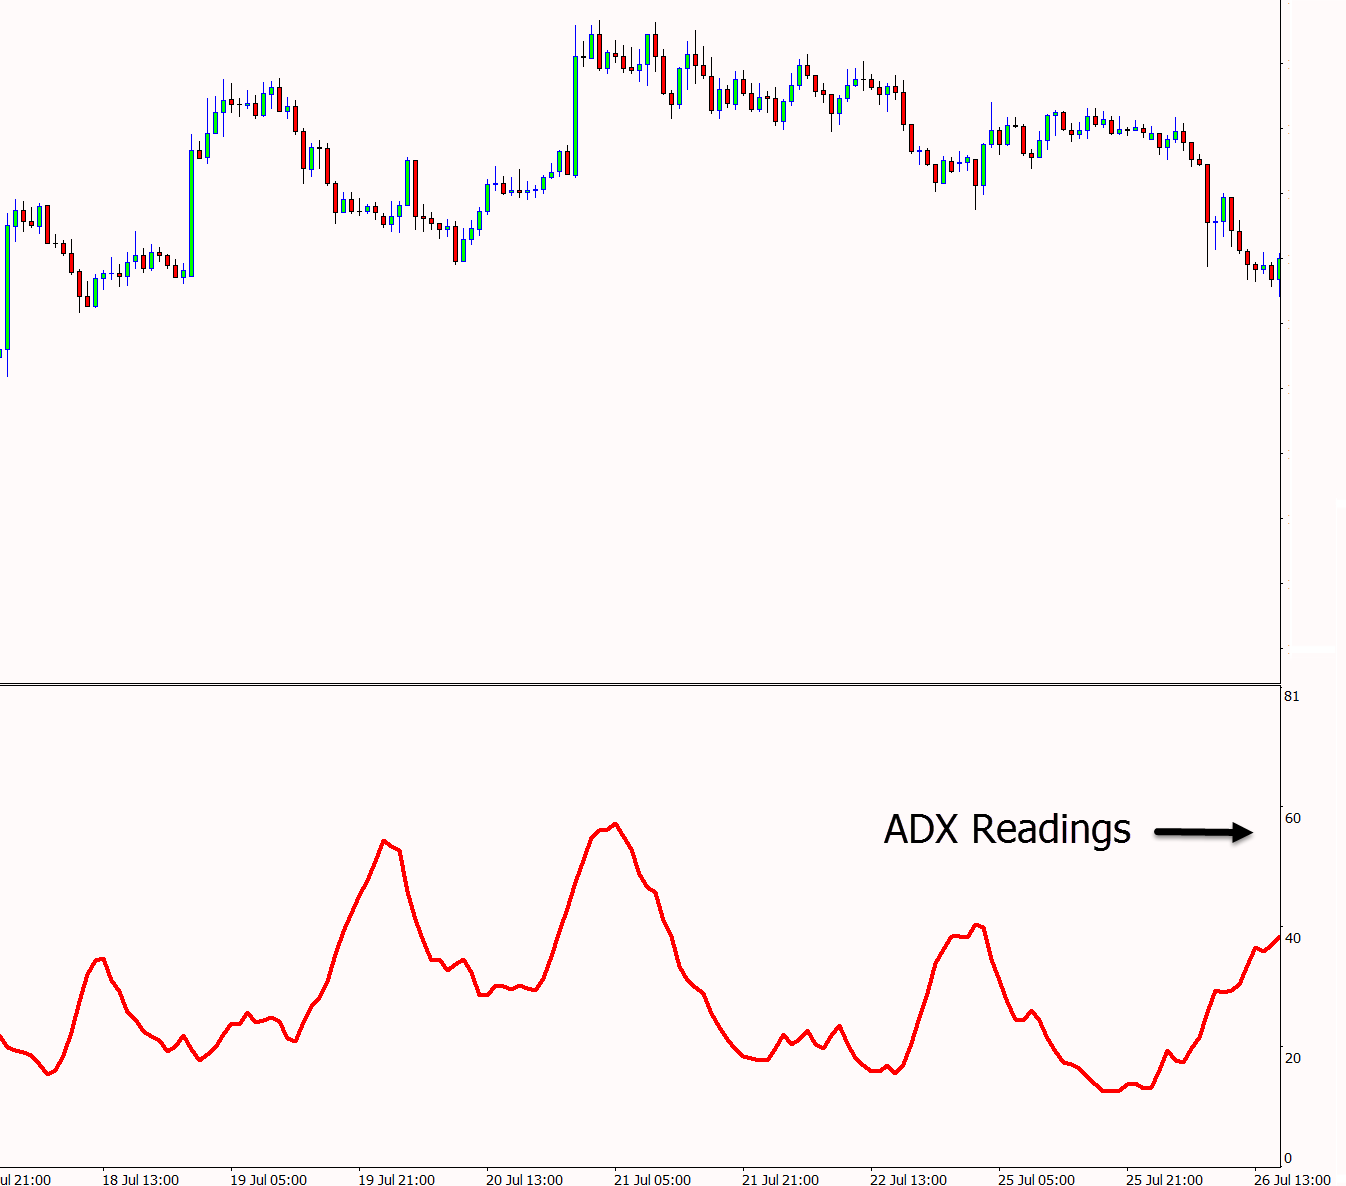
Once plotted on your chart you will be able to see one line that varies in between 0 to 100 along with the +DI and -DI lines. Using the basic readings that the ADX then shows you will be able to quickly see if price is in a strong trend or ranging.
The average directional movement index is designed to show you the strength of a trend and not when a new trend is beginning.
The ADX Indicator Formula
The ADX is derived from the +DI and -DI calculations to form it’s reading.
The default setting for the ADX is 14 time periods.
To calculate the average directional movement index the +DI and -DI need to be calculated.
These are calculated with the price history of the previous high, low and close for the previous 14 periods (if using the default settings of 14 periods).
The average directional movement index is designed to show you the strength of a trend and not when a new trend is beginning.
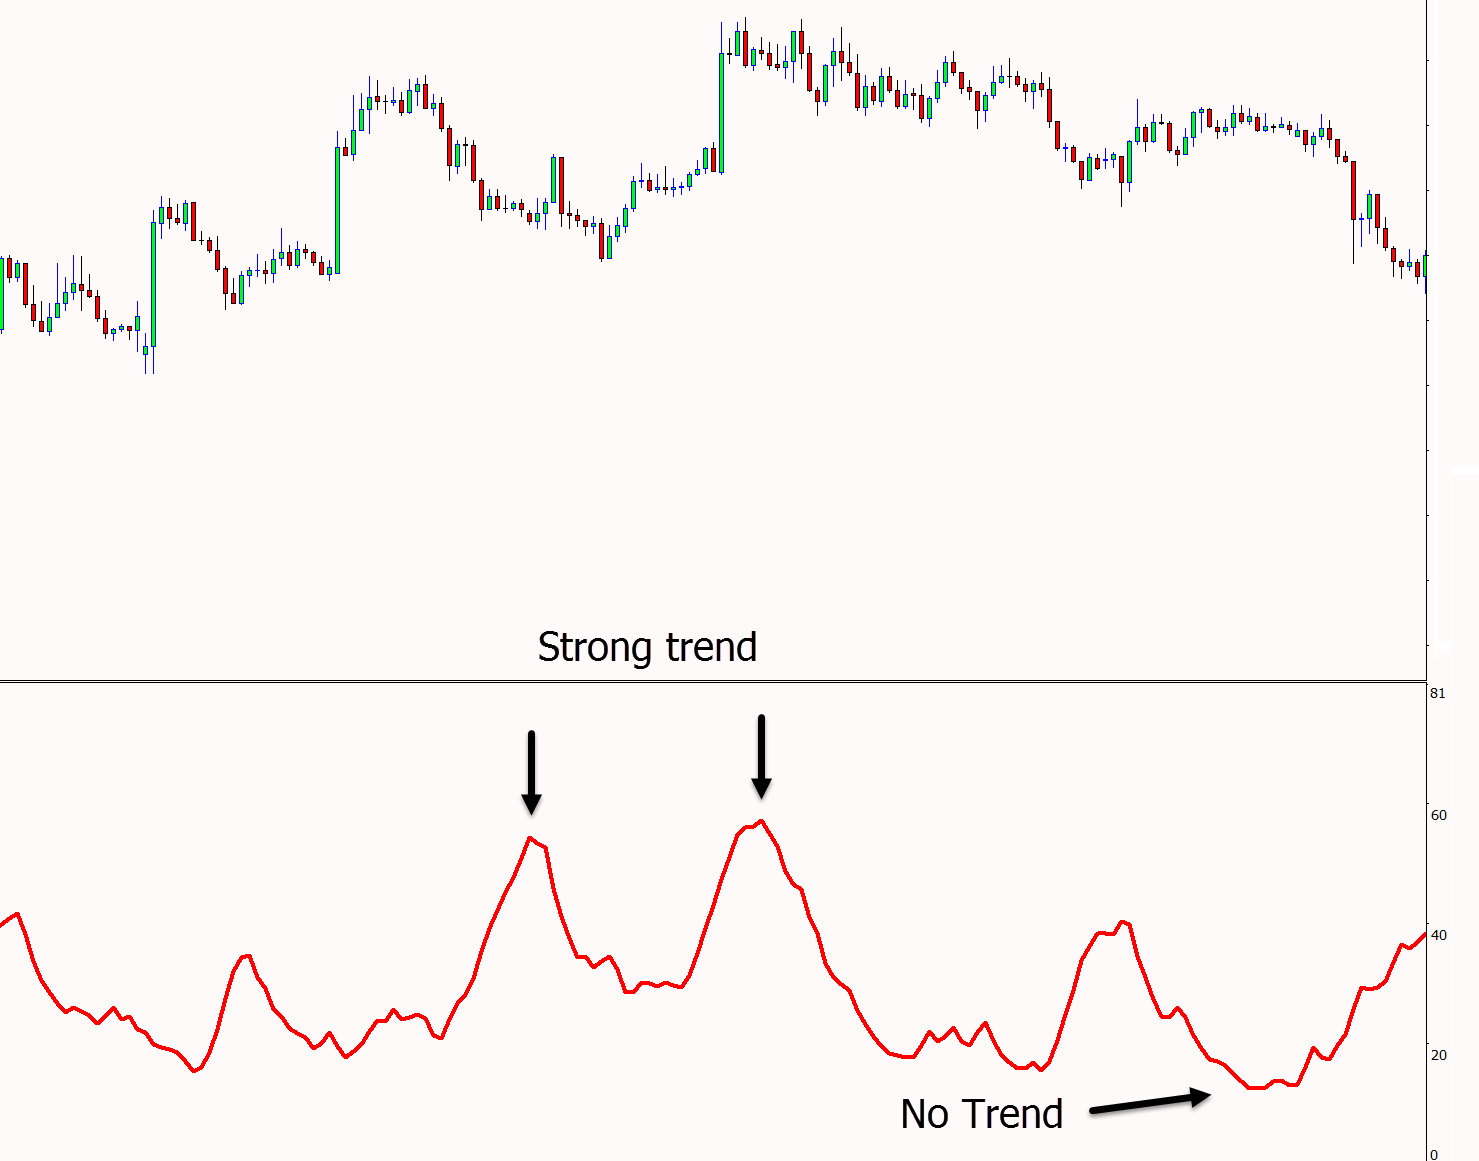
A reading of 25 or below is normally seen as price moving sideways or in a ranging market.
The higher the ADX reading moves above 25 the stronger the trend is thought to be.
Average Directional Movement Index Reading
- 0 – 25: Ranging or no trend
- 25 – 50: Trending
- 50 – 75: Strong Trend
- 75 – 100: Very Strong Trending Market
Using the ADX as a Trend Strength Indicator
One of the most useful aspects to the ADX indicator is that it quickly identifies on your chart the strength of the trend.
Without having to do any other in-depth technical analysis you can quickly see if price is in a strong trend or a range phase.
When you have the ADX plotted on your chart you will see one main reading that moves higher and lower. This visually shows you the peaks and troughs of the trends momentum.
When the average directional movement index is making a series of lower readings you can see that price has little momentum. This also indicates you may want to look for trades other than trend trades.
When you begin seeing larger readings over 25 you can quickly identify that price is in a trend. When readings begin moving higher it shows a stronger moving trend.
Average Directional Movement Index Trading Strategy
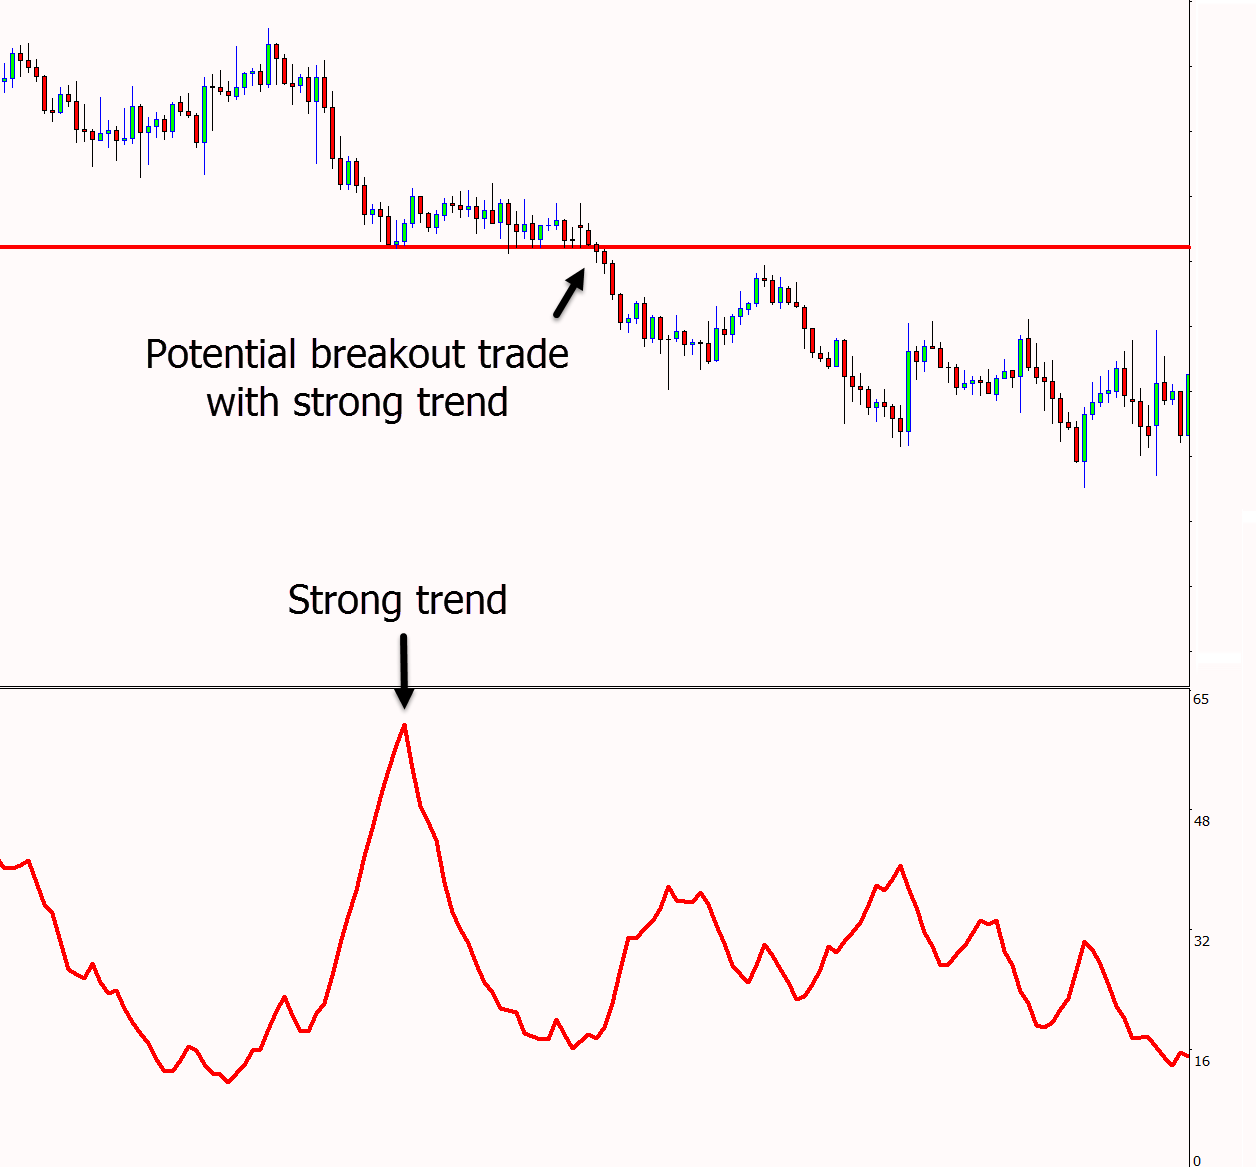
Being able to identify when a trends momentum is strong or is increasing gives you a larger chance of making profitable trend trades.
A lot of traders will use this to their advantage and in their trading strategies. They will also use this information in their trade management including when and how they take profit.
For example; if you are in a trend trade and the ADX begins to decrease and move from a strong trend to no longer trending you could look at managing your open trades.
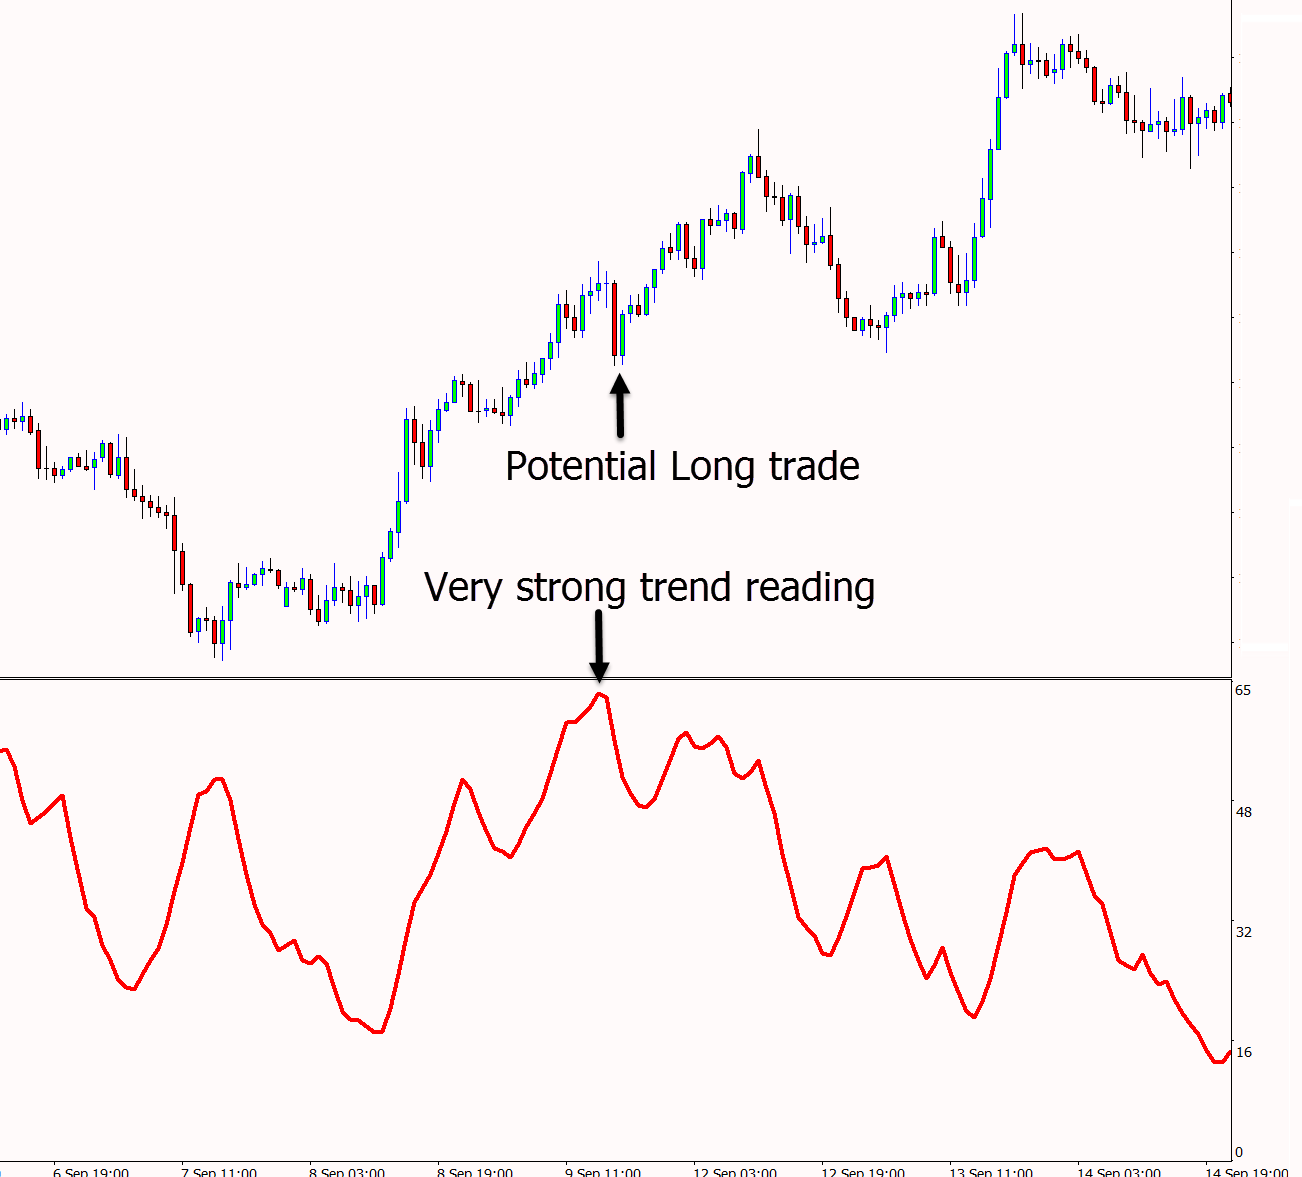
You can use the ADX in your trading to find profitable trend trades.
An example of how you could do this is on the chart below. Using the ADX indicator we see that the price is first in a strong trend and the reading is above 60.
We then look for potential long trades that are inline with the trend higher. This could be when price makes a quick swing lower and gives us a chance to ride the next wave higher.
How to Use ADX Indicator for Day Trading
One of the great things about the ADX indicator is that it can be used on both the higher time frames and also the smaller time frames such as the 5 and 15 minute charts.
This opens the door for potential day trading opportunities.
Many day traders are dependent on finding where the strong momentum is so they can ride the trend during the intraday session.
The average directional movement index can help you both identify the markets that are making the strongest trends and also the different time frames that are making the strongest trends.
The best way to use the ADX for day trading is often to use it over multiple time frames. This way you can find where the best chances are for making the largest reward trades.
For example; you may find that the EURUSD 15 minute chart is in a far stronger trend than the 1 hour EURUSD chart.
Using the ADX in MT4 and MT5
To start using the average directional movement index indicator in your MT4 and MT5 charts is very easy.
Follow these steps;
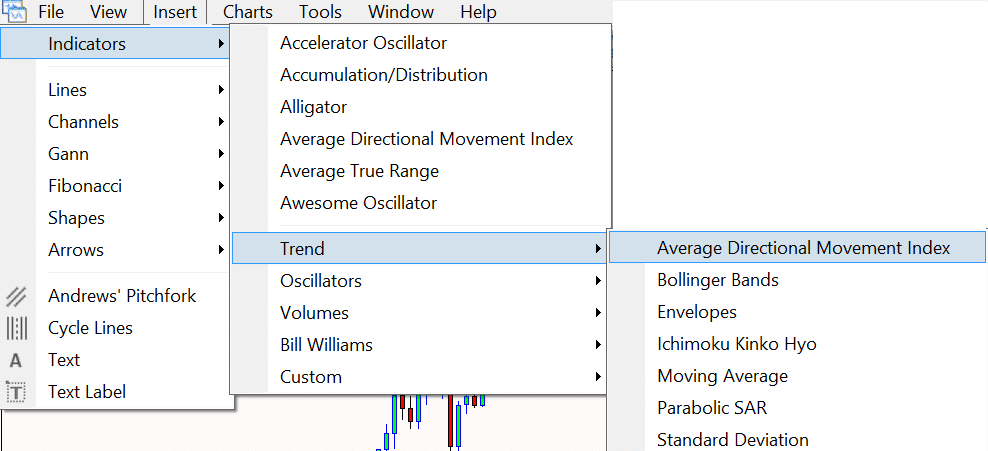
- Open your MT4 or MT5 charts.
- Select ‘Insert’ > ‘Indicators’ > ‘Trend’ > ‘Average Directional Movement Index’.
- When you add the indicator to your chart a box will open with settings you can customize.
- Select the colors you would like for your indicator, the periods you would like and apply to your chart.