You as a trader have two things going for you that you can use to grow your trading account, and both can easily be identified and used on price action charts.
The first major edge you can put in your favor is the trend and the second is finding great setups within the trend.
Trends however; can be tricky to pick at times and having the best indicators on hand to show you how the market is trending, if the momentum is strong, slowing or even coming to and end can help a lot.
This lesson goes through three of the most important trend and momentum indicators to help you pick the trend and also know when it is looking to end.
Table of Contents
What is a Trend?
A trending market is a market where price is moving clearly in one direction over another.
Just because a market is trending does not mean it never makes any moves in the other direction. In fact; these moves that go in the opposite direction to the trend can actually be excellent times to find trades to enter the clear trend.
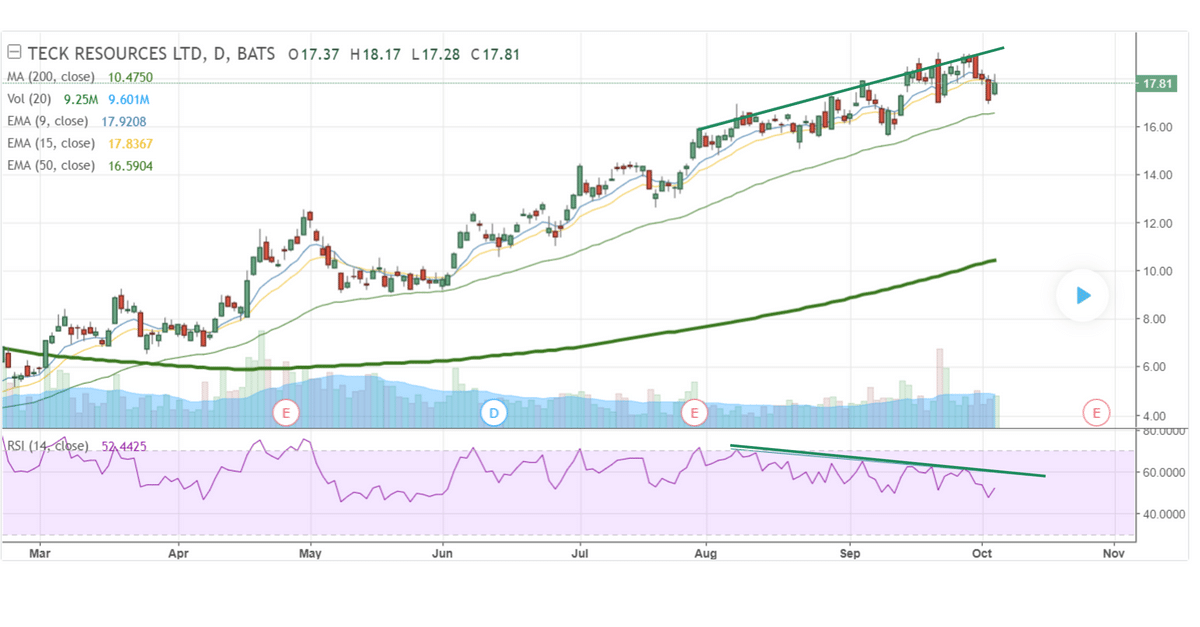
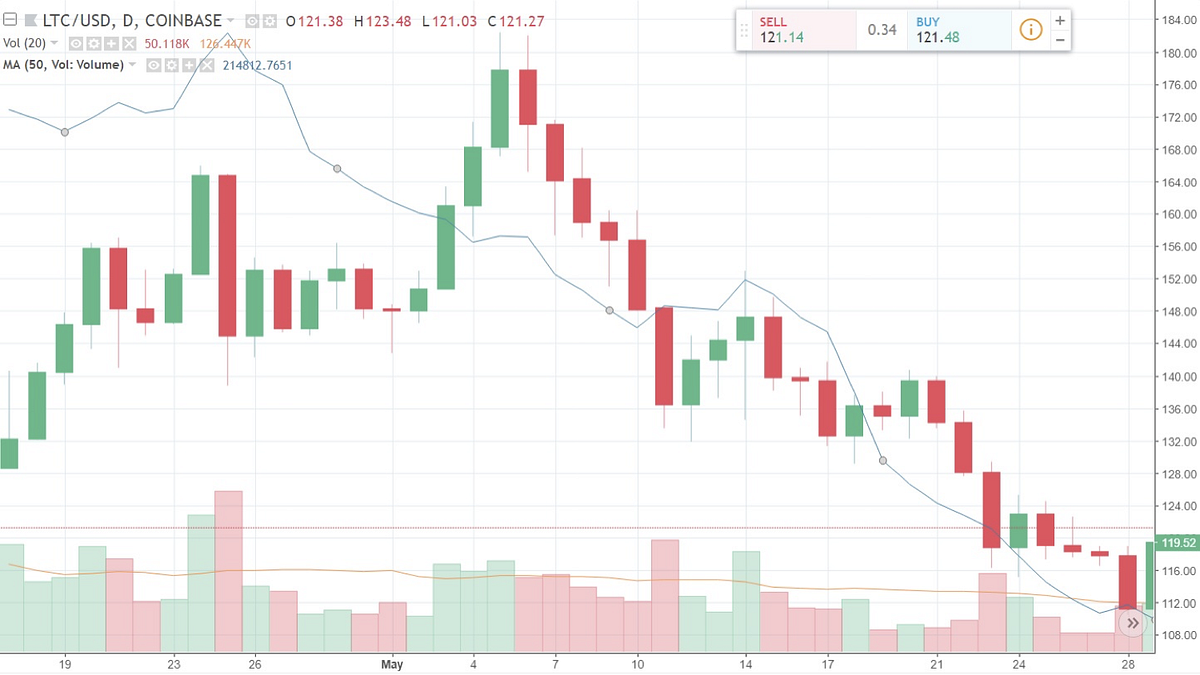
The best way to identify a trend is on a clean price action chart and noting the recent highs and lows.
A trend lower will normally be noted with lower highs and lower lows, and the opposite is true for a trend higher with higher highs and higher lows.
#1: The Moving Average
The moving average is one of the most popular and widely used technical analysis indicators by traders around the world.
The major reason that moving averages are so popular is because they can track and identify trends by smoothing the markets fluctuations.
A moving average is an indicator that will help you smooth out all of the volatile price action movements and identify the main trend in the markets. You can also use them to plot dynamic support and resistance as the markets move higher and lower.
The time frame plays a significant role on how effective your moving average will be.
The moving average length can be applied to any of your chart time frames depending on your trade time frame preference. The time frame or length that you chose for the “look back period” can also play a huge role on how effective you find your moving average.
The moving average is created by the average price over a certain time frame, for example a 21 day moving average showing average prices for the last 21 days. As price changes the moving average moves higher or lower.
The most common application of a moving average is to help you identify the trends direction.
There are two commonly used moving averages:
(1) Simple Moving Average (SMA)
(2) Exponential Moving Average (EMA)
You may find EMA’s or Exponential Moving Averages work better than the SMA’s; Simple Moving Averages in stock / financial markets because of the weight given to the most recent prices.
Read a more in-depth lesson about how to set up and use the moving average in your trading here; Why You Should Use the Moving Average
#2: The Moving Average Convergence Divergence (MACD) Indicator
The MACD is one of the most popular momentum oscillators that a trader can use in their trading.
The MACD or Moving Average Convergence Divergence (MACD) is a technical indicator used by traders to identify a new trend or strong momentum forming. It does this by showing the connection between the price of two moving averages.
There are different types of indicators you can use in your trading that are classed as ‘Lagging, Leading and Confirming‘. The MACD uses the difference between short-term price and long-term price action trends to look to identify future movements.
The MACD is created with two moving averages with different speeds. In other words; one moving average will be quicker to react to a price swing than what the other one is.
The MACD fluctuates above and below zero lines. This highlights for you as a trader both momentum and trend direction as the moving averages converge and diverge.
As the fast line will start to cross the slower line you can begin to identify new trends forming. You will notice with the MACD the fast line diverging or moving away from the slower line, indicating a potential new trend forming.

Forex Markets are extraordinarily volatile and liquid because of the huge number of participants. Whilst stocks can also be volatile and at times create large moves, they will be less liquid and less heavily traded as you move away from the major blue chip stocks, thus making the MACD a great trend trading indicator for the Forex market.
Read more about this and how to use the MACD in your trading at; MACD – Moving Average Convergence Divergence Trading Guide
#3: Stochastic Oscillator Indicator
If you are looking for a price action trading or technical analysis tool that will help you identify where a trend might be ending, then the stochastic oscillator is what you are looking for.
The stochastic oscillator is a momentum indicator that measures the relationship between the closing price of a security or Forex pair to its price range over a period of time you have set.

The stochastic oscillator is used for a few main strategies to help traders find solid trade signals in the market that include;
Trend Following
It can help you identify a trend. This is normally as long as the stochastic keeps crossed in one direction.
Strong Trends
A trader will normally stick with a trend when the stochastic is in the oversold/overbought area.
Breakout Trading
If the stochastic suddenly accelerates in one direction over another and the two stochastic bands are widening, then it can help you determine the beginning of a new trend.
Trend Reversals
When the stochastic is changing direction and leaves an area where price was overbought/oversold it could indicate a new reversal.
You can also combine trend lines and moving averages on the stochastic to confirm this and add to your trading edge.
Read more about how to use the stochastic oscillator
Conclusion
Trading with the trend in your favor can be an easy way to increase your odds of making winning trades.
Using the indicators discussed in this lesson should go a long way to helping you get on the right side of the next market trend.
