Table of Contents
Double Inside Bar Trading Strategy
The double inside bar pattern is a candlestick pattern very similar to the inside bar.
The major difference between the double inside bar and the inside bar is that the double has two inside bars form back-to-back.
In this quick guide we take a look at how to identify the double inside bar and how you can use it in your trading.
What is the Double Inside Bar
The double inside bar is a series of candlesticks where price forms back-to-back inside bars.
Inside bars are a sign of indecision or lack of volatility in the price action where the market has paused and is looking for its next major move.
When we see two inside bars form in succession it shows price is consolidating and could be getting ready to make a large breakout.
How to Identify the Double Inside Bar
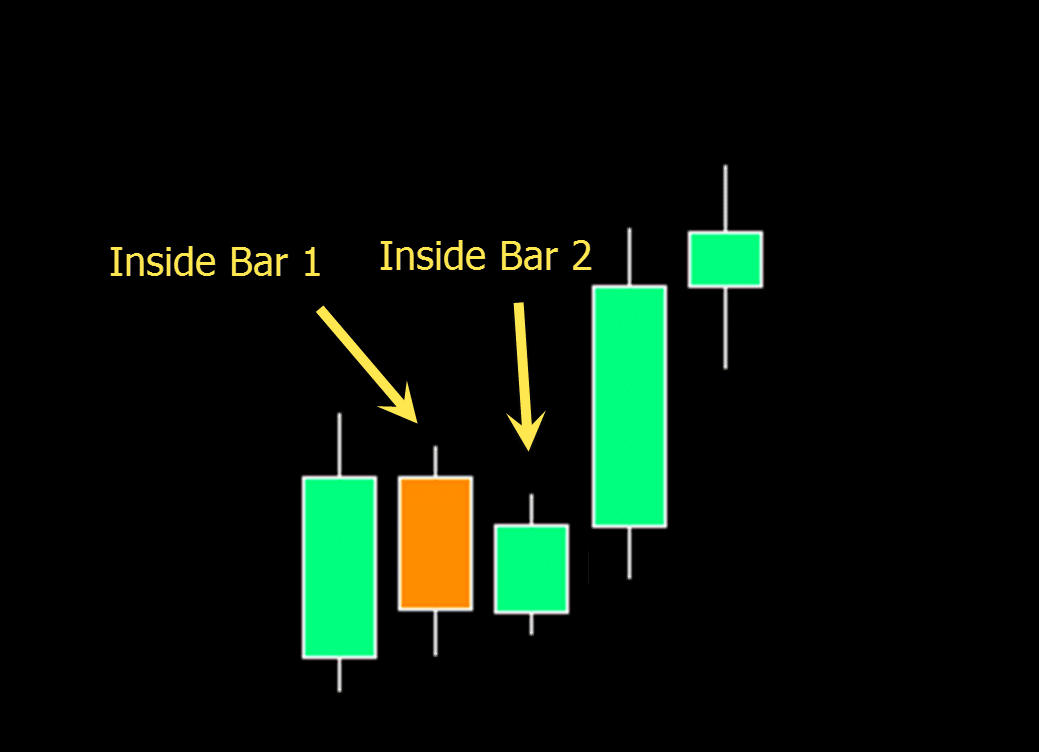
The double inside bar is quite easy to identify.
To spot this pattern on your chart you are looking for three candles.
1: The first candle is the candle that houses the inside bars.
2: Inside bar #1.
3: Inside bar #2.
See the chart example below;
How to Trade the Double Inside Bar
The double inside bar is normally traded as a breakout pattern.
Whilst you can use this pattern to trade both long and short, you want to use the other market factors to help you find the best trades.
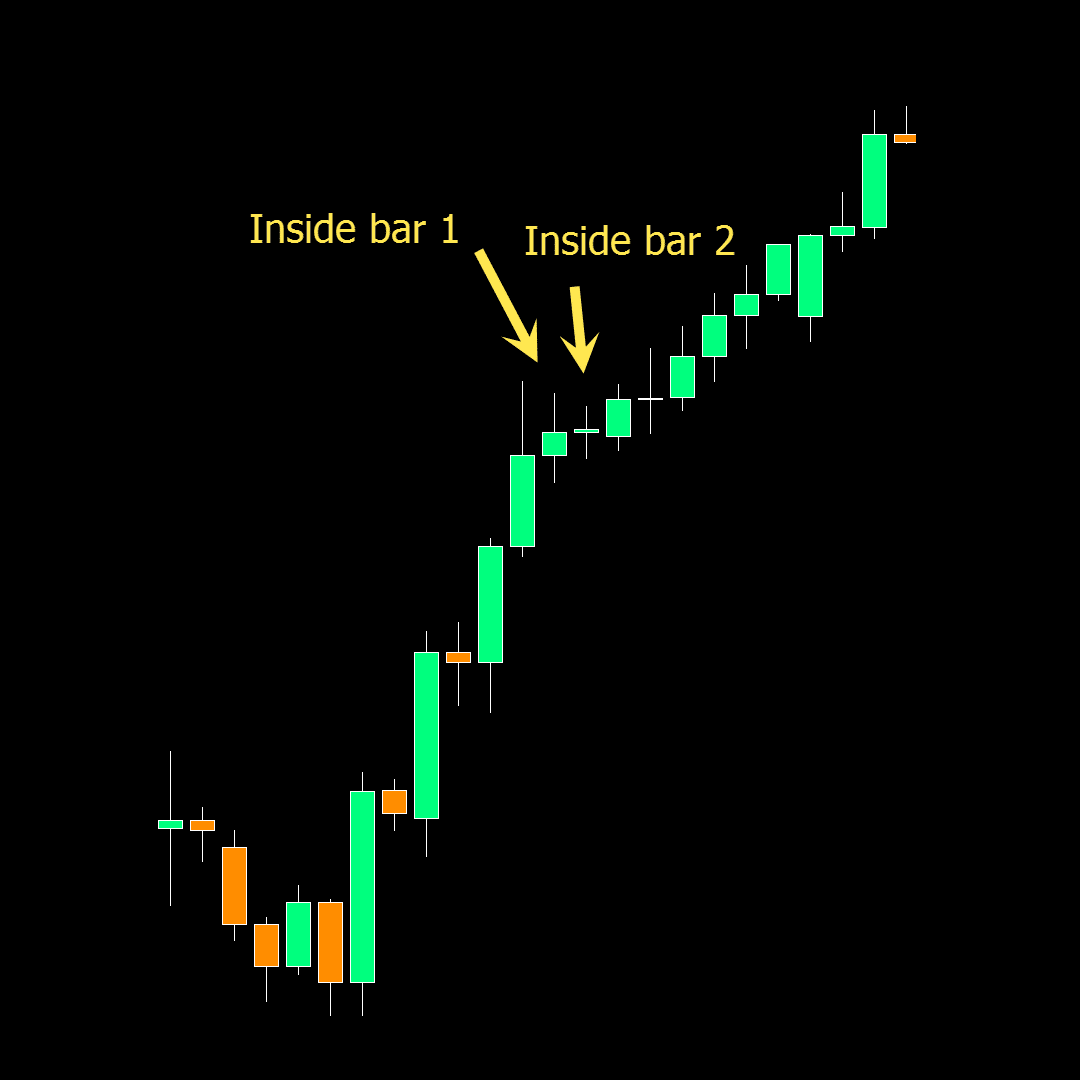
For example; if price has been trending higher, then looking for a double inside bar breakout higher would be the higher probability play.
You can also use your other technical analysis tools to make the trade setup higher probability. These could include using relevant support and resistance, moving averages and other key indicators.
Entry
Below is an example of the double inside bar pattern formed in an uptrend.
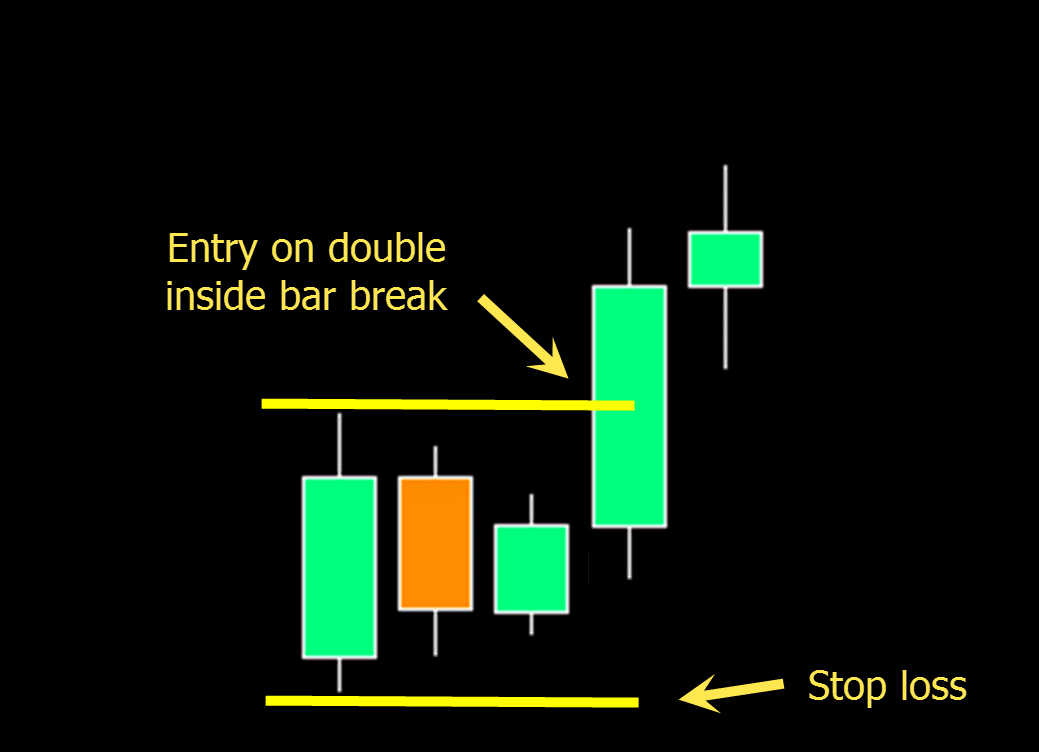
If looking to enter this trade you could set your entry for when price breaks out higher and the pattern is confirmed.
If price does not break higher you would cancel your entry order.
Stop Loss
The stop loss would normally be placed on the other side of the inside bar pattern.
As the chart example shows below; after taking an entry on the breakout higher, the stop loss could be set on the other side of the pattern so that if price reverses the loss would be minimized.
Target
You can set your target using the relevant price action support and resistance levels and using your other key indicators.
These could include reading the price action clues or looking for important Fibonacci levels.
Lastly
The double inside bar is best traded and is used in conjunction with other technical analysis tools such as the moving average, major support and resistance levels and your favorite indicators.
Whilst you can find and trade this pattern on all time frames, the 15 minute chart and higher will tend to work better as the price action picture is clearer with less noise.
