Support and resistance has always been the biggest attribute of technical analysis.
It is used by a huge majority of traders in the markets, from the big banks, large trading companies, right down to the small retail traders. It is also the most basic technical analysis pattern where you can find where supply and demand meet.
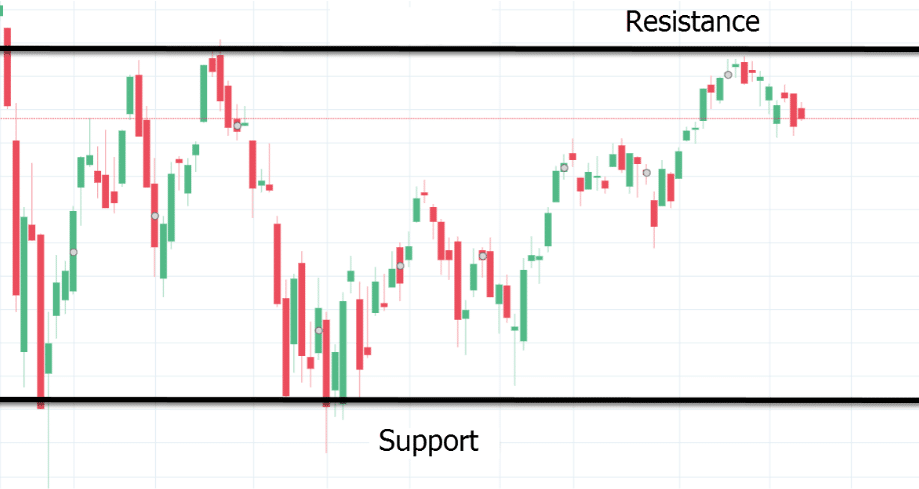
Basically, it is used to refer to price levels on a chart, preventing the price from getting pushed in a certain direction.
As we discuss in our guide to using price action and technical analysis, knowledge about the use of support and resistance plays a big role in identifying potential long and short trading opportunities.
In this lesson we go through how you can save time by using the best indicators to draw your support and resistance on your MT4 and MT5 charts.
Table of Contents
What is Support and Resistance?
Support is a level where demand is thought to be strong enough to pause the price from declining. As the price of a security drops and gets cheaper, buyers will tend to buy more and sellers will be less inclined to sell, thus forming a support line.
On the other hand, resistance provides potential trade entries to get short, or find exit points for your long trades.
Resistance is a level that will often be strong enough to pause the price from rising. As the price of a security moves towards resistance, sellers will tend to sell more and buyers will be less inclined to buy.
Main Methods to Identifying Support and Resistance
When a market moves up and makes a pullback, the highest point of the pullback is resistance. If the market continues upward, the lowest point reached before it started the move is now support.
How can you actually identify support and resistance? There are three main ways to identify support and resistance.
‘Psych’ Levels
Psychological levels occur when the price ends with multiple 0’s.
For example, if the given price is 1.2250, then a trader will be more likely to round off the price to something simpler, like 1.2300 or 1.2200.
The most common psych levels involve price having two zeros at its end (1/10th of a pip is not included), such as 2.2100 or 127.00. The more powerful psych levels end with three 0’s, like 3.4000 or 340.00. These levels are often referred to as big round numbers.
Swing Highs and Lows
Another way of finding support and resistance levels is to find past levels and mark each where price had difficulty breaking through.
Each level that price has bounced off could be a level in the future that price tends to bounce off again.
This method takes time as it requires you to mark levels on all of your currency pairs. In the long run this method can be more consistent.
Pivot Points
The use of pivot points is to determine directional movement and potential support and resistance levels. It uses the period’s high, low, and close to determine future support and resistance levels.
Without a doubt, this is one of the easiest support and resistance levels to use.
How to Trade With Support and Resistance?
If you are a long-term trader, then use price charts based on hourly, daily, weekly, or monthly interval periods.
It is important to remember that you choose a chart based on price intervals that align with your trading strategy.
If you are a day trader and use support and resistance to help find entries and exits, then the price interval period should be short-term, such as the 15-1 minute time frame.
Support and resistance can be traded using the following techniques:
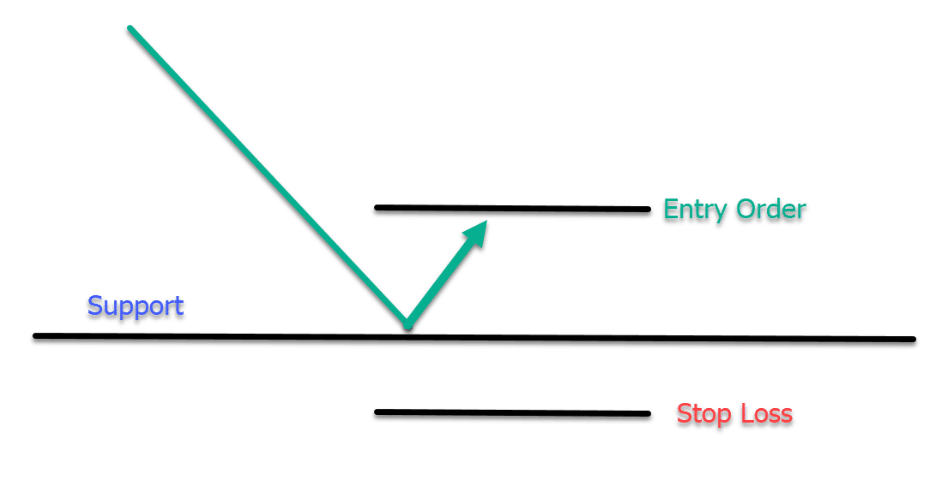
Support and Resistance Bounce
As its name suggests, the goal of this technique is to capture the rebound. What this strategy does is tell you if the price does not break the support or resistance.
Many traders make errors on setting their orders directly on support and resistance levels.
When you are using the bounce, you want to boost the odds in your favor and find some confirmation of a hold of support or resistance.
Example: instead of buying immediately, you might want to wait for a bounce first before you enter.
If you are going to go short, wait for it to bounce off a resistance level before you enter.
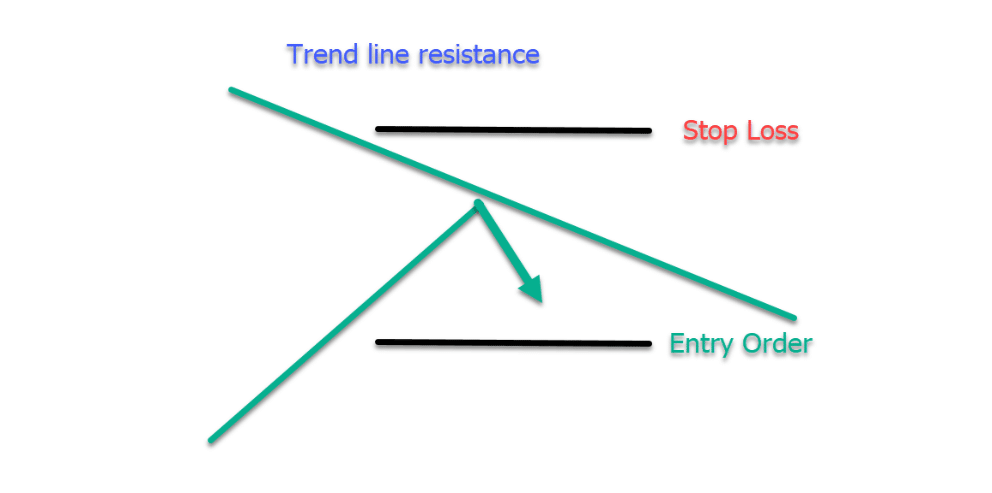
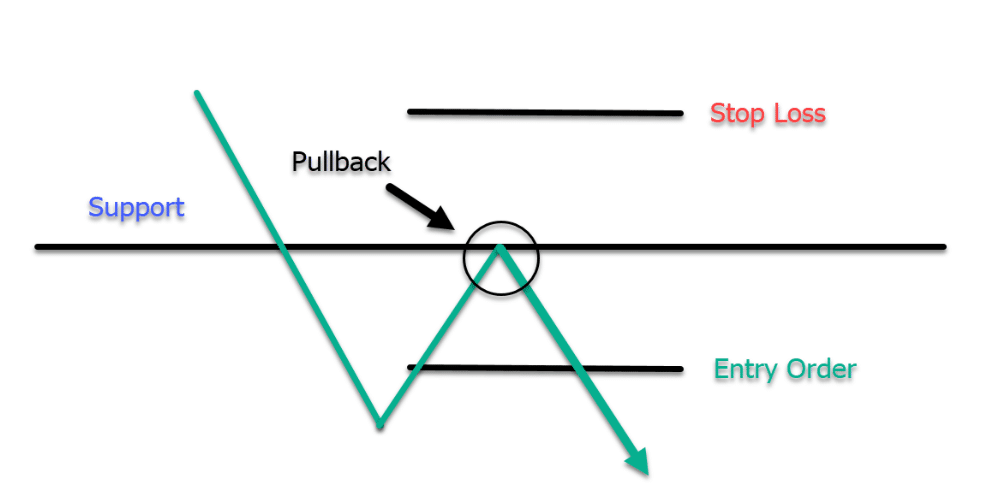
Support and Resistance Break
You can play support and resistance breakouts in two ways. Either the easy way, or the hard way.
The Easy Way
Instead of entering on the break, wait for a price pullback to the support and resistance level and enter after the price bounces.
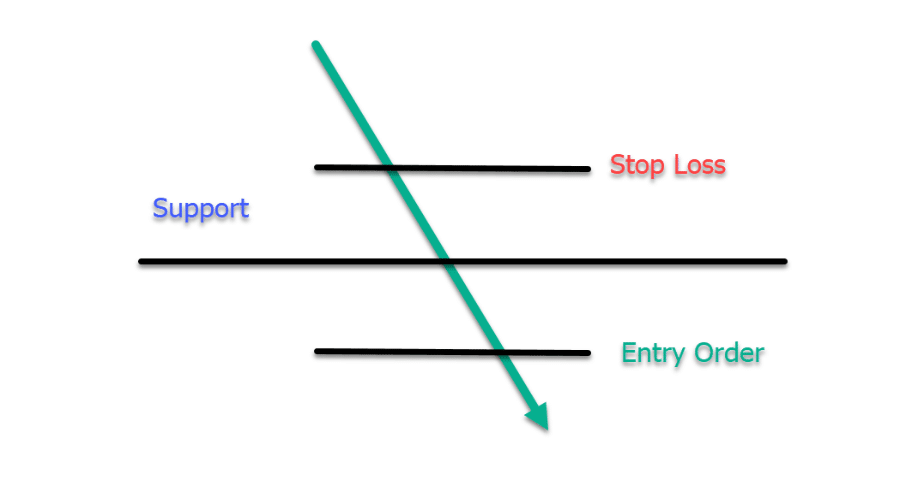
The Hard Way
The best way to play breakouts is to buy or sell whenever the price passes through the zone. You run a large risk of being entered into false breaks by simply entering straight into support or resistance breaks when they are first occurring.
Finding Support and Resistance With Indicators
Support and resistance can at times be both incredibly tricky to accurately draw and also very time-consuming.
Having an indicator that plots your support and resistance for you will save you time and help you with the best levels.
Below we have listed some of the best free support and resistance indicators you can use on MT4 and MT5.
NOTE: If you do not yet have the correct charts, make sure you read about the MT4 / MT5 charts you can get free here.
Support and Resistance Indicator MT4
This is quite a handy indicator that uses an algorithm to find support and resistance levels.
It is able to do this by scanning a set of candles and then identifying where price has bounced or is pausing.
After doing that it calculates the median price to draw a support or resistance level for you on your chart.
This MT4 support and resistance indicator comes with;
- Sensitivity Configuration
Show as many or little levels as you want.
- See Support and Resistance on Different Time Frames
This can help you see the same levels over different time periods.
For example; if you are on the daily chart and you want to move to a smaller chart to see what the level looks like, you can with this indicator.
- Notifications
You are able to configure the support and resistance indicator to send you notifications.
Read and Download MQLTA MT4 Indicator
Support and Resistance Indicator MT5
This is a simple support and resistance indicator for MT5 that uses Fractals to show you the support and resistance levels.
The support levels are calculated based on the “Fractals down”, whilst the calculation of the resistance levels are based on the “Fractals up” of the Fractals indicator created by Bill Williams.
Read and Download Nikolay Kositsin MT5 Support and Resistance Indicator
How to Use These Indicators on MT4 and MT5
MetaTrader 4 Download and Install Indicators
NOTE: If you do not yet have the correct MT4 / MT5 charts you can get free demo charts here.
Installing Indicators
To install indicators on MetaTrader 4, use these steps:
#1: Download MT4
#2: On the upper left corner you will see the “File” button. Click this and select the “Open data folder” tab.
#3: A folder should pop up on your screen. Navigate to the folder named “MQL4”.
#4: After that, navigate to the folder named “Indicators”.
#5: Drag and drop the indicators you want to install inside the indicators folder. This can be done through copy and paste or dragging straight into this location.
#6: Close the folder and the MetaTrader 4 platform
#7: Open the MetaTrader 4 platform and the indicators should be installed and ready to use.
Note: Make sure to restart MetaTrader 4 after installing your indicators.
Applying Your Indicator on the Chart
In order to apply and use the indicator on your chart, follow these steps:
Step #1: First, select the pair you wish to use.
Step #2: Go to the “Insert” toolbar at the top of the platform.
Step #3: Navigate to “Indicators” (if it is a custom indicator, then you can find it in the custom tab).
Step #4: Select your indicator.
Step #5: If a menu pops up to configure options, follow the instructions given by the indicator creator.
Step #6: Make sure that the “Allow DLL imports” is checked and click ok.
Now, the indicator should be displayed on your chart
MetaTrader 5 Download and Install Indicators
Installing Indicators
With MetaTrader 5, you can also follow the steps on the MetaTrader 4 step by step guide above. The difference here is the file format. The MetaTrader 5 indicator file should end with .mq5 or .ex5.
Step #1: On the upper left corner you will see the “File” button. Navigate to it and select the “Open data folder” tab.
Step #2: A folder should pop up on your screen. Navigate to the folder named “MQL5”.
Step #3: Navigate to the folder named “Indicators”.
Step #4: Inside the indicator folder you can add the indicators you want to install.
Step #5: Close the folder and the MetaTrader 5 platform
Step #6: Open the MetaTrader 5 platform and the indicators should be installed and ready to use.
Note: Make sure to restart MetaTrader 4 after installing your indicators.
Applying your indicator on the chart
In order to apply the indicator on your chart, follow these steps:
Step #1: First, select the pair you wish to use.
Step #2: Go to the “Insert” toolbar at the top of the platform.
Step #3: Navigate to “Indicators” (if it is a custom indicator, then you can find it in the custom tab).
Step #4: Select your indicator.
Step #5: If a menu pops up to configure options, follow the instructions given by the indicator creator.
Step #6: Make sure that the “Allow DLL imports” is checked and click ok.
Now, the indicator should be displayed on your chart
Lastly
Support and resistance is incredibly important if you are using any sort of technical analysis and price action in your trading.
Whilst these indicators will help you find support and resistance, you still need to have a base knowledge of these major levels so you can make the final trade call confidently.
