Trendlines are one of the most widely used technical analysis tools in the Forex market to help find support and resistance.
If you understand and can draw your trendlines correctly, then they can be an incredibly accurate technical analysis weapon.
There are some key rules to marking your trendlines correctly and a lot of traders struggle at times with forcing the markets and placing their trendlines in the wrong areas.
NOTE: You can get your free Forex Trendline Trading Strategies PDF Below.
Table of Contents
What Are Trendlines Really Used For in Forex Trading?
When marking a trendline you are trying to highlight a support or resistance level and a possible area to find great trades.
You are looking at where price may stop and respect the trendline as a support or resistance.
Before explaining how you can use your trendlines, we need to know the three types of markets;
- Uptrend (usually noted with higher lows and higher highs)
- Downtrend (usually noted with lower highs and lower lows)
- Sideways ranging markets with no clear trend
You can use trendlines to find support and resistance in each of these three markets.
For example; if price is in an up-trend you will quite often see a trendline form with price creating a series of higher lows that match as a support level.
How to Correctly Draw Forex Trendlines
In most of the major lessons you will find discussing trendlines and how to mark them, people discuss using only two swing points.
There is a pretty large flaw in this way of marking trendlines. If you use only two swing points, then you could find a trendline anywhere on the chart at any time. This does not make it a reliable support or resistance level and somewhere you should look to find trades, it just makes it two random points connecting.
If you flip to your own chart now you will see what I mean. I have added an example below; see how we could make any number of trendlines?
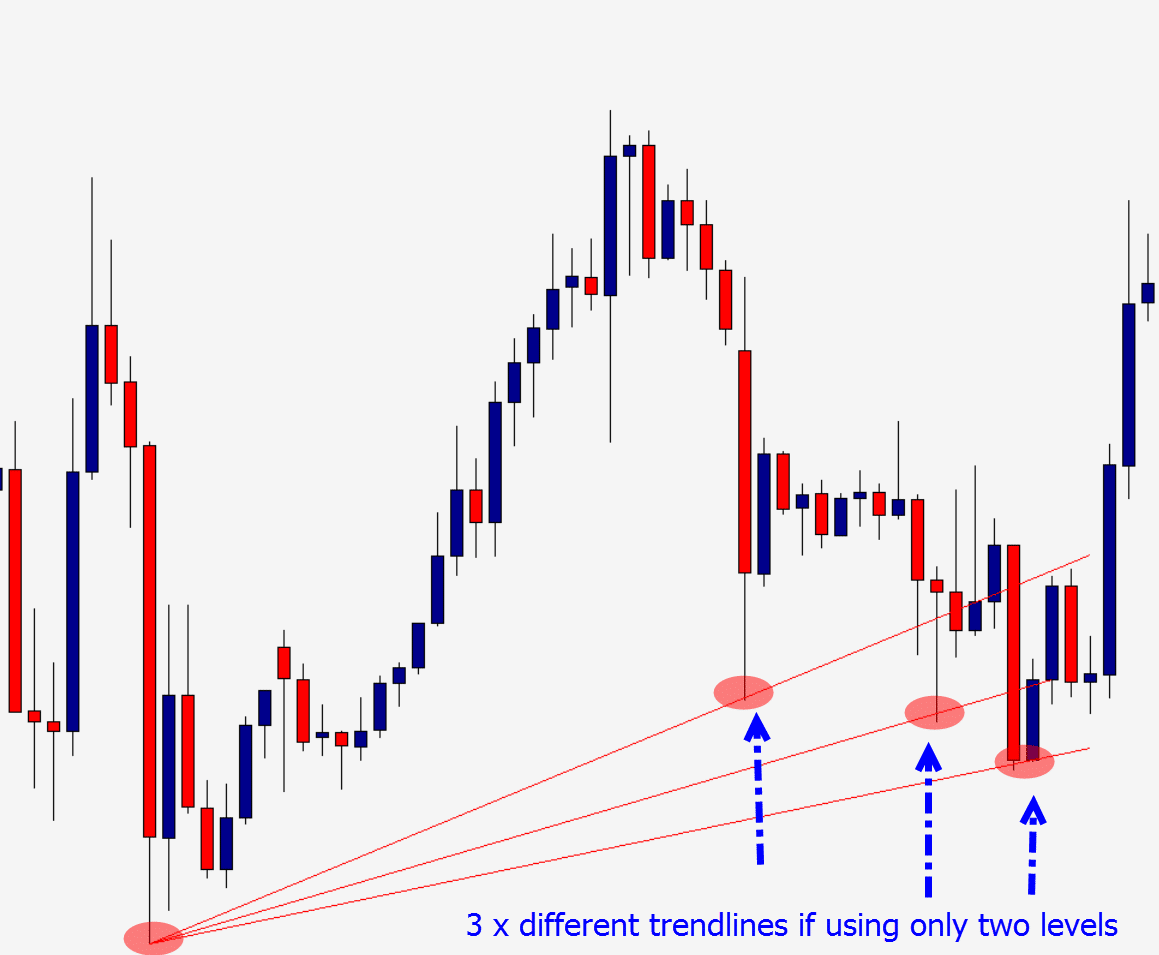
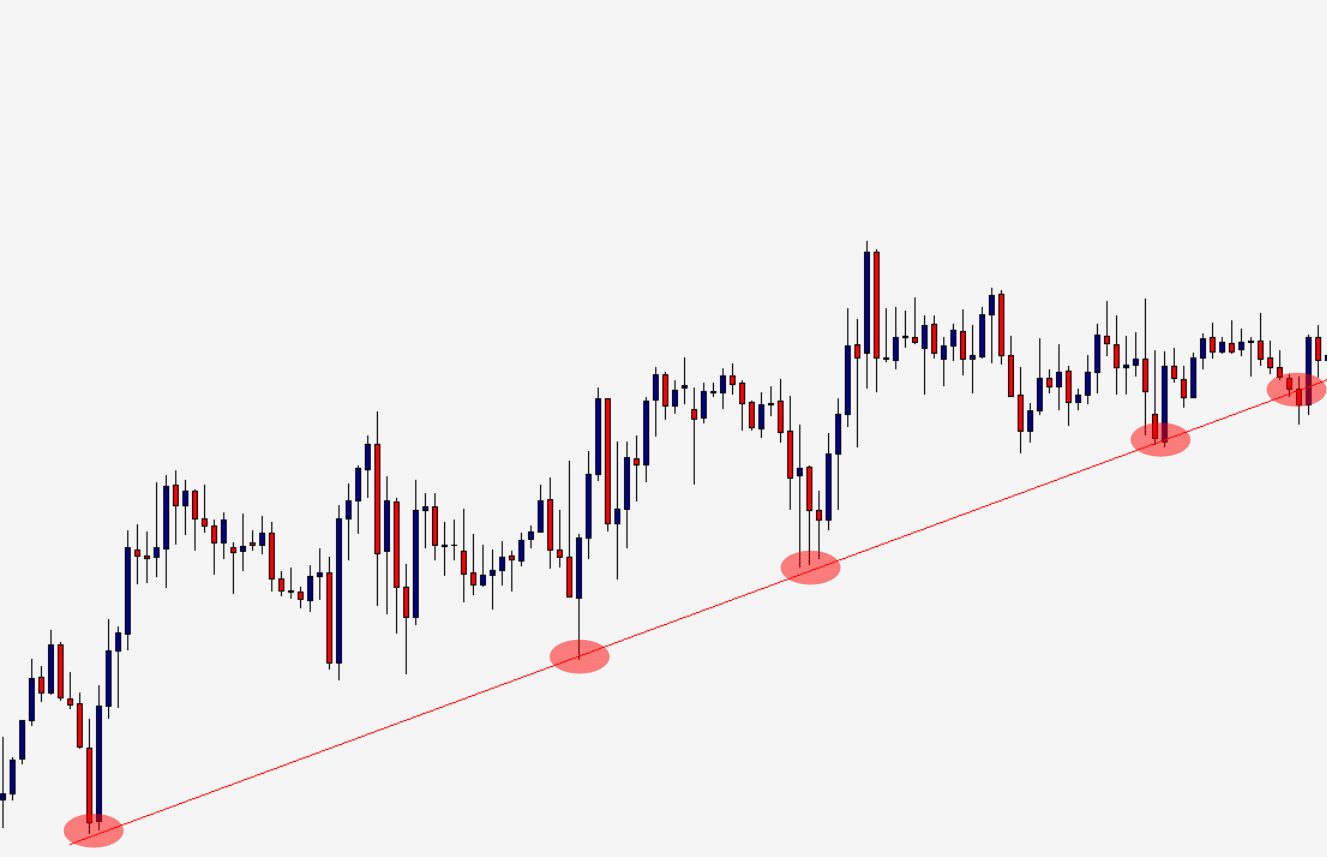
To have a confirmed trendline and a support or resistance we could look to find trades at, we need a minimum of three swing points to line up.
This shows that price has continually respected a level and is not just a random point.
The easiest way for you to mark your trendlines in all three market types is to find the recent swing highs and lows.
Using your charts trendline tools, see if these highs and lows match.
Price is Not Always Perfect
Price will not always create perfect trendlines.
To find the best trendline trading opportunities don’t be tricked by the candle wicks and false breaks that the markets create.
Just like a normal horizontal support and resistance level, the market will false break a trend line.
Also keep in mind when marking your trendlines that they are not perfect exact lines. Trendlines are zones of support and resistance and zones where you are going to look for trades.
Match Your Forex Trendlines With Other Price Action Clues
Whilst trendlines are a great technical analysis tool, you should be using them with other price action analysis to create even better trade setups.
You can increase your chances of making winning trades by lining up trendlines with horizontal support and resistance areas to find sweet spots.
You can also use other technical trading indicators like the Moving Average.
Forex Trendline Trading Opportunities
There are three major trading opportunities that you can keep an eye out for when using a trendline in your trading;
Trendline Reversal Trading
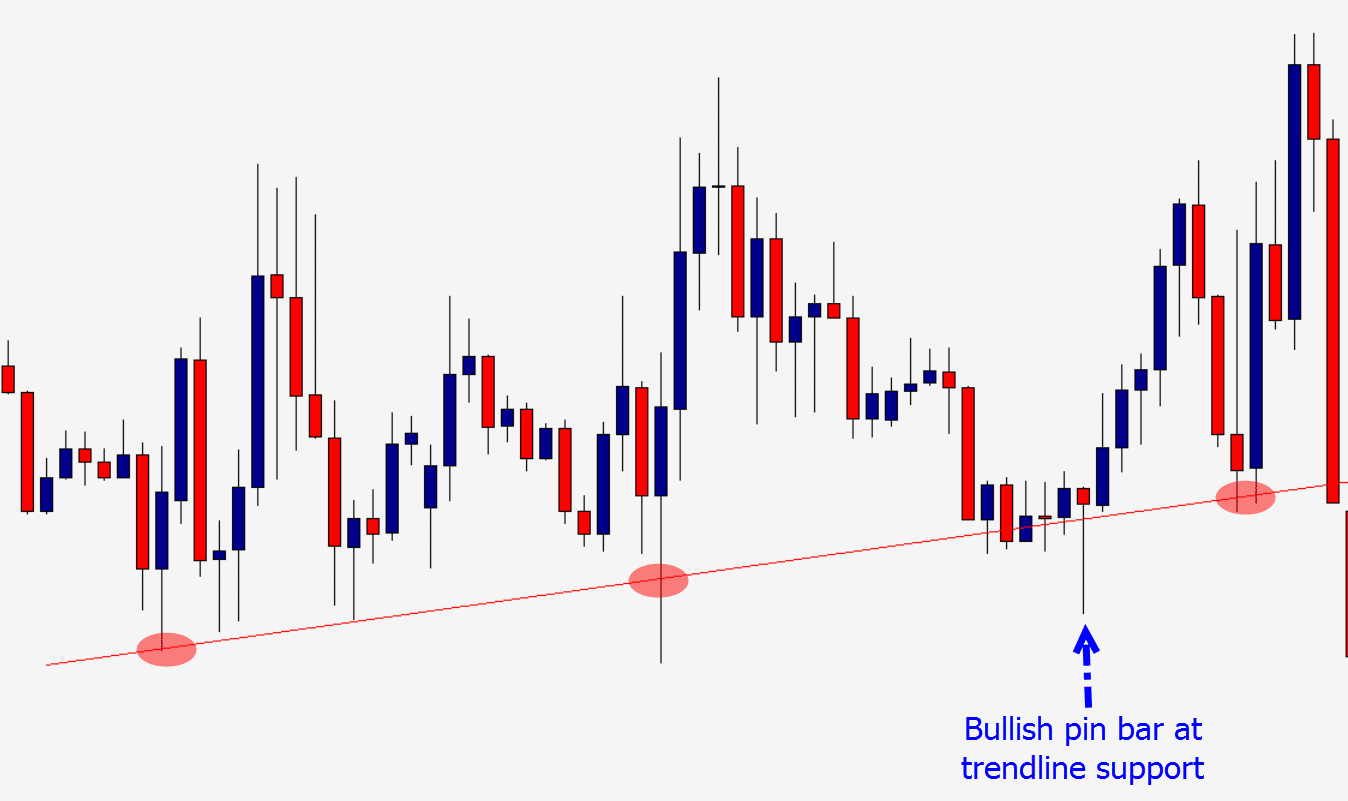
This is the most popular trendline trading strategy and involves marking your trendine and then looking for the market to reverse when it is touched.
Price action traders will increase their odds of making winning trades by using other strategies such as Japanese candlesticks to confirm that price is looking to indeed reverse.
Below is an example of price forming a bullish pin bar reversal when it hits the trendline;
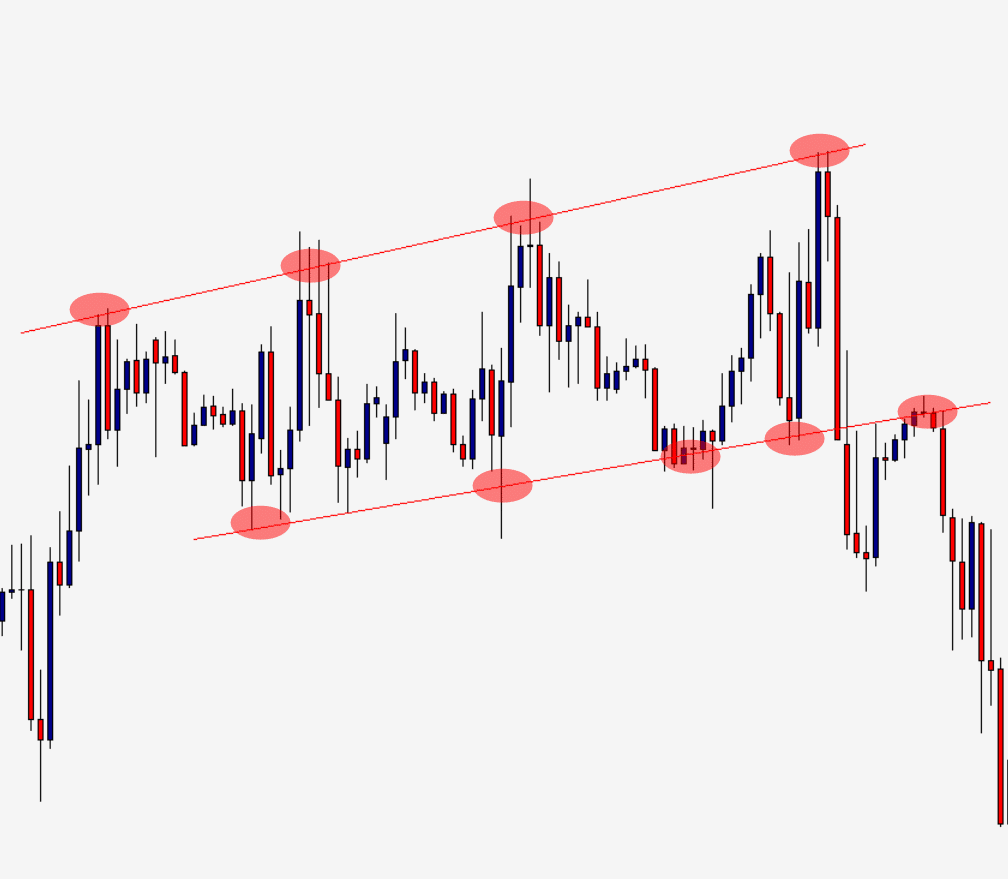
Channel Trading
Trendline channel trading is very similar to range trading, but price is normally making a move either higher or lower.
In this move higher or lower you have both a trendline for support and resistance that you can use to trade the ‘channel’.
When channel trading you could trade both long and short for as long as the channel holds.
See the example below on how to trade channels with trendlines;
Trendline Breakouts
There are two major ways you can look to play a trendline breakout.
The first is the most aggressive and involves watching and waiting for the trendline to break. When you see price has broken and closed outside the trendline support or resistance you enter a breakout trade.
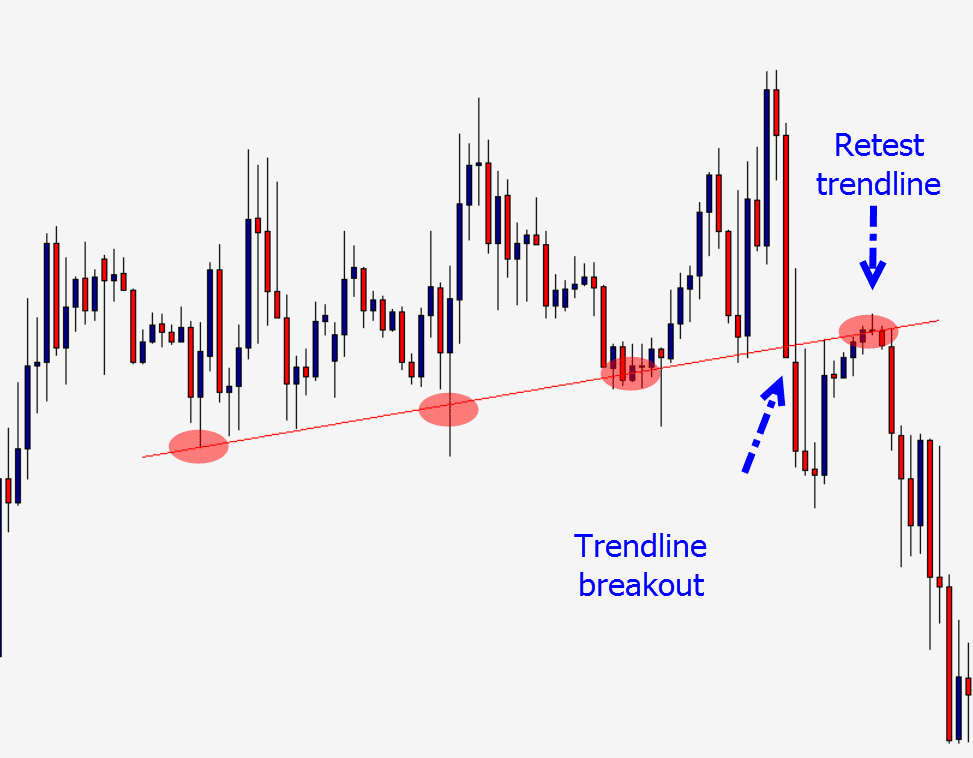
The other method and less aggressive trendline breakout strategy is to watch for a breakout and when you see a break occurring look for price to make a new test of the old trendline support or resistance area.
With this strategy you are looking to see if the trendline support or resistance that has been broken holds as a new support / resistance for you to enter a trade. See example below;
Lastly on Trendlines
It is very easy to mark trendlines where they shouldn’t belong.
Be careful you don’t begin marking trendlines on every single chart just for the sake of marking a trendline. Only mark them when they are obvious and don’t over analyze them.
Make sure you find three clear points of reference and to increase your odds use other strategies like Japanese candlesticks and your favorite indicators.
