Technical Indicators are a fundamental part of technical analysis.
These indicators are the best way for you to forecast financial market direction based on its historic price, volume, and even future contracts. As a trader, you probably want the most effective and common indicator that you can use on your trading basis.
One of the best indicators out there is called the “Moving Average”.
NOTE: Get the Moving Average Trading Guide Free PDF Below.
Table of Contents
What is a Moving Average?
Moving Averages are used widely by traders on their price action charts because they can track and identify trends by smoothing the markets fluctuations.
A moving average is a technical indicator that helps you smooth out price action and it can also identify the predominant trend in a market. They can also be used to provide dynamic support and resistance levels as the markets moves higher or lower.
A moving average is simply showing the average price over a certain period of time. As the price changes, its moving average either increases or decreases.
The common application of moving averages is to identify the trends direction.
It may also be calculated for any sequential data sets, opening and closing prices, high and low price, trading volume, or any other indicators.
There are two commonly used moving averages:
(1) Simple Moving Average (SMA)
(2) Exponential Moving Average (EMA)
Simple Moving Average (SMA)
As the name implies, it is the simplest form of moving average.
It is very easy to understand and is calculated by adding prices over a given number of periods, then dividing the sum by the number of periods.
For example; a 10-day SMA would add together the closing prices for the last 10 days and then divide the total number by 10; a simple arithmetic mean. Each time a new period occurs, the moving average moves forward dropping its first data point and adding the newest one.
Here is another example of a 6-day SMA:
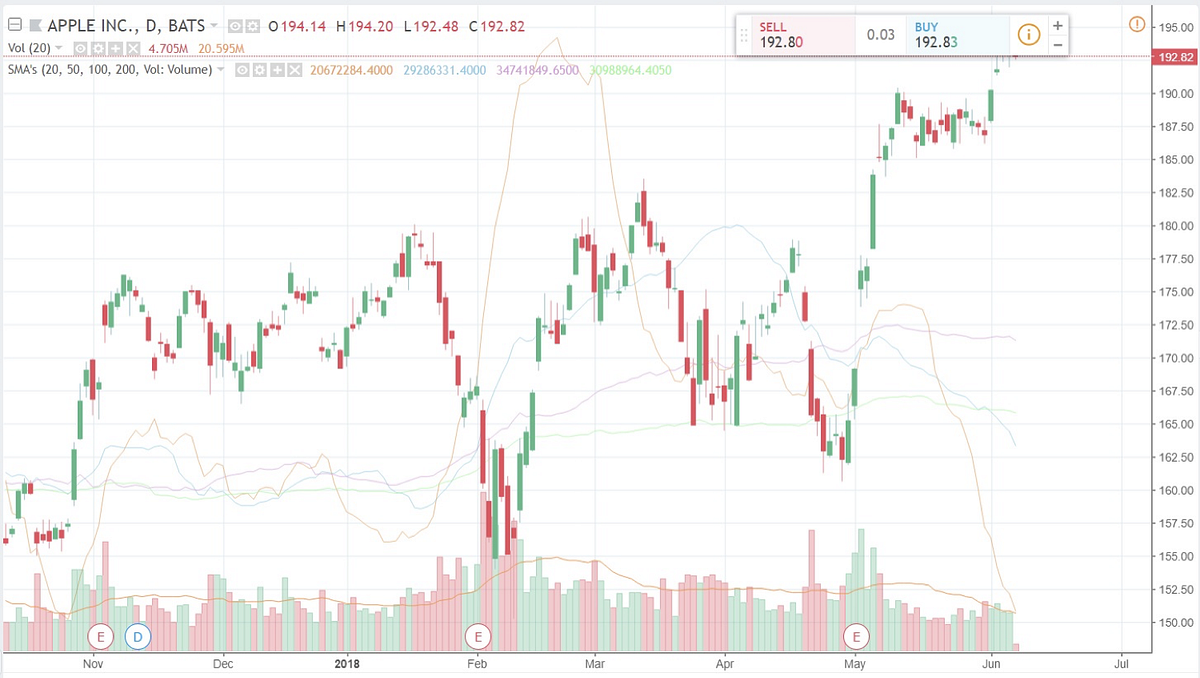
Last Closing Prices for Apple
43.41, 43.52, 43.21, 43.77, 43.58, 43.63 = 261.12
To calculate SMA, divide the total of closing prices by the number of periods
6-day SMA= 261.12/6 = 43.52
Exponential Moving Average (EMA)
Exponential Moving Average is the 2nd most widely used technical indicator.
It gives greater weight to more recent prices and are calculated by applying a percentage of today’s closing price to the recent(yesterday) moving average.
The difference between the SMA and EMA is that SMAs look at all data equally while EMAs will factor recent market moves higher in weight. EMAs also react faster to recent price changes than SMAs.
An EMA has to start somewhere, so an SMA is used as the previous periods EMA in its first calculation. After that, calculate the weighting multiplier. Lastly, calculate the EMA for each day between the initial EMA value and today.
Formula for a 10-day EMA:
Initial SMA: 10-period sum/10
Multiplier: (2 / (Time Periods + 1)) = (2 / (10 + 1)) = 0.1818 (18.18%)
EMA: {Close — EMA (Previous Day)} x Multiplier + EMA (Previous Day)
What Markets is a Moving Average Used in?
Forex Markets are extraordinarily liquid because of the vast number of participants. Stocks can also be liquid, but will be less liquid once you have moved away from the blue chips.
Moving Averages allows you to look at the data smoothly rather than focusing on daily price fluctuations from all financial markets. The time frame plays a significant role on how effective your moving average will be.
This moving average length can be applied to any of your chart time frames depending on your time horizon. Additionally, the time frame or length that you chose for the “look back period” can also play a big role on how effective it is.
EMAs may work better than the SMA’s in stock or financial markets because of the weight given to recent prices, whilst there are other times that SMAs may work better.
What are the Most Popular Moving Average Combinations?
200-Day Moving Average
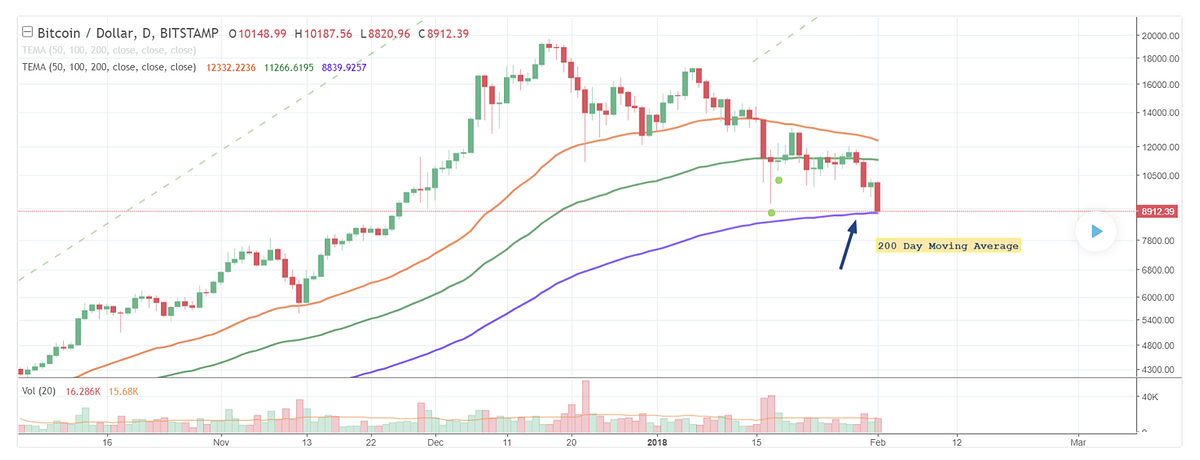
The 200-Day Moving Average is one of the most popular technical indicators used by traders.
This indicator can be found on the charts of investment banks, hedge funds, and market makers. It is considered as a key indicator for determining the overall long-term trend.
Investors use it to analyze price trends. As the name implies, it is a security’s average closing price over the last 200 days.
You can get the 200 moving average by taking the securities closing price over the last 200 days.
[(Day 1 + Day 2 + Day 3 + Day 4 + Day 5 + …. + Day 198 + Day 199 + Day 200) / 200]
= 200-day moving average
50 Day Moving Average
Just like the 200-Day moving average, the 50-Day moving average is one of the most popular technical indicators that investors use for predicting and tracking price trends.
50-Day moving averages are widely used because they work so well. It is calculated with a security’s average closing price over the last 50 days.
[(Day 1 + Day 2 + Day 3 + Day 4 + Day 5 + … + Day 48 + Day 49 + Day 50) / 50]
=50-day moving average
200 EMA Multi-Timeframe
200 EMA is a very popular forex indicator because it can tell you what the trend is before entering a trade.
There are things you need to know about the 200 EMA. It is used to separate bull territory from bear territory. To help you start you need to know that;
- Seeing price below your 200 EMA is often seen as downtrend.
- Seeing price above your 200 EMA is often seen as uptrend.
- The best way to enter it is to use price action by the help of price action charts as it tells you where to place a stop order and use previous swings to take profit.
Possible example of how it works:
- Place a 200 EMA on your daily chart and determine if it’s an uptrend or a downtrend.
- After that, switch to the 4 hour chart. You need to see where the 200 EMA is relative to the price action or if it is the same trend as your daily chart.
- If yes, switch to the 1 hour chart and check to see if it is the same trend as your daily and 4 hour charts.
- You could then potentially execute your trade entries on the 1 hour chart when the trend on your 1 hour chart is the same as your 4 hour and daily charts.
Moving Average Crossover
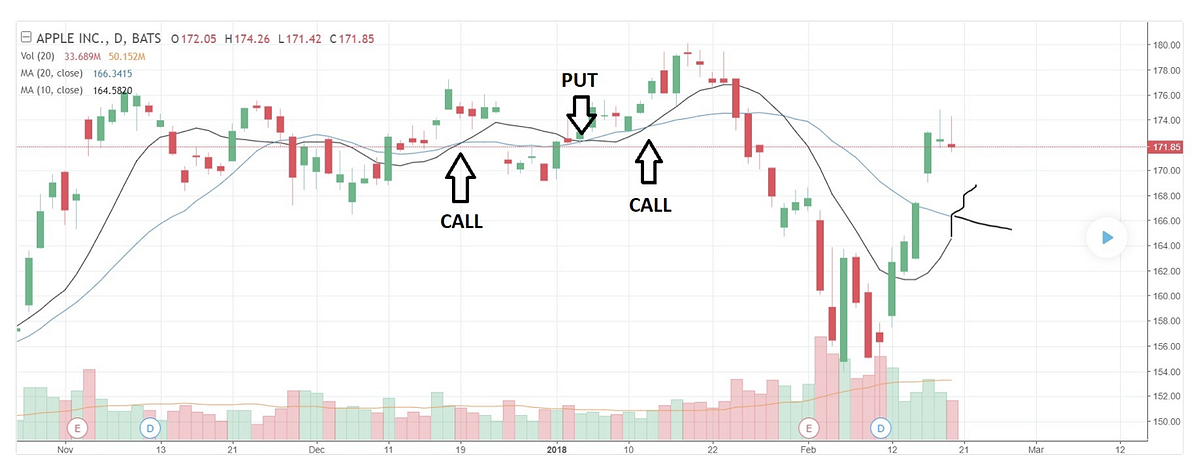
Known as the most basic type of signal, crossovers are the most favored among traders as they remove all emotions.
They are used to identify shifts in momentum and can be used to determine entry and exit strategy. A moving average crossover occurs when the traces of two moving averages cross. Crossovers shows trends but does not predict future direction.
In general, this indicator combination uses two or more moving averages, a slow-moving average and a faster moving average. Additionally, the faster moving average is a short term moving average.
Short term moving averages are more reactive to daily price changes because they only considers a short period of time.
How to Use the Moving Average in Your Trading?
The main function of Moving Average is to identify trends and reversals, find support and resistance, and measure an asset’s momentum. Moving Averages help to define the trend and recognize changes in the trend. Many traders, however, make some fatal mistakes when it comes using moving averages.
Trend Analysis
Moving Averages do not predict new trends because of its lagging indicator nature, but they can track and confirm trends once they been established.
The moving average crossover as discussed above is also a great tool for searching for potential newer trends taking place.
Support & Resistance
MA’s can also be used to determine dynamic support and resistance.
It is easy to notice that the falling asset of a price will stop and reverse its direction like the same level as an average. Stocks will often reverse either up or down at price levels that are close in proximity to popular MA’s as these levels are acting as confirmation levels.
Recap
Moving Averages are a valuable analytical tool. Before it can become effective, you must first understand its functions, when and where to use it and practice with it through a demo account.
NOTE: Get the Moving Average Trading Guide Free PDF Below.
