The Ichimoku Kinko Hyo is a Japanese charting indicator that at first glance looks to be very complicated, but is actually quite simple.
Once you have the indicator plotted on your charts you will be able to quickly and easily spot trends and new potential trade entries.
In this post we go through exactly what the Ichimoku Kinko Hyo is, how to calculate it and most importantly how to use it in your trading to find trade setups.
NOTE: Get the Free Ichimoku Kinko Hyo Trading PDF Download Below.
Table of Contents
What is the Ichimoku Kinko Hyo
The Ichimoku Kinko Hyo is used to find potential support and resistance areas along with identifying the current market trend.

Ichimoku Kinko Hyo translates to “one look equilibrium chart” and means that in one look you can quickly identify the market trend and support or resistance levels.
The Ichimoku Kinko Hyo is formed with the following;
Kijun Sen: This line is often referred to as the base line or the standard line.
This is calculated with the average of the highest high and lowest low of the previous 26 periods.
Tenkan Sen: This line is often referred to as the conversion line or the turning line.
It is calculated with the average of the highest high and lowest low of the previous nine periods.
Chikou Span: This line is often referred to as the lagging line.
It is calculated with today’s closing price plotted 26 periods behind.
Senkou Span A: This is also referred to as Leading Span A.
This is one of the two ‘clouds’ and is midpoint between the conversion and base line. It is plotted 26 periods ahead and is the faster cloud.
Senkou Span B: This is often referred to as Leading Span B.
It shows the second cloud on your chart. This is calculated by averaging the highest high with the lowest low for the previous 52 periods and then plotted 26 periods ahead.
Whilst all of these calculations can seem a little overwhelming, there is no real need for you to remember them or take notes.
Your indicator will automatically plot these for you on your chart and it is more important you know how to identify and then trade the visual patterns.
Three things that are important to remember;
- If price is above the cloud, then price is bullish.
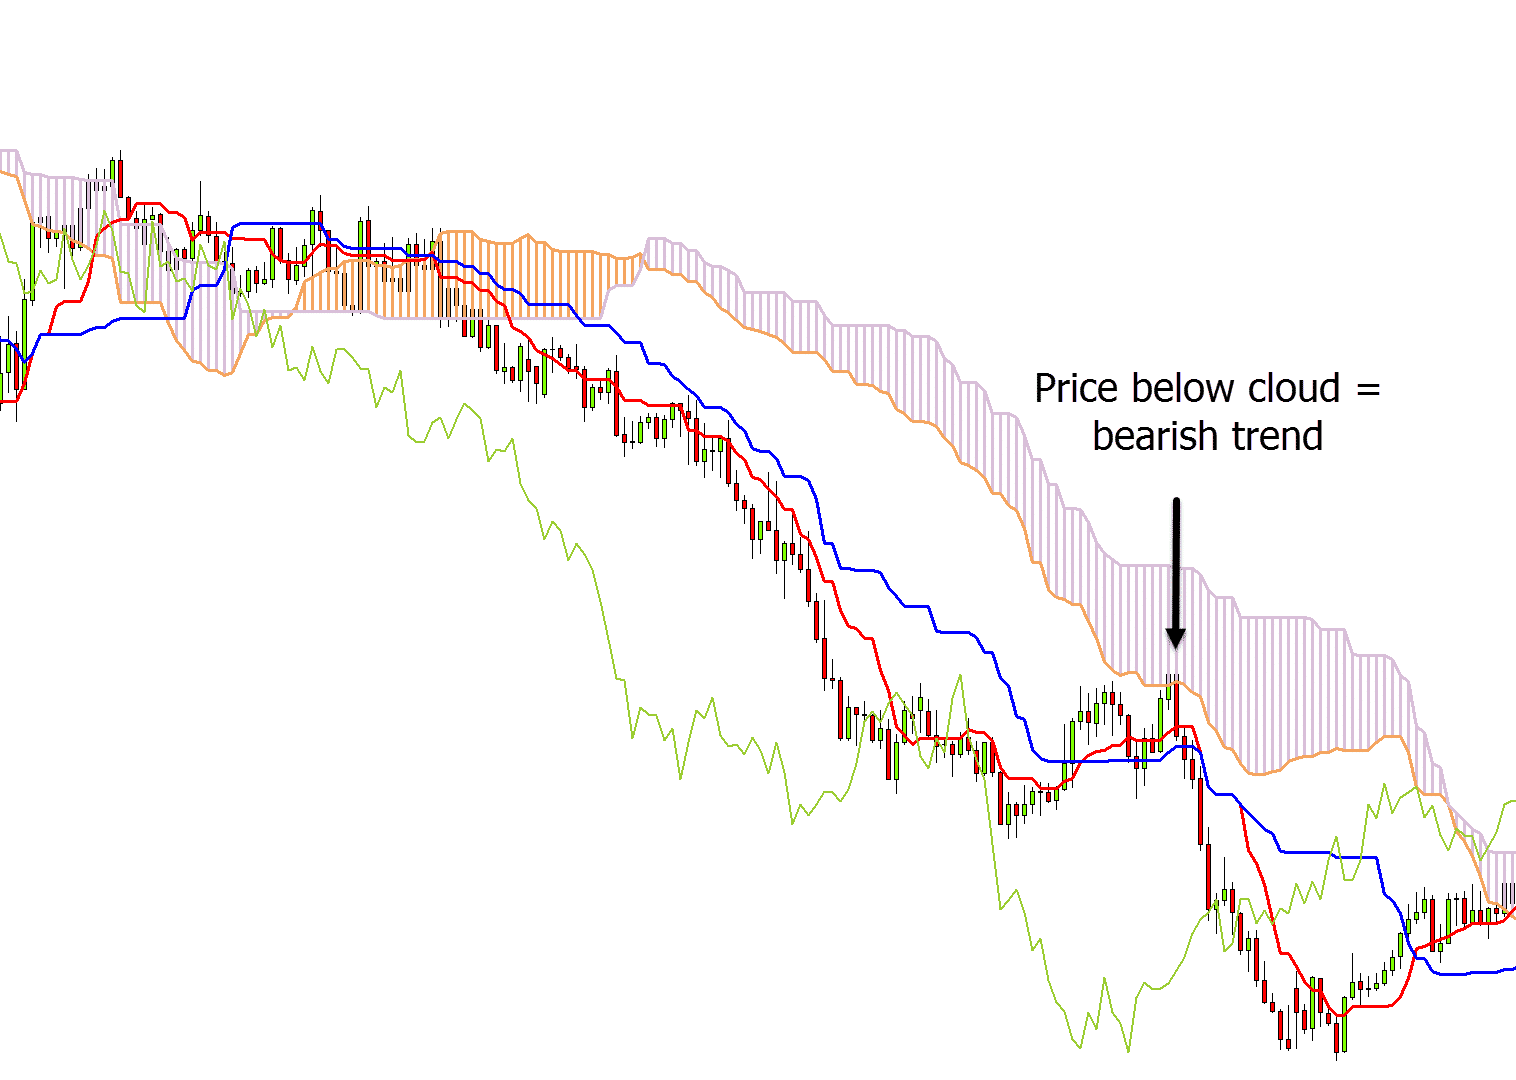
- If the price is above the cloud, then the price is bearish.
- The cloud can act as support and resistance.
How to Use the Ichimoku Kinko Hyo
Ichimoku Kinko Hyo MT4
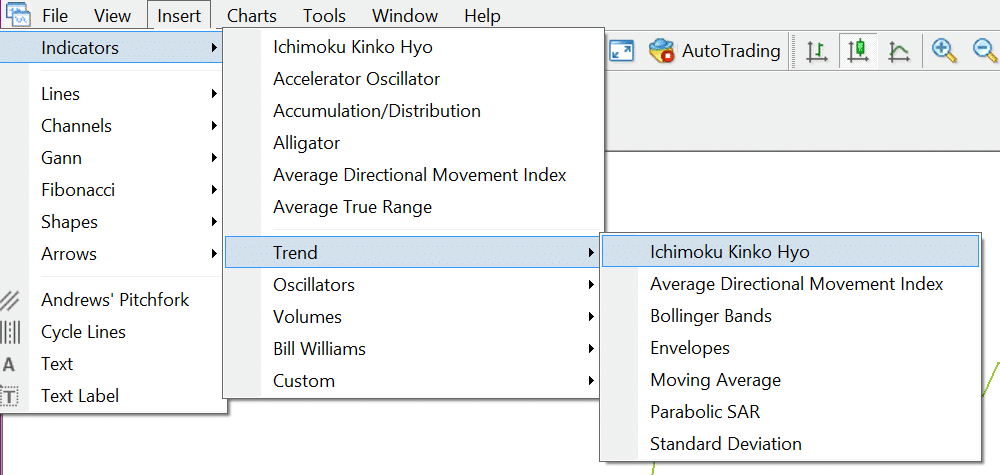
The first thing you need to do is bring up your Ichimoku Kinko Hyo indicator on your MT4 or MT5 charts.
This is very simple.
Open your Metatrader Charts. Click “Indicators” > “Trend” > “Ichimoku Kinko Hyo”.
Once you click on the indicator a box will open on your charts and give you some options that you can customize such as the different colors you would like for your lines.
Identifying the Trend with the Ichimoku Kinko Hyo
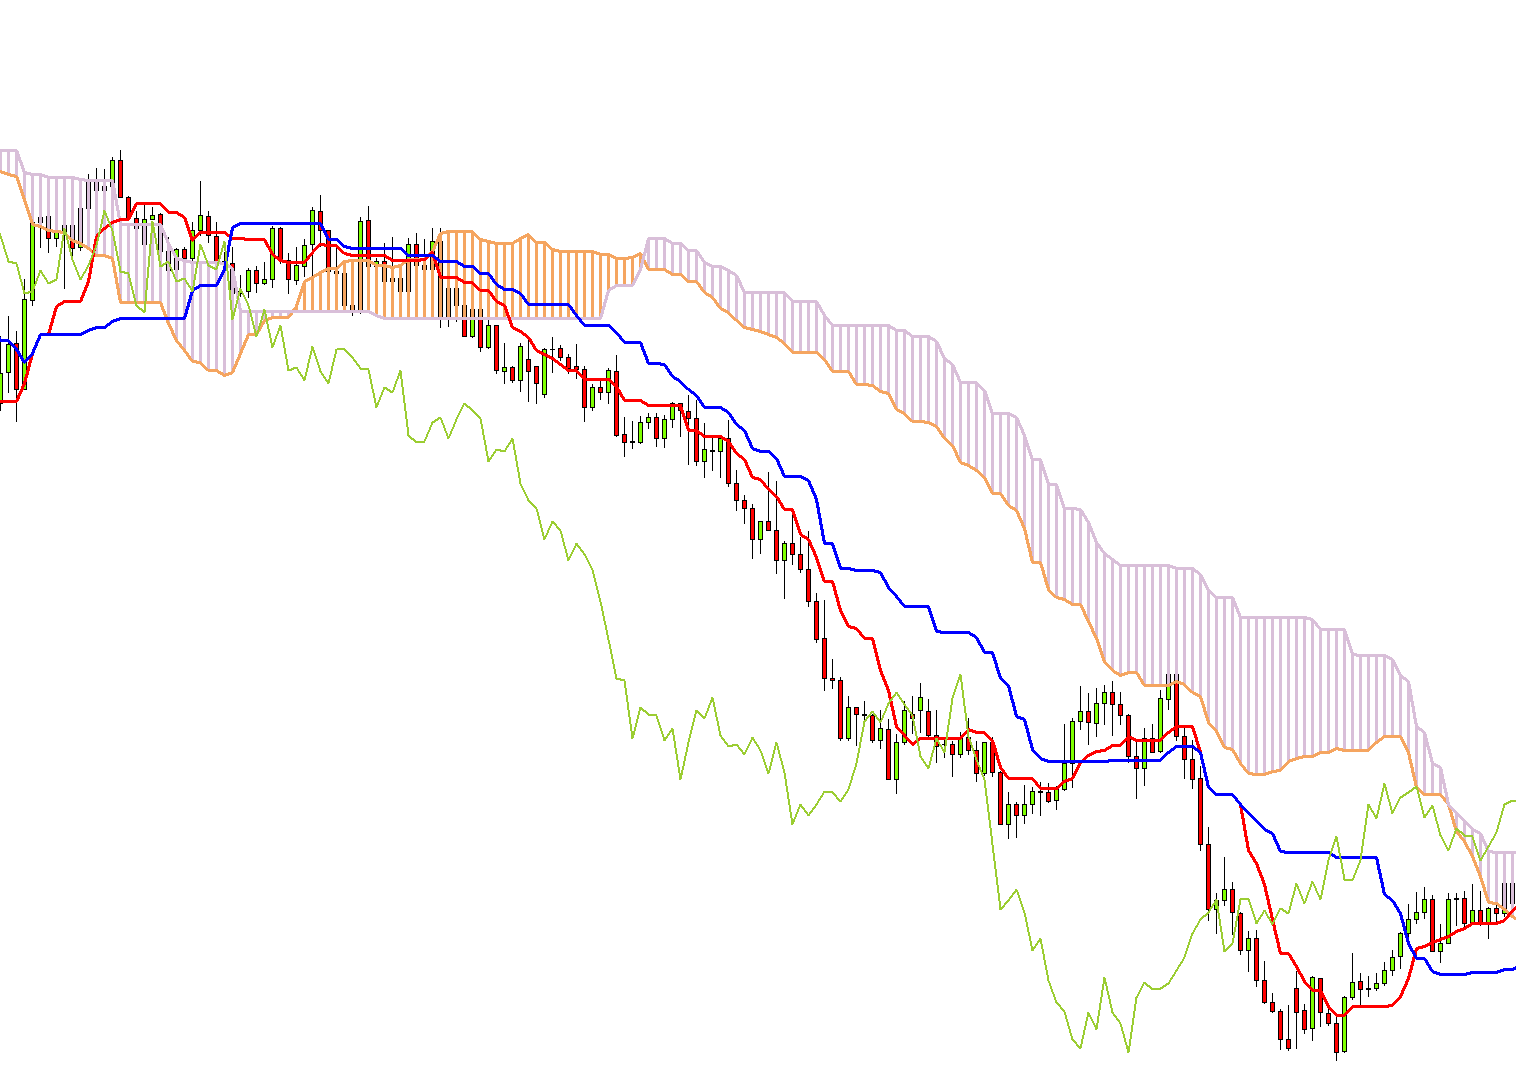
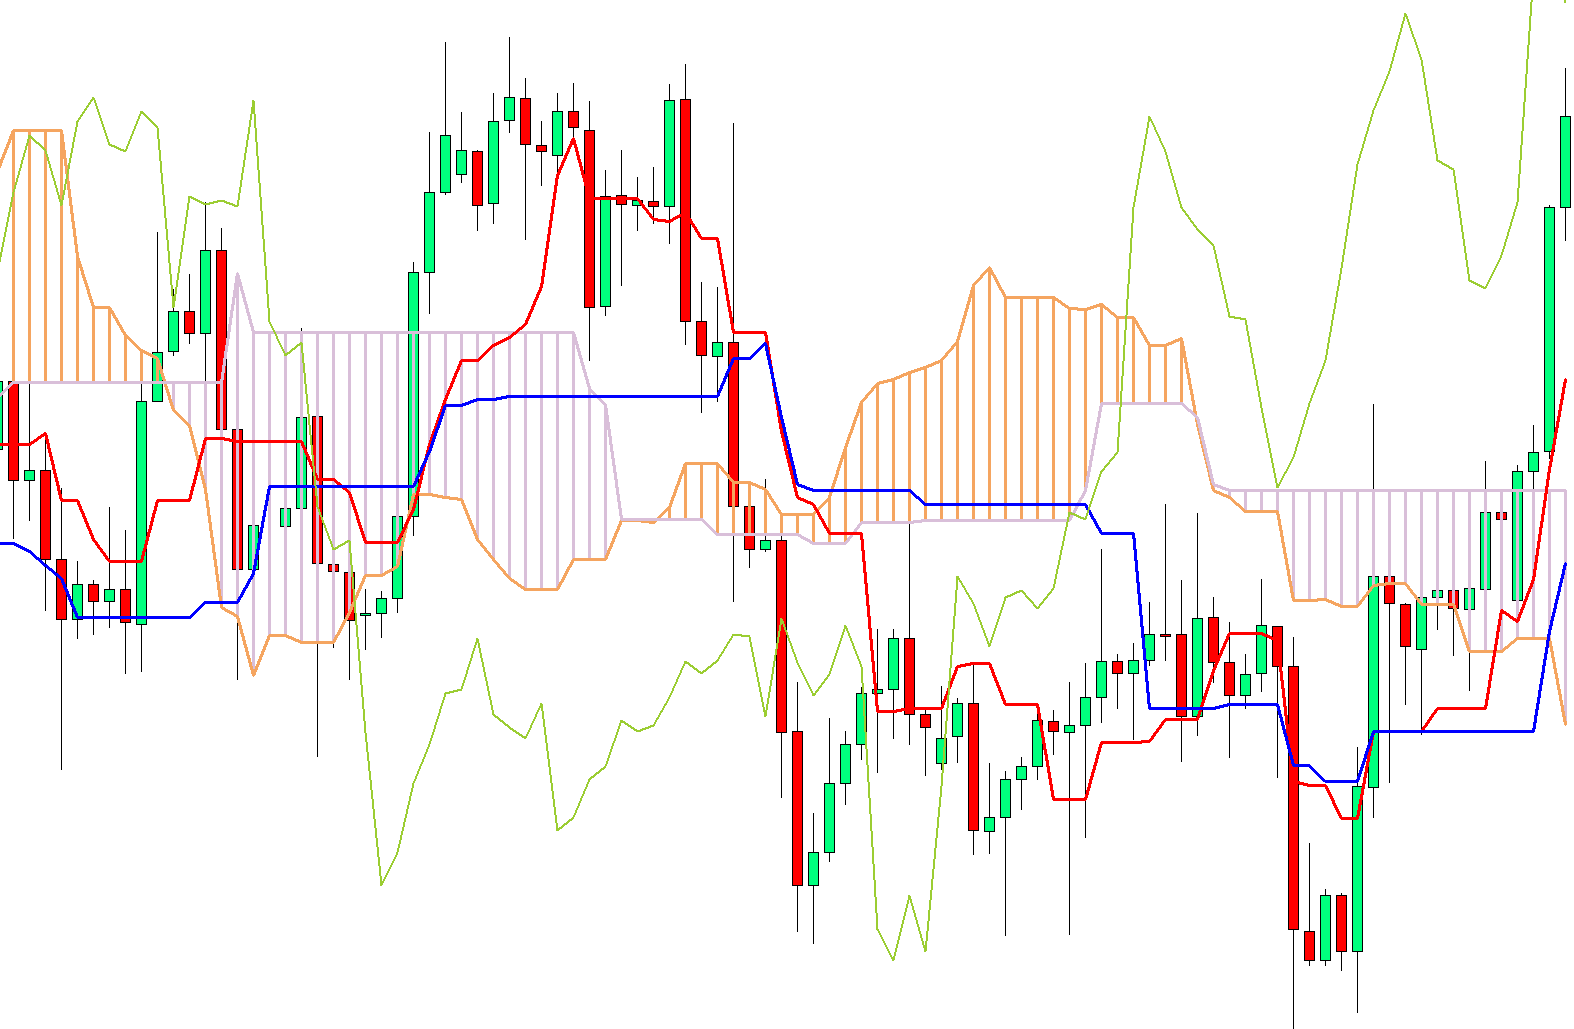
Once the lines are plotted on your chart you will begin to see what are known as ‘clouds’.
As just discussed you will now be able to see the ‘leading span A’ and ‘leading span B’ lines.
When leading span A is below leading span B price is thought to be moving lower with downtrend momentum.
When leading span B is above leading span A the opposite is true and it shows price moving in a trend higher.
You will then be able to see both of these clouds form on your chart.
To quickly view and read the trend using the Ichimoku Kinko Hyo clouds you are looking to see what the clouds look like and where price is.
- If price is above the cloud, price is thought to be bullish and trending higher.
- If price is below the cloud, price is thought to be bearish and trending lower.
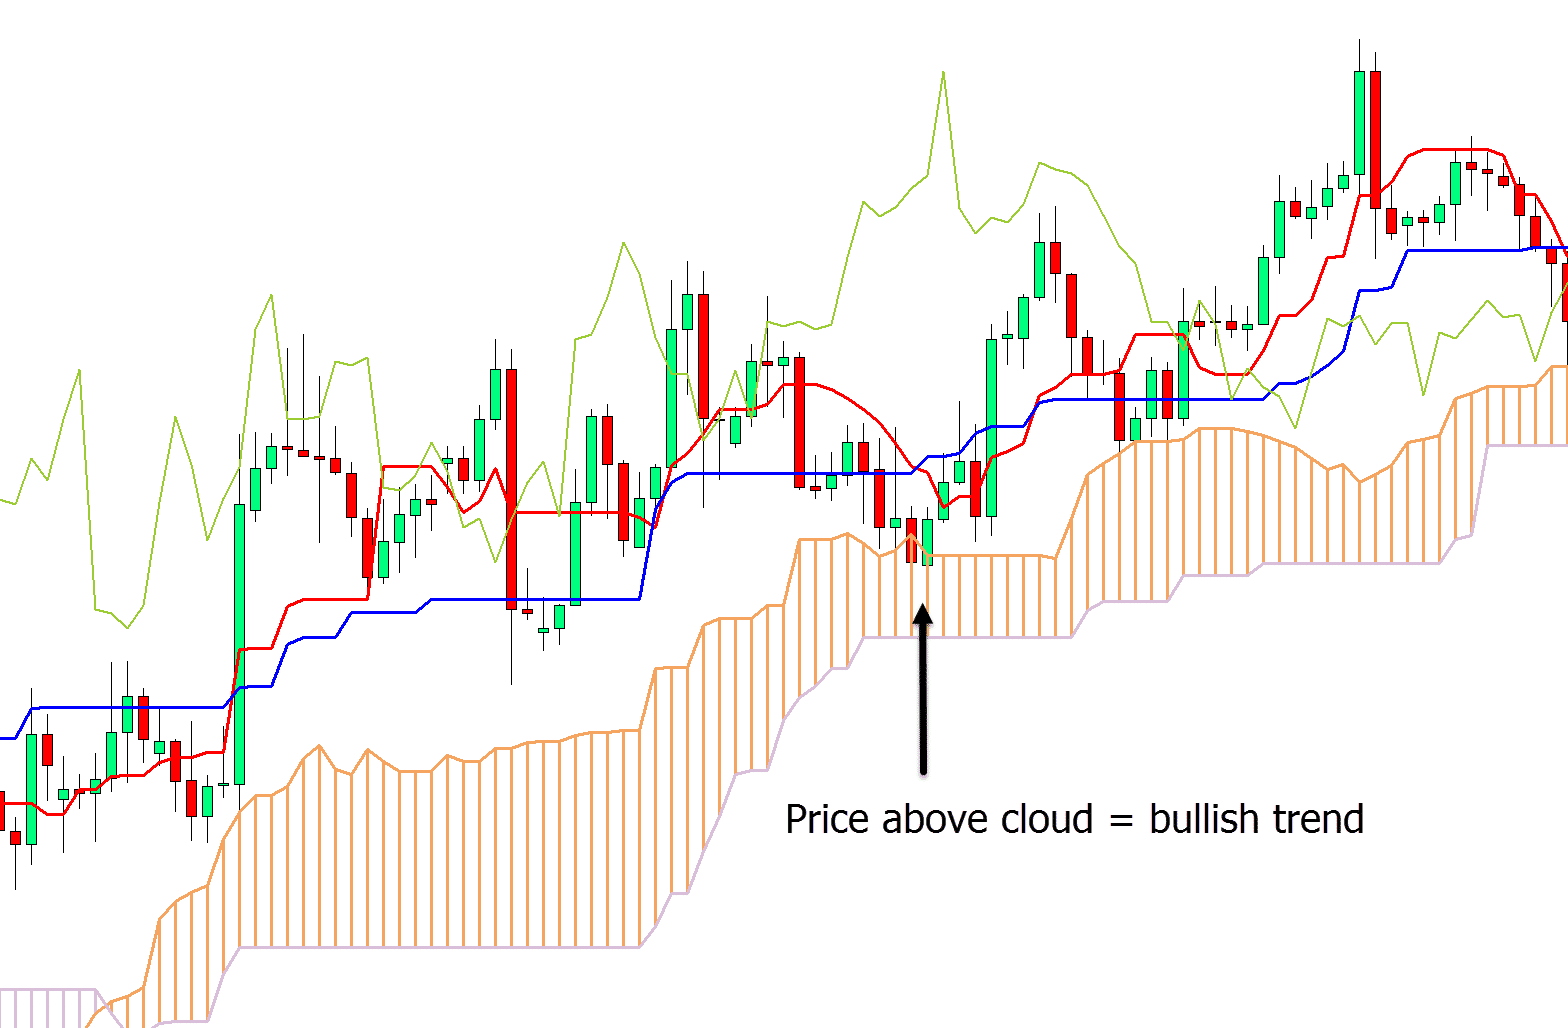
Things to note: You can also tell the strength of the trend and momentum with a quick visual using this indicator.
Things to look for are; how far away is price from the cloud and are the clouds skinny and coming together often?
If the clouds are mixed and coming together often it indicates a ranging market and the chart begins to look like a mess.
The opposite is true if price is in a clear trend with price beginning to move away from the cloud.
Ichimoku Cloud Trading Strategy
Whilst using the Ichimoku Kinko Hyo indicator can help us find and also gauge a trend, it can also help us find potential support and resistance levels for trades.
Using the cloud for potential support and resistance levels at the same time as trading inline with the trend can increase the chances even further of making profits.
Step #1: Find a Clear Trend
Using the same strategies already discussed you are looking for price to be in a clear trend either above or below the cloud and preferably price moving away from the cloud.
Step #2: Look for Pullback Into Cloud Support or Resistance
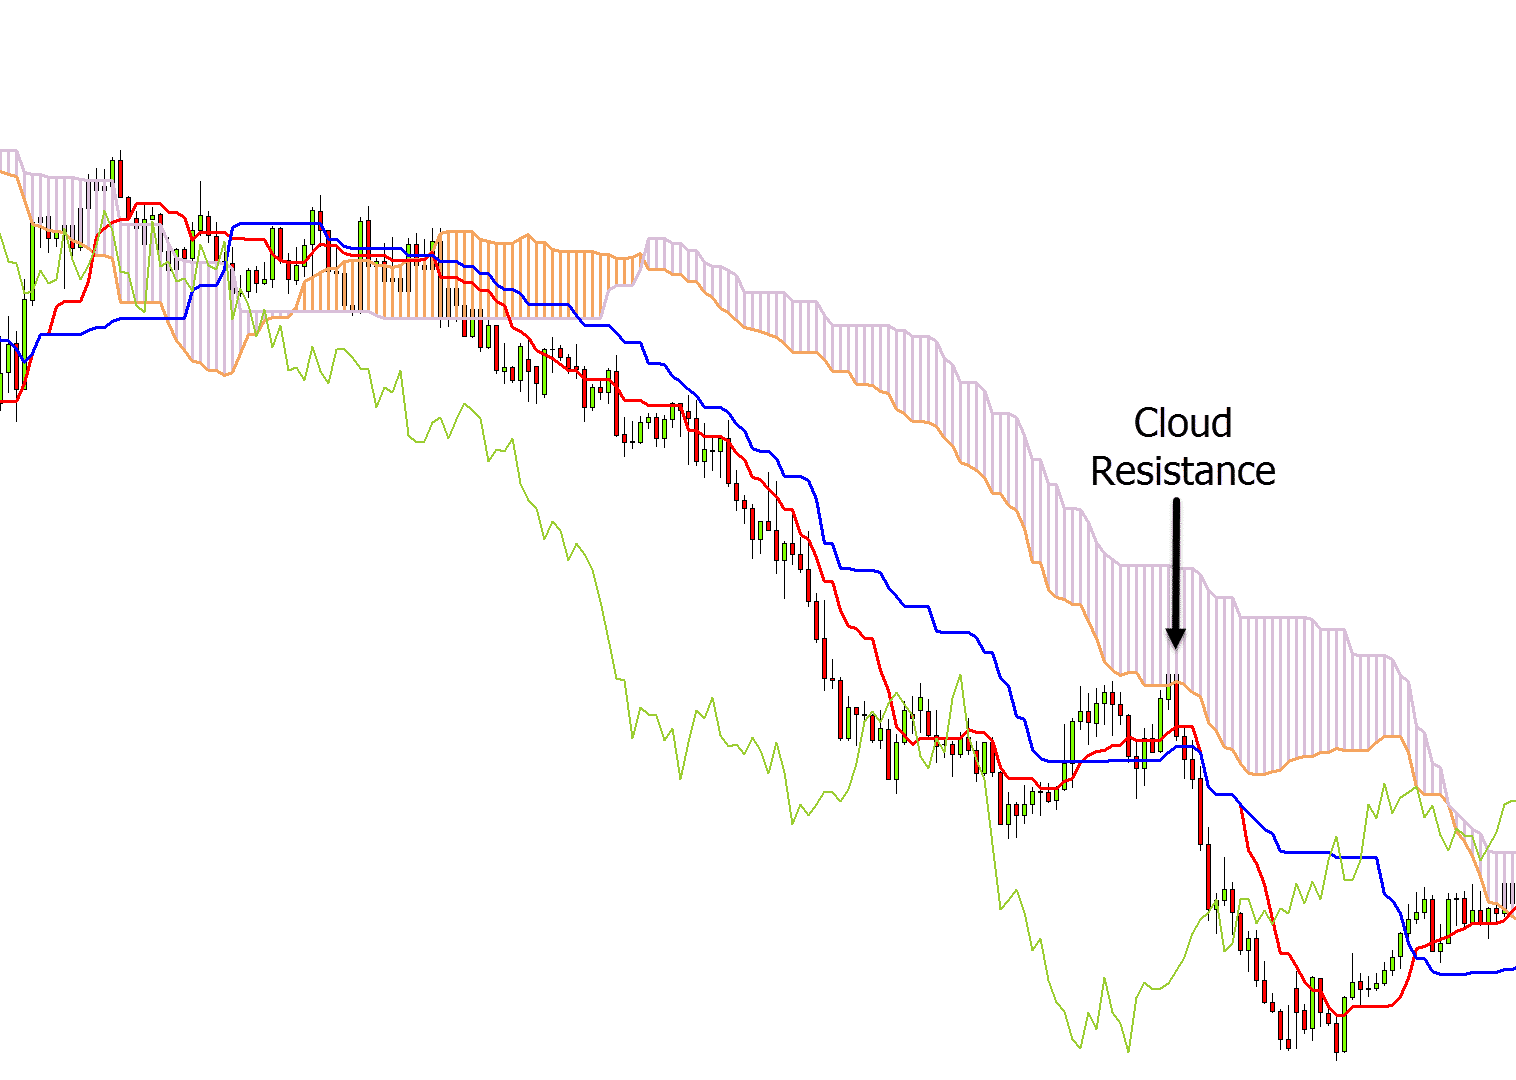
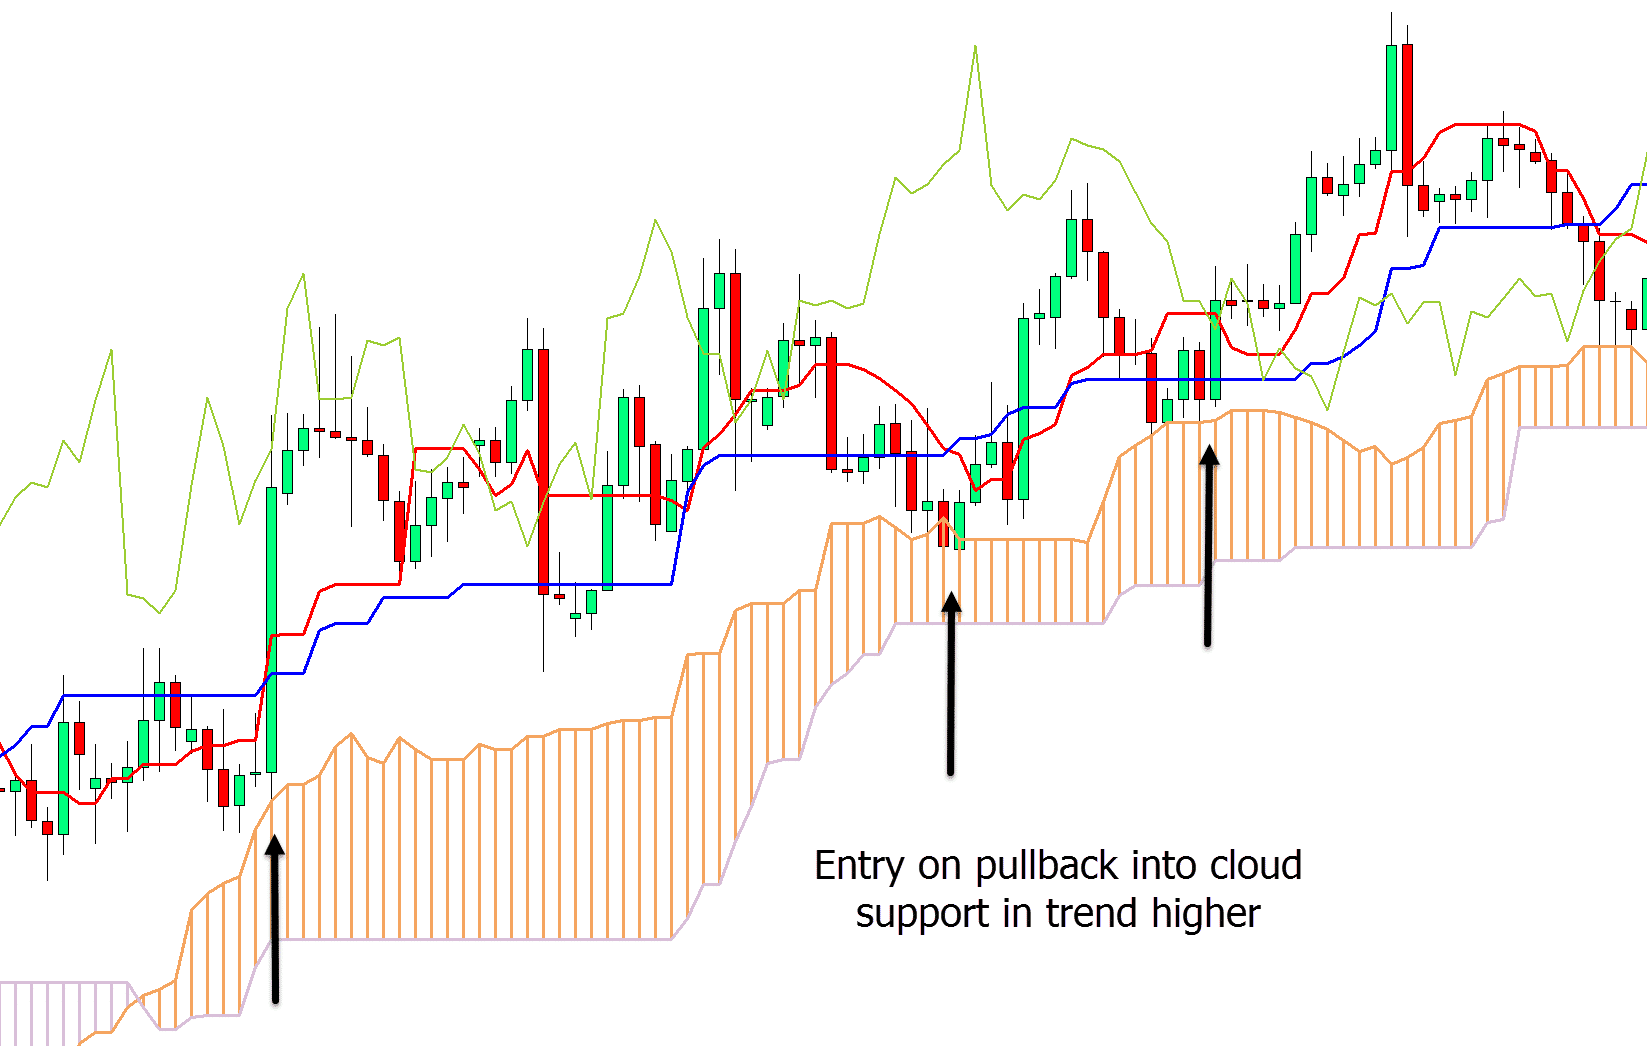
The cloud levels will often act as major levels of support for trades higher when in an uptrend, or resistance when in a trend lower.
If in a trend higher we are looking for price to pullback into the cloud support for a potential long entry.
If in a trend lower we are looking for a pullback higher into the cloud resistance for a potential short trade.
Step #3: Find Entry
Trades can be made ‘blind’ or using confirmation.
Confirmation can always increase your chances of success and make higher probability trades.
Confirmation includes things like using candlestick patterns to pinpoint entry signals that will give you a tighter stop loss and a bigger risk reward.
An example short trade is below. Once price rotates into the resistance of the cloud with the downtrend, a short trade could be triggered.
The opposite is true for a long trade. In the chart below price is in a clear trend higher. Price rotates lower into the clouds support for a potential long trade.
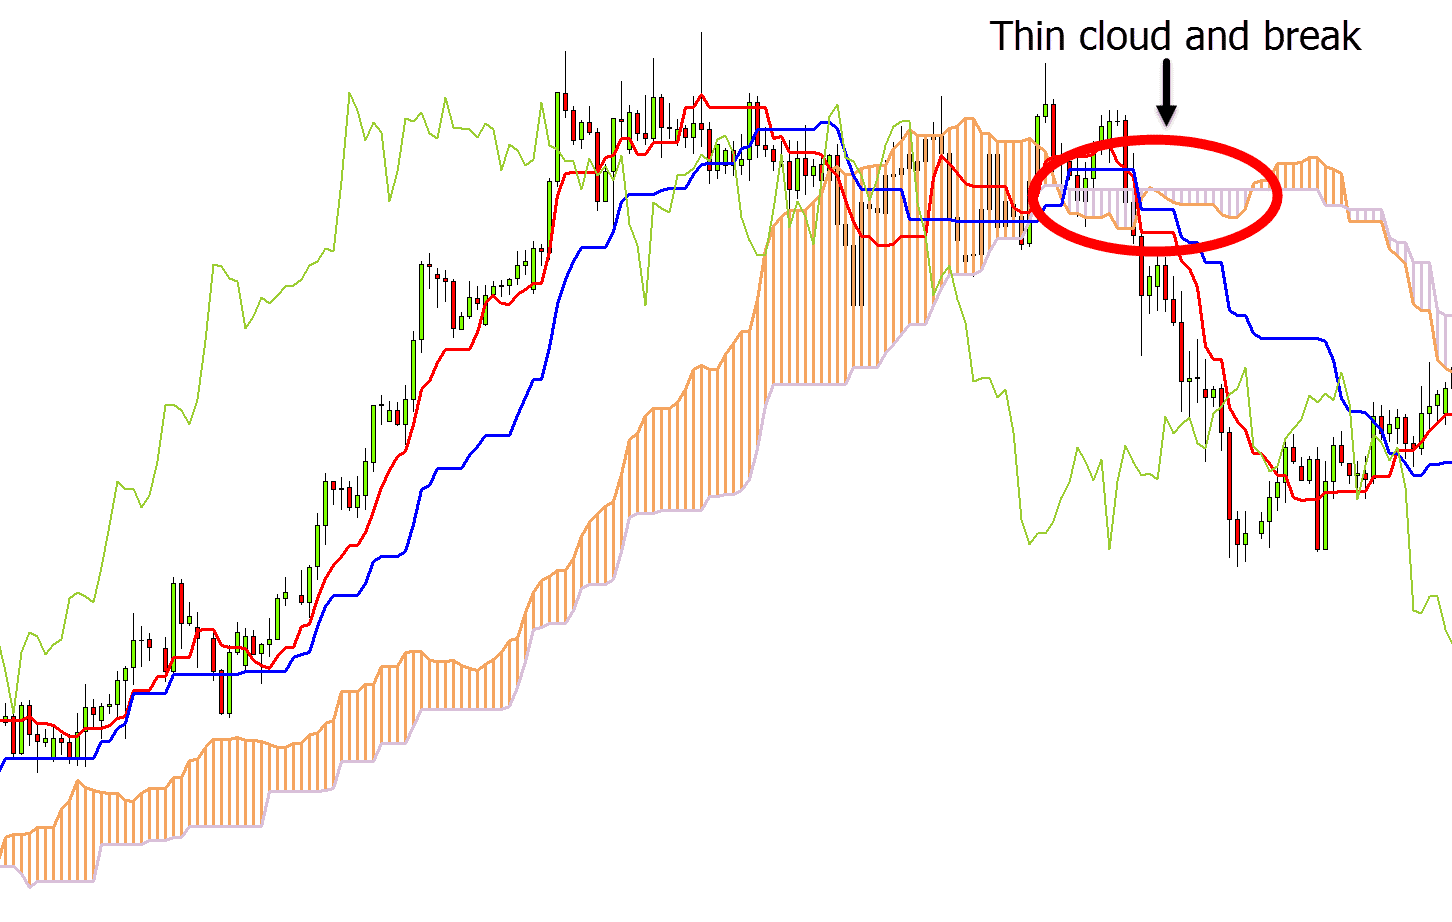
One thing to note with this strategy; be mindful of when the cloud is thin or skinny.
This will often indicate that price is about to break or make a reversal and it is always something you want to take note of.
Ichimoku Kinko Hyo Indicator Alert
A lot of traders want to use the Ichimoku Kinko Hyo indicator, but don’t have the time to constantly monitor it for potential trades.
This is where an alert indicator comes in.
This Ichimoku Kinko Hyo alert indicator for MT4 and MT5 is super handy and allows you to set alerts based on four different strategies.
1. Tenkan-Kijun Cross
2. Kumo Cloud Breakout
3. Chikou-Sen Breakout
4. Kumo Cloud Future Twist
You can read more about and download this indicator here.
Lastly
Whilst to begin with the Ichimoku Kinko Hyo can look overwhelming with all the different levels and clouds plotted on your chart, it really is easy to use.
After a little practice you will get the hang of it quite quickly and find it incredibly effective.
Lastly, this indicator is often best used with confirmation such as Japanese candlesticks, standard support or resistance or your other favorite indicators.
NOTE: Get the Free Ichimoku Kinko Hyo Trading PDF Download Below.
