The opening range breakout trading strategy is a strategy that can be used in many different markets and time frames.
You can use this strategy in markets from Forex through to stocks, and you can also style it to suit many time frames.
This post goes through exactly what the opening range breakout is and how you can use it to find and manage your trades.
NOTE: You can get your free opening range breakout trading strategy PDF guide download below.
Table of Contents
What is the Opening Range?
The opening range is the high and low that price reaches over a certain period of time after a market has opened.
The most commonly used time frames for the opening range breakout are the 30 minute and 15 minute opening range. However, other traders will use longer opening range periods, such as the 1 hour time frame.
The most common way the opening range strategy is used is straight after a new daily session. For example, if trading an individual stock, we would be looking to see the opening range in the first 15 or 30 minutes when the markets open.
With the Forex market, you have a few more options to use the opening range strategy. As well as having a daily open each day, Forex also has different sessions. For example, there are the UK, US, and Asian sessions. A lot of traders will look to trade the opening range breakout using these session times.
The idea of the opening range strategy is to gauge where the market may be going for the rest of the session. If we can see the price break the opening range higher, then we are going to be looking for the price to move higher during that session. If we see the opening range get broken lower, we will be looking for a move to the downside.
Daily Opening Range Breakout
The daily session and candle are critical to the opening range breakout trading strategy, especially when trading markets other than Forex.
When the daily candle closes and a new candle begins forming, we get to see the start of the new opening range.
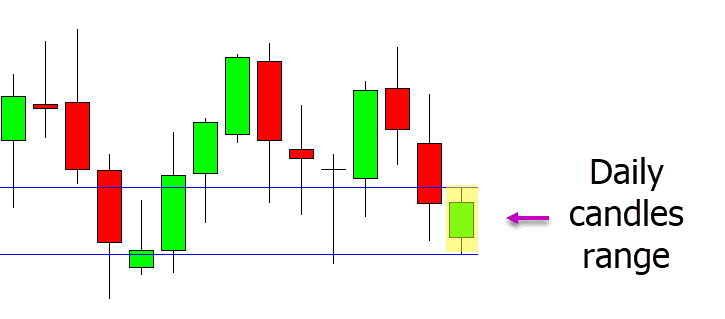
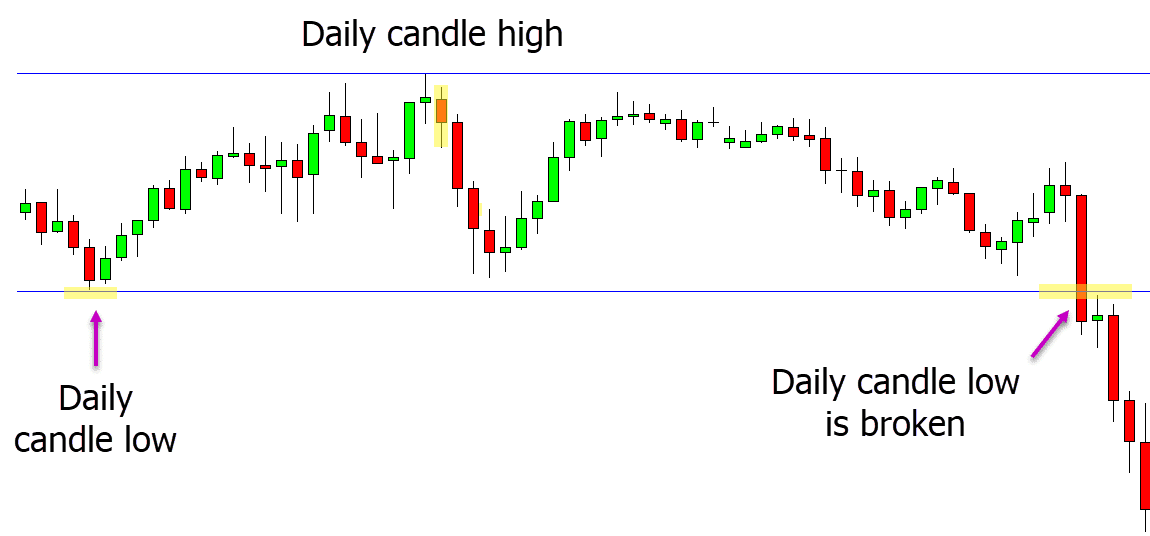
In the example below, we can see the daily charts candle has just finished forming, and we can see the clear daily high and low.
If we were to move to a smaller chart, for example, a 15 minute time frame, we would see the start of the opening range forming.
15 Minute Opening Range Breakout
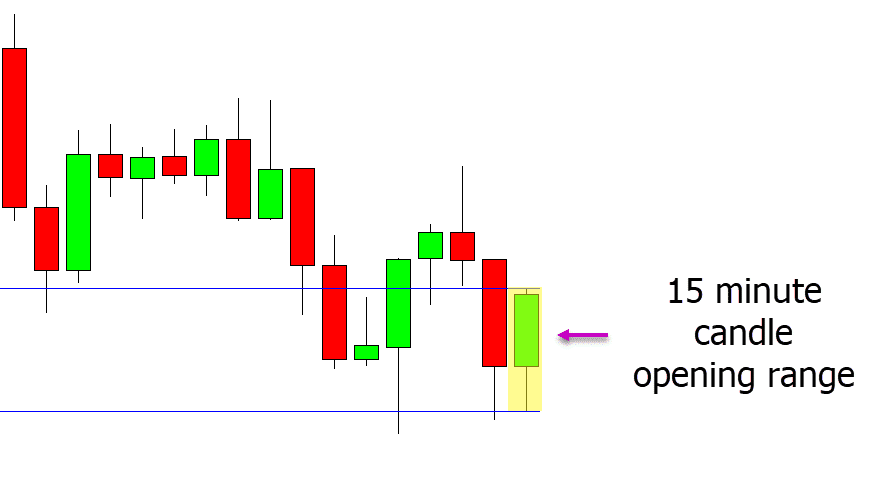
In the example below, the price has just formed the first 15 minute candle of the day.
This candle is the opening range that has just formed for the new session. One thing to keep in mind is that the longer the time frame used for the opening range, the more weight the signals will have.
For example, if we are using a 1 hour chart for our opening range strategy, it will have more weight than the 15 minute opening range.
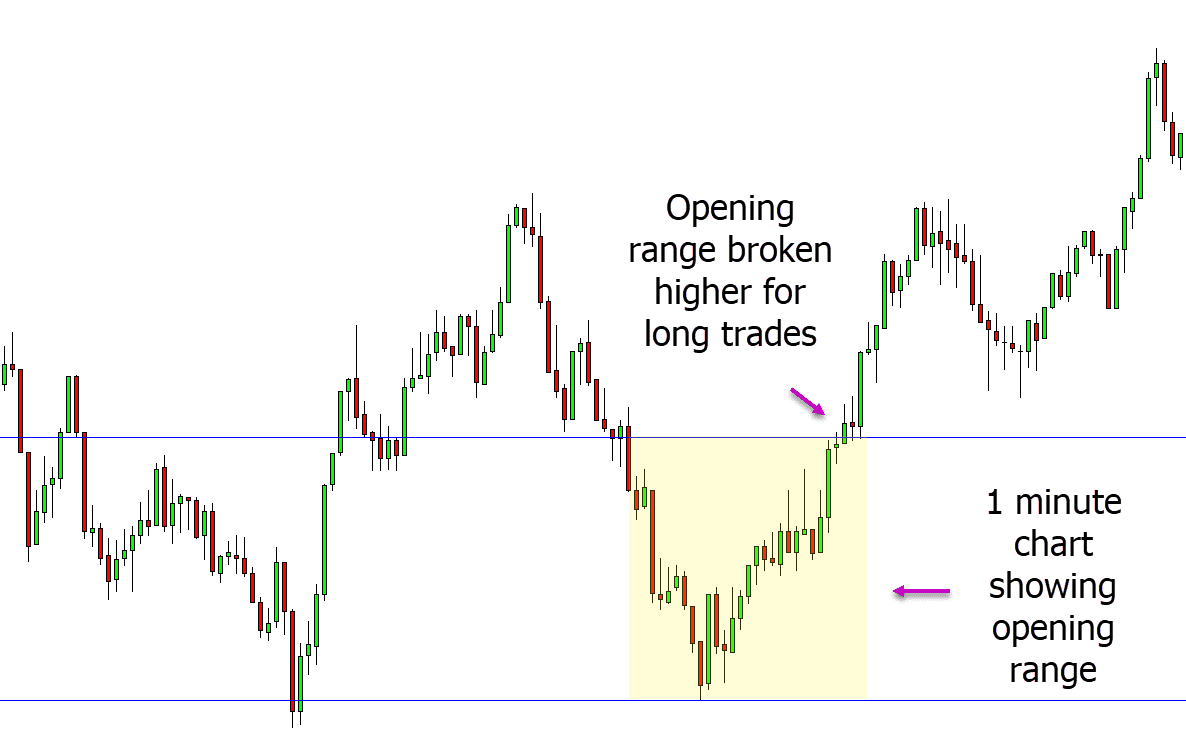
In the example chart below, we have the same opening range as the 15 minute chart above; however, it is the one minute chart in this example. The one minute chart shows us a little more clearly what has happened over this 15 minute period opening range.
To look for trades, we are looking to see how this 15 minute opening range will break.
In this example, the price breaks the opening range higher, and we can look for long trades.
Opening Range Breakout Strategy
In the example below, we are using the 30 minute chart for our opening range breakout strategy.
As you can see on the chart, the first 30 minute candle that forms in the new daily session is the opening range.
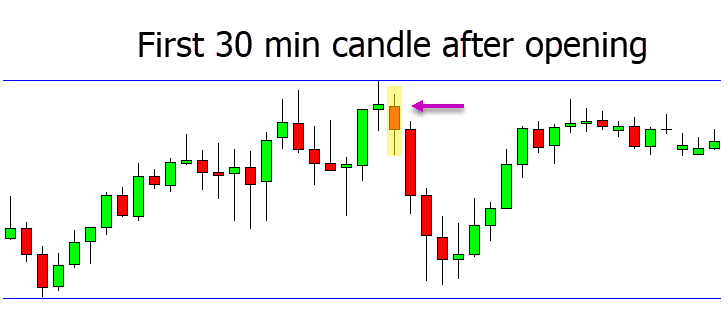
Aggressive traders could take short trades as this 30 minute opening range is broken lower and ride any move lower throughout the next daily session.
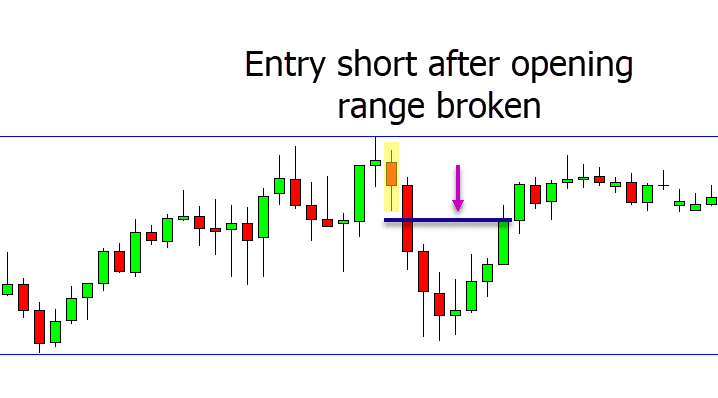
More conservative traders could be watching the daily highs and lows as well as the opening range. In the example below, we have the same chart, but we have also shown how the more conservative trader may wait until the low of the previous daily session has been broken lower before entering their short trades.
Opening Range Breakout Indicator
With so many different Forex pairs, thousands of stocks, and other markets like cryptocurrencies and Gold, it can be hard to monitor all of the different markets for opening range breakout setups.
An indicator can quickly help you spot when an opening range is breaking out for potential trades.
The opening range breakout indicator for MT4 we discuss here will plot two opening range breakout lines to help you quickly identify any potential trades.
Opening Range Breakout Scanner
Whilst an opening range indicator is useful, a scanner or expert advisor that places these sorts of trades for you is even better.
The opening range breakout scanner we discuss here will scan the markets looking for potential opening range breakout trades that fit your settings.
You have the ability to choose how you want the entry, stop loss, and profit targets to be set, and they can be customized to suit your needs.
This is not a free expert advisor, but it does come with a free demo you can test to see if you like it.
NOTE: You can get your free opening range breakout trading strategy PDF guide download below.
