The Parabolic SAR, or PSAR, as it is commonly called, is one of the most straightforward indicators you can learn to use.
The parabolic SAR indicator gives you clear buy and sell signals, but it also can help you place your profit and stop losses.
This post explains precisely what the Parabolic SAR indicator is and how to use it in your MT4 and MT5 charts for free.
NOTE: Want a full list of some of the very best free MT4 and MT5 indicators you can use in your trading? You can get them below.
Table of Contents
What is the Parabolic SAR Indicator
Famed trader J. Welles Wilder created the Parabolic SAR indicator.
This is a trend trading indicator that can help you find potential reversals.
The PSAR can help you find clear buy and sell signals and potential places to put your profit targets and stop losses.
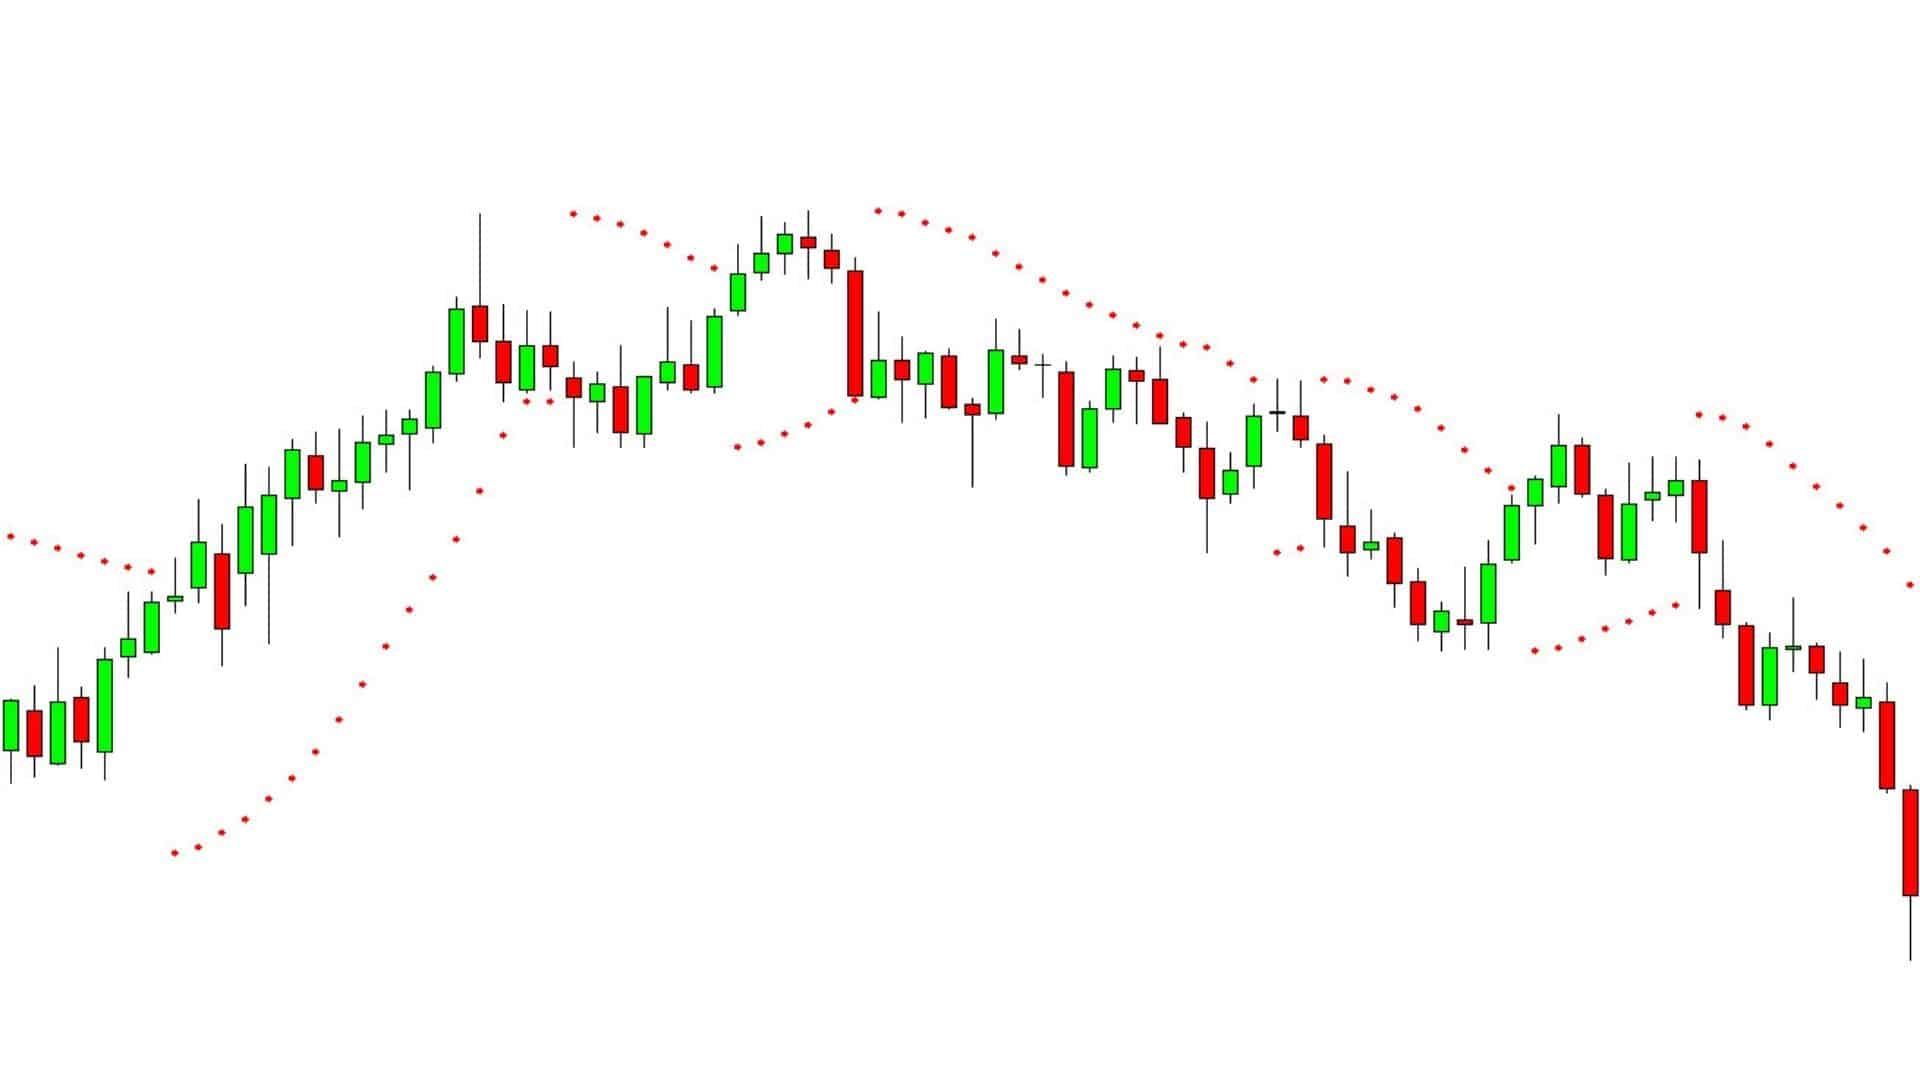
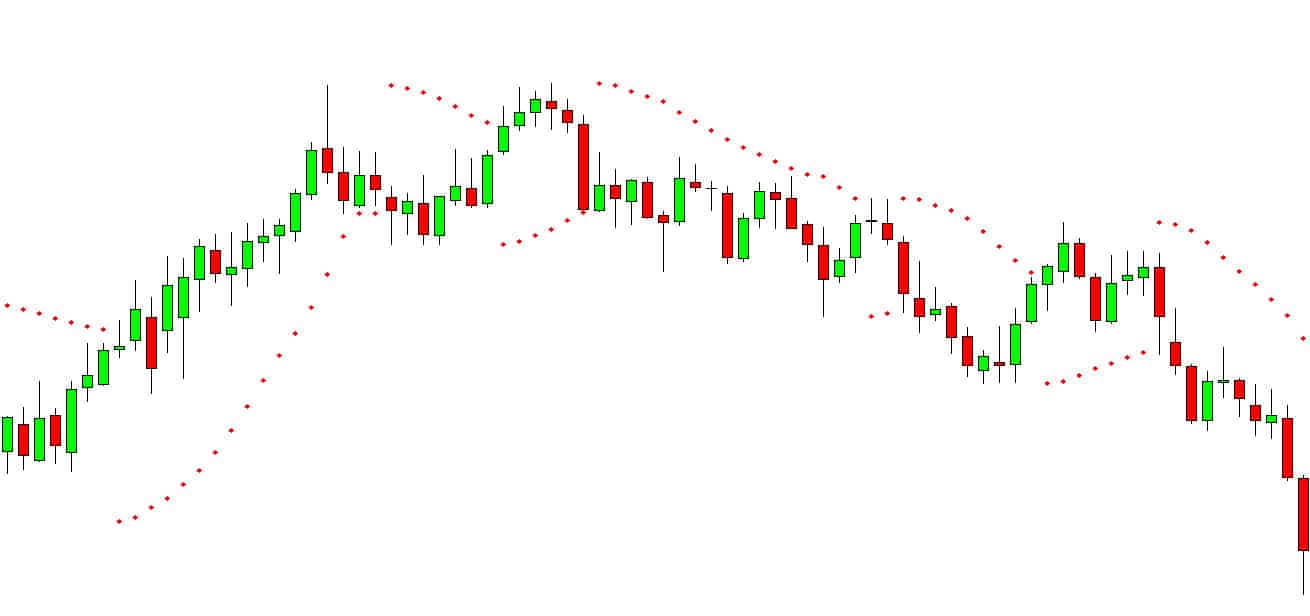
When you have added this indicator to your chart, you will be given a series of dots.
Depending on what the dots are showing you, you will be able to find new reversal trades, or you can use them to manage any open trades.
When these dots are below the price, it is thought that the price is trending higher. On the other hand, when the dots are above price, it is believed that the price is trending lower.
The critical thing to look for with this indicator is when the dots change from above to below price or vice versa.
Parabolic SAR Indicator Trading Strategies
To find new buy and sell signals with the parabolic SAR indicator, you need to monitor when the dots either cross from below price to above it or vice versa,
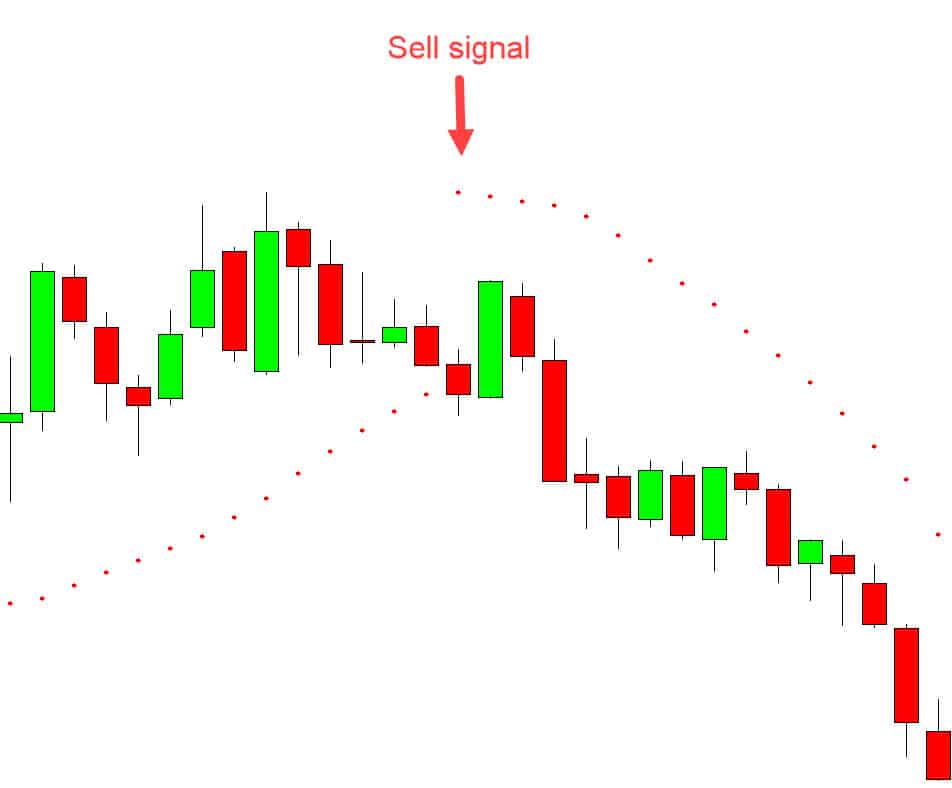
For example, if the price is trending higher with the dots below the price and then suddenly the dots move above the price, this could be seen as a potential sell trade with the price looking to reverse lower.
The opposite is valid for a buy signal. For example, if the price is trending lower with the dots above the price, and then suddenly the dots move below the price, this could be seen as a potential buy signal.
Check out the example chart below. Price is trending higher with the dots below the price. When the dots move above the price, this could be the moment to look for potential short trades.
The other way you can use this indicator is to place stop losses and profit targets.
The first way you could use it is to set profit targets. If we were long when the dots moved from below to above the price in the example chart above, we could start to look to take profit as this is hinting at the price moving lower against our long trades.
The other way you can use it is to use a trailing stop.
If we took a short trade when the dots moved from below to above the price in the example chart above, we could then start using these dots to have a trending higher. As the dots kept moving lower, we could continually move our stop loss lower just above these dots. This would then protect any significant losses while at the same time locking in profits as the price moves lower in our direction.
Parabolic SAR Indicator for MT4
The parabolic SAR indicator is built directly into your MT4 charts.
To add this indicator to your charts and start using it, follow these instructions;
- Open your MT4 charts.
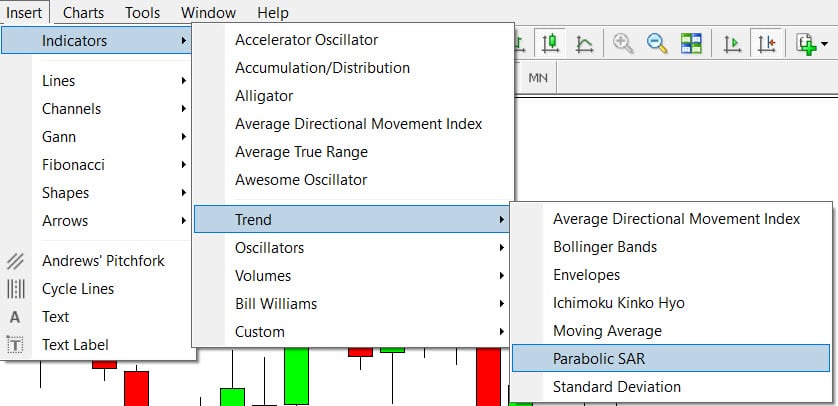
- Select “Indicators” >> “Trend” >> and then “Parabolic SAR”.
- You will then be given a box popup where you can change settings such as the color.
- After selecting “Ok,” the PSAR will be added to your charts with the indicators dots.
See the image below of how to do this in your MT4 charts.
Parabolic SAR Indicator for MT5
The MT5 parabolic indicator is very similar to the MT4 version.
To add this indicator to your charts and start using it in your MT5 charts, follow these instructions;
- Open your MT5 charts.
- Select “Indicators” >> “Trend” >> and then “Parabolic SAR”.
- You will then be given a box popup where you can change settings such as the color.
- After selecting “Ok,” the PSAR will be added to your charts with the indicators dots.
Lastly
The parabolic SAR indicator is a straightforward and easy-to-use indicator to add to your trading toolbox.
Not only can it give you buy and sell signals, but you can also use it to place your profit targets and set trailing stop loss points.
As with any indicator, it is essential that you first test it on a demo or virtual money account to perfect it before risking any real money.
