The pin bar is one of the most popular reversal Japanese candlestick patterns. You can use a pin bar on all of your different time frames and it can be traded across many different markets making it a very flexible trading strategy.
This candlestick is a reversal pattern and it can often help you find when a new swing either higher or lower is about to occur.
In this post we look at exactly what the pin bar is and how you can use it to start making trades.
NOTE: You can get your free pin bar trading strategy PDF guide download below.
Table of Contents
What is a Pin Bar Candlestick Pattern?
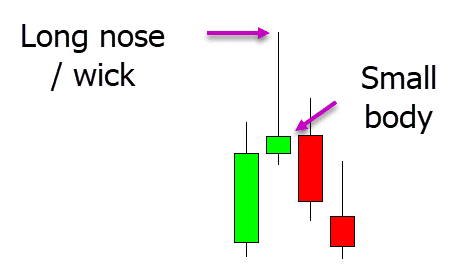
A pin bar is a candlestick that has a very large nose or candlestick wick with a small real body.
This pattern can be bullish or bearish depending on how it is formed within the price action.
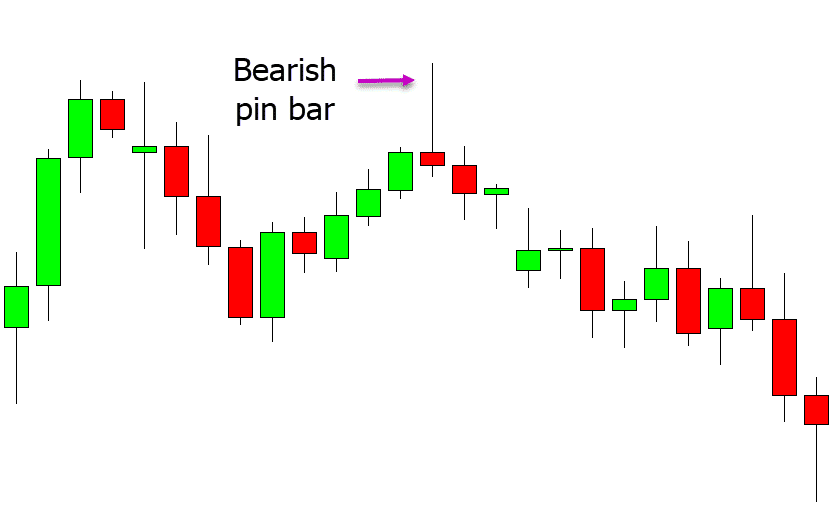
The example below shows a bearish pin bar. The pin bar is formed with price trying to break higher. During the same session the bears take control and send price back lower with a reversal. This is why the large candlestick wick is created. This shows us that higher prices were rejected and the bears were able to regain control after the initial break higher.
The pin bar is a reversal candlestick pattern that can lead to overall market reversals.
The key to high quality pin bars is where they form. As we discuss more below, the best pin bars are found at important market levels or within obvious trends.
What are the Best Markets to Trade the Pin Bar?
The best markets to trade the pin bar strategy are markets where price has a solid amount of volatility. The more price movement and volatility, the more opportunities you will have to trade the pin bar and also the bigger potential for large winning trades.
Markets such as individual stocks that can often have large gaps are not ideal for the pin bar.
The best markets are fast and free flowing markets such as Forex, the popular Cryptocurrencies, Gold and Silver.
Bullish Pin Bar in Uptrend
Some of the highest quality pin bars you will trade are when there is an obvious trend playing out.
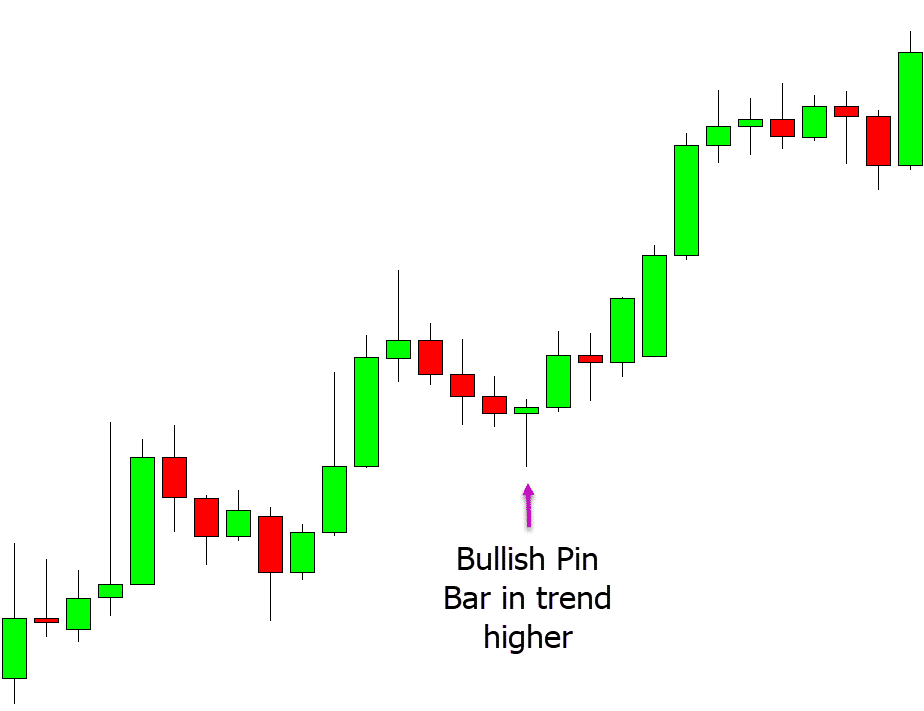
In the example below price is moving in a clear trend higher. We can see from the price action that price is making regular higher highs and higher lows within this trend higher.
For a bullish pin bar we want to see it form at one of these swing lows within the trend. The reason for that is because the pin bar is a reversal signal and we are looking to enter the bullish pin bar and make a profit as price reverses back higher with the trend.
In this example price forms the bullish pin bar at the swing low within the trend higher. We could then enter straight after the pin bar has finished forming or we could use confirmation.
A confirmation type of entry is where we are looking for price to break higher and above the pin bar high and when we see that we enter to go long. We could do this manually or with a pending buy stop order.
Bearish Pin Bar Setup
As mentioned, the pin bar can be both bullish or bearish depending on where and how it forms within the price action.
The example below is a bearish pin bar.
The difference between the bullish and bearish pin bar is that the bullish pin bar has a wick rejecting lower prices and the bearish pin bar has a wick rejecting higher prices.
The other great time you will find high probability trades with this candlestick is when it is rejecting a level in the market that is of importance. These will often be key support or resistance levels or dynamic moving averages.
In the example below, price moves higher into a key resistance level. We can then see price rejects this level and forms the bearish pin bar. This is our clue that the resistance level has held and price may now be looking to sell off back lower.
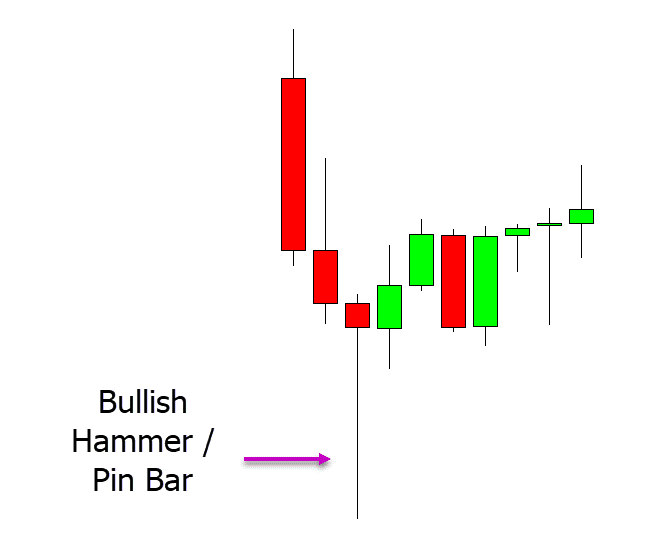
Pin Bar vs Hammer
Whilst these two patterns can often be confused, they are often the same with one key difference. Where the pin bar can be both a bullish or bearish reversal signal depending on how and where it forms, the hammer is a bullish reversal pattern that always forms at a swing low.
The example below shows how the hammer candlestick pattern forms at a swing low. Some traders will not call this a hammer and will instead call it a bullish pin bar. Both traders are correct, they are just different names for the same pattern.
How to Trade the Pin Bar Strategy
One of the simplest and most effective ways to start stacking the odds in your favour is to trade inline with the obvious trend.
This works exactly the same way when using the pin bar trading strategy.
When trading with the clear market trend you are trading with the current flow and not trying to push against it or pick the market top or bottom.
The trick when using the pin bar and trend trading is to look to enter from areas of value and important swing points.
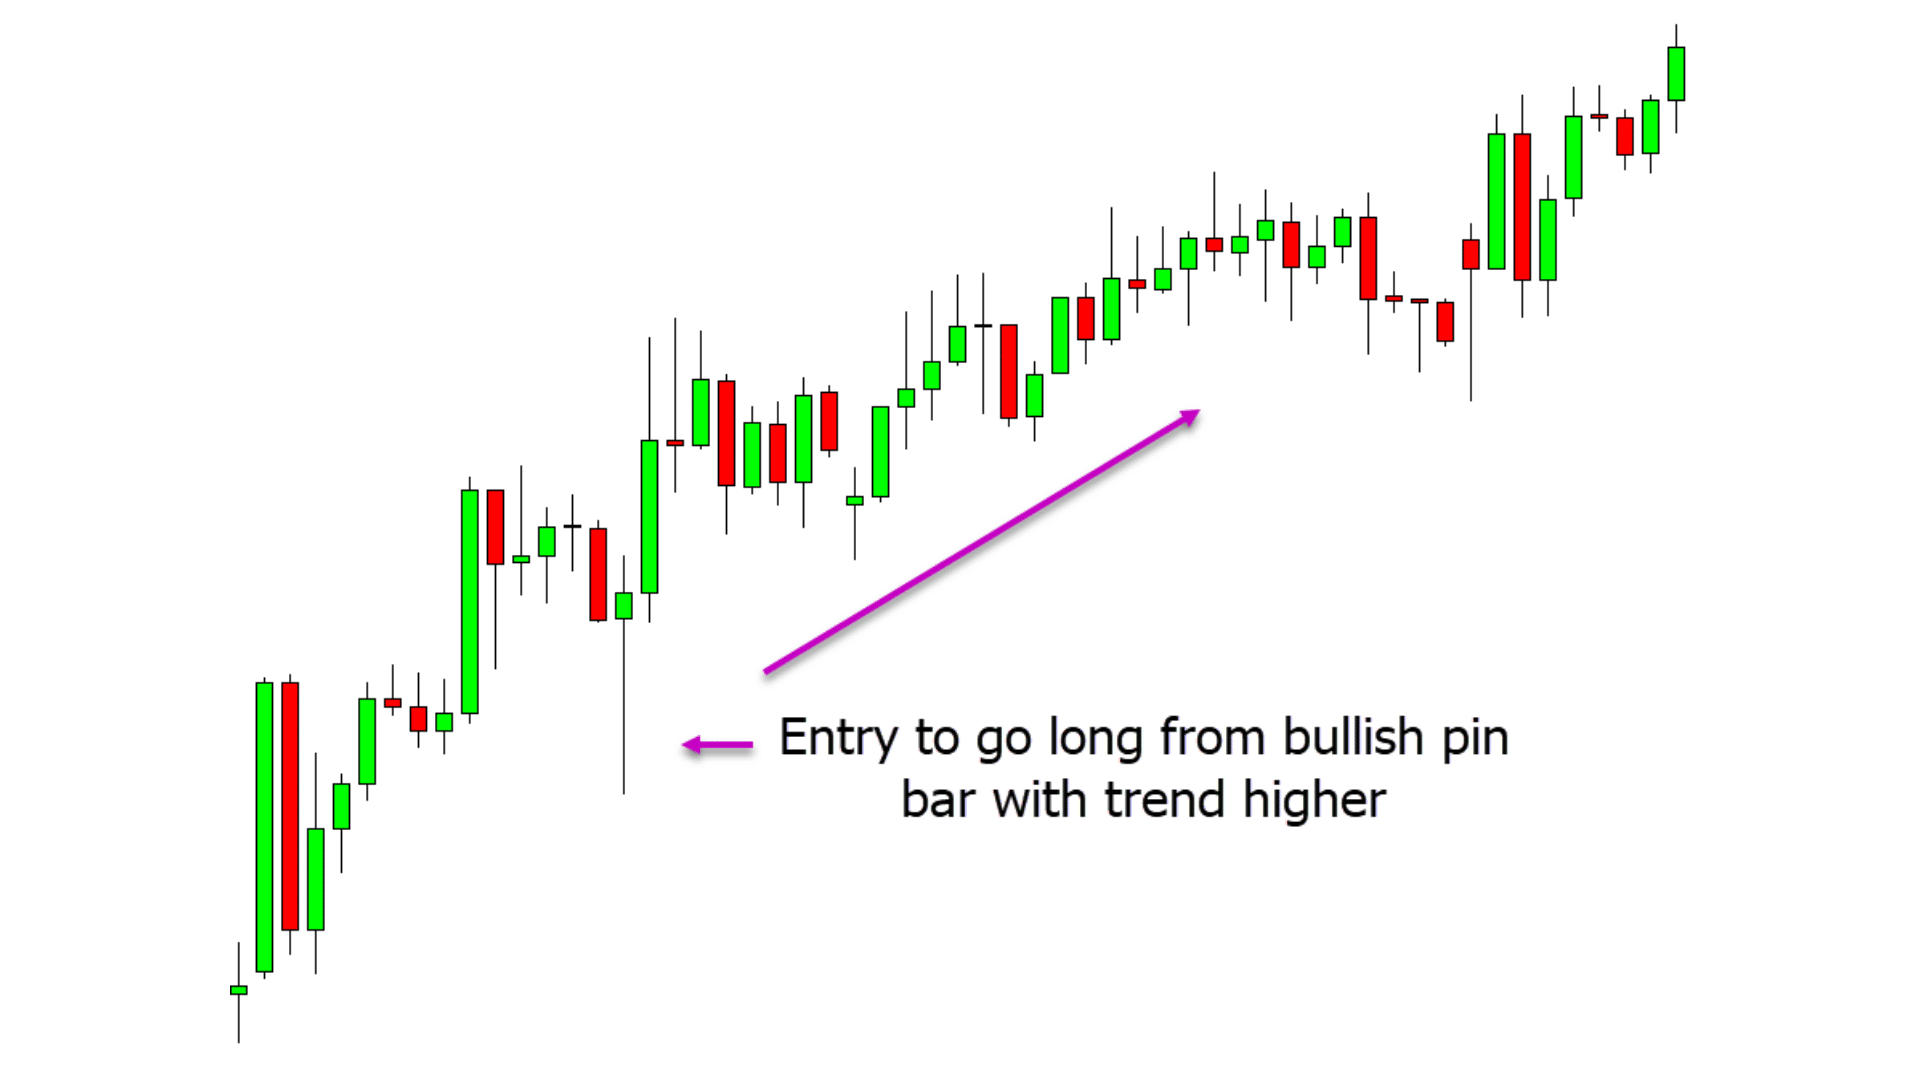
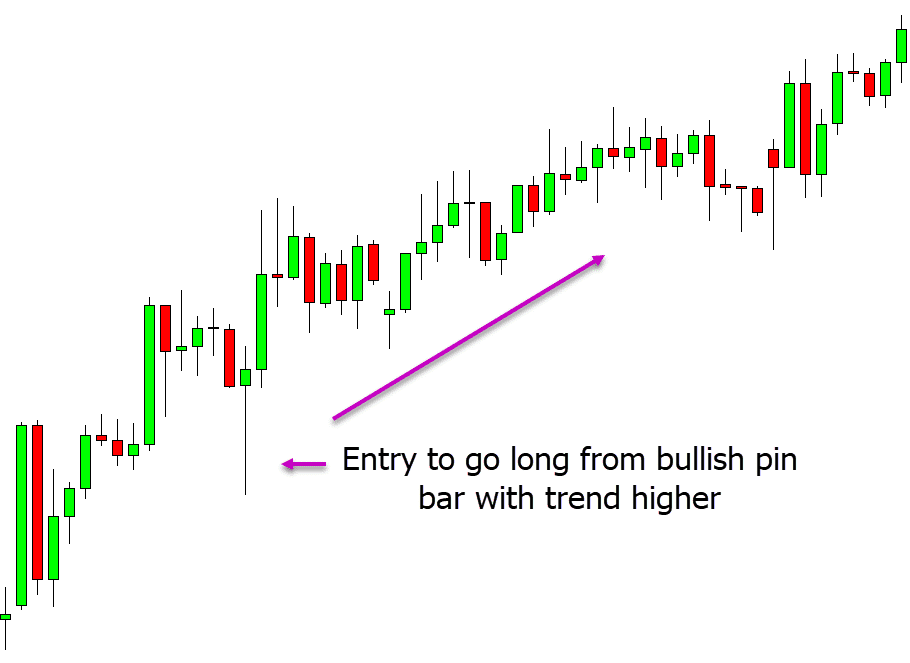
In the example below price is in a clear trend higher and so we start to look for a bullish pin bar to get long.
When price makes a small swing lower into a value area and then forms a bullish pin bar reversal candlestick we could look to enter long trades. We could either go long as soon as the pin bar has formed or set a pending buy stop to enter when price breaks above the pin bars high.
Using a Pin Bar Indicator
Pin bar candlestick patterns form often and depending on how many time frames and markets you are trading, it can be very hard to keep an eye out for all of them.
One of the best ways to make sure you don’t miss any quality pin bar trades is to use an indicator that will highlight them on your charts for you in real time and also send you an alert.
There are a few quality pin bar indicators you can download and use for free in MT4 and MT5 that will make sure you don’t miss out on any of these trades.
NOTE: You can get your free pin bar trading strategy PDF guide download below.
NOTE: You can get your free pin bar trading strategy PDF guide download below.
