
The hammer candlestick pattern is a bullish candlestick that is found at a swing low.
The hammer signals that price may be about to make a reversal back higher after a recent swing lower.
In this post we look at exactly what the hammer candlestick pattern is and how you can use it in your trading.
Table of Contents
How to Identify a Hammer Candlestick Chart Pattern
The hammer is very easy to identify on your charts.
You find this one candlestick pattern on all time frames and in many different markets.
To identify a hammer you need to look for;
- A long lower candle wick
- A smaller upper body
- Price closing in the top ¼ of the candlesticks range
Below is an example of a hammer candlestick. Note the small upper body and long lower tail or candlestick wick.
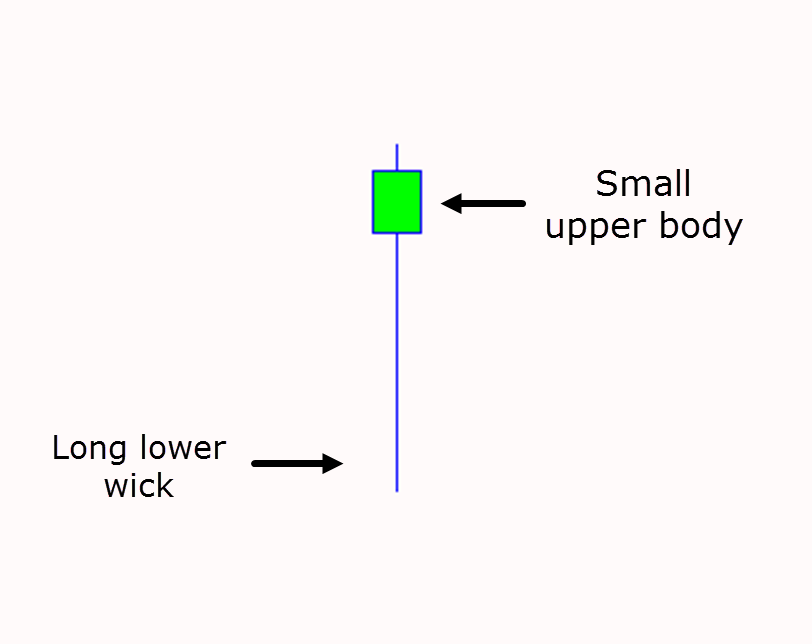
Example of Hammer Candlestick Pattern
The chart below is an example of a hammer pattern.
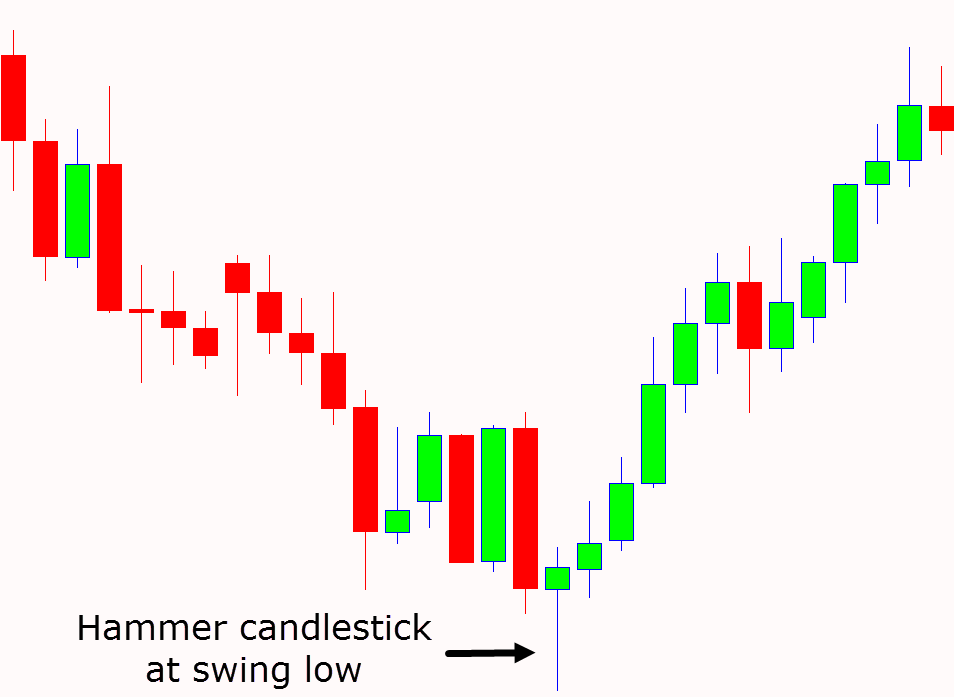
This example also shows where the hammer should form for it to be a valid signal.
For a correct hammer signal price needs to first be making a move lower before the hammer is formed.
After price moves lower and into a swing low, the hammer forms and shows that there is a chance of a reversal back higher with the bulls taking control.
NOTE: You may also like the Marubozu pattern.
What Does a Hammer Signal?
It is important to understand why the hammer candlestick is formed in the first place and how it is created.
Understanding this will help you filter out the false trade signals and weaker setups.
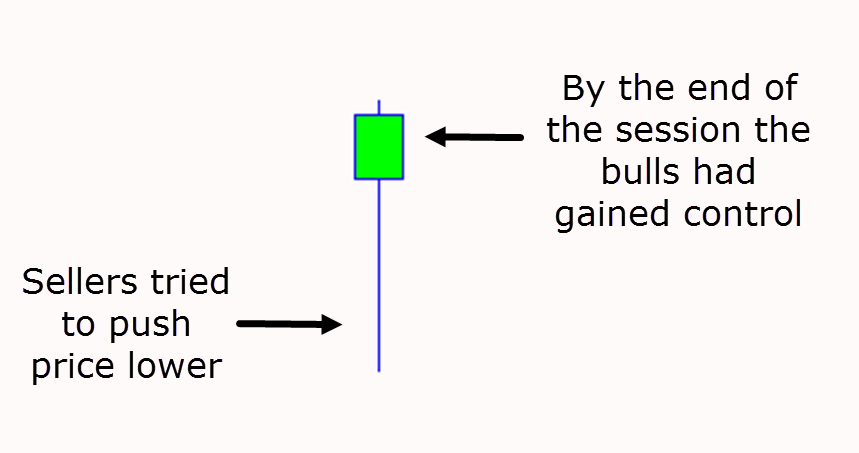
When forming the hammer price makes a solid move lower. This shows that the sellers are trying to push prices lower.
During the same session price snaps back higher. This shows us that whilst at the start of the session the sellers were in control, by the end of the session the buyers had taken over and pushed price back higher.
This is why the hammer pattern is a bullish reversal signal. It shows that price is reversing from being in the seller’s control to now being in the buyer’s control.
The example below shows how the long candlestick wick is created during the session with price first trading lower. By the end of the session price action has snapped back higher to form the hammer signal.
How to Trade the Hammer Candlestick
The key to the hammer candlestick pattern is where and how they form.
Hammer candlesticks can often produce false signals, but this is often when the market situation is not taken into account.
For example; if entering using a hammer for an entry we want to be using other factors in the trades factor. These include trading with the trend, trading at major support levels and lining up other levels of confluence.
The simplest and easiest strategy for entry and stop loss when trading the hammer is to use the candle itself for the trade parameters.
An example of this is on the chart below; a potential entry could be when the hammer is confirmed and breaks higher.
A more aggressive entry could be as soon as the hammer closes and the next candle opens.
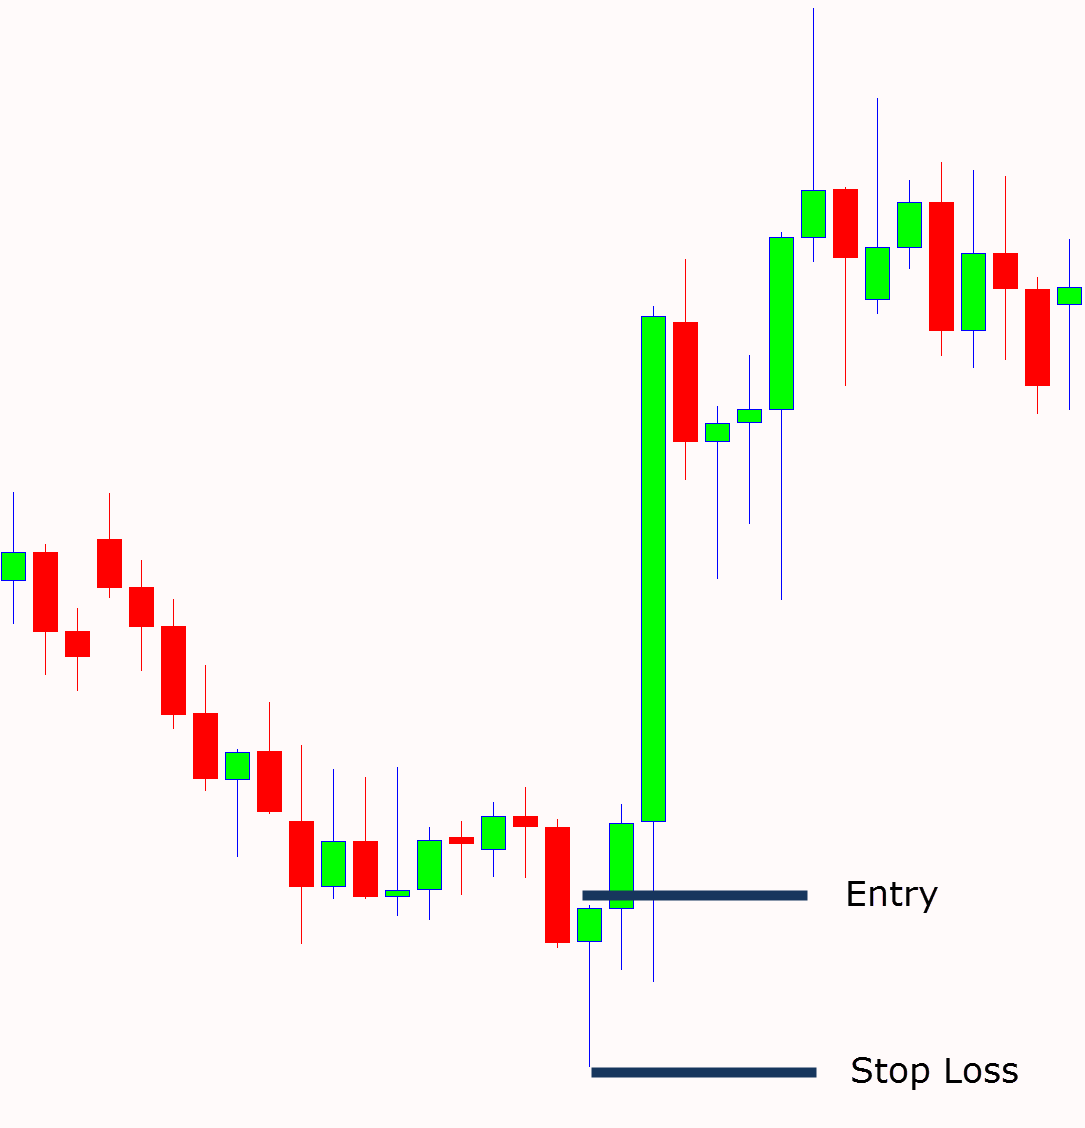
The most popular stop loss method for the hammer is placing the stop on the other side of the candlestick below the low.
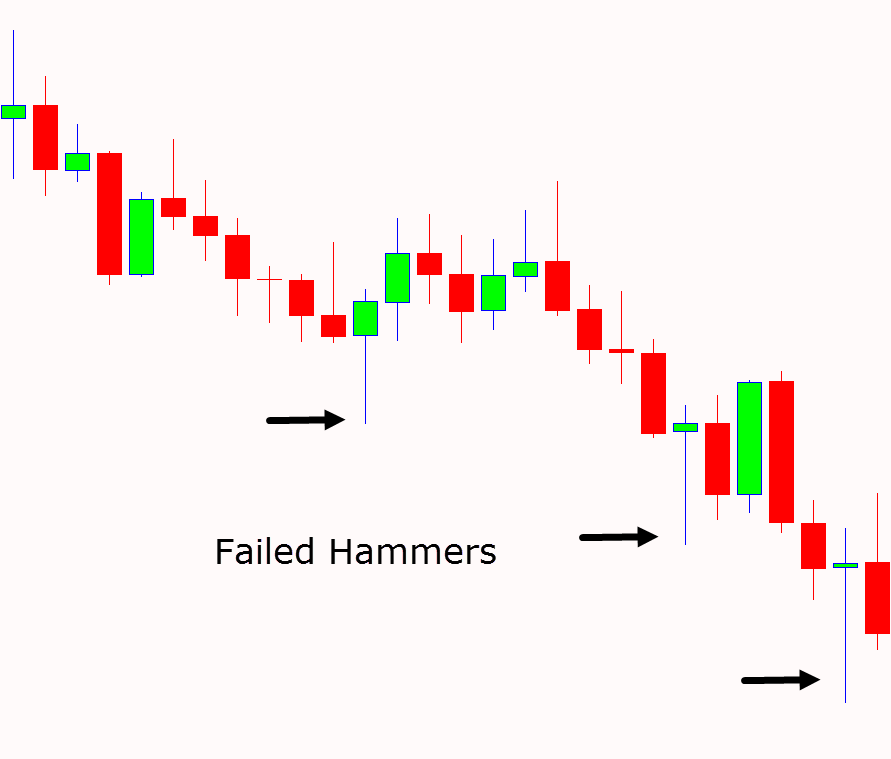
Hammer Patterns Don’t Always Work
As just discussed; the key to the hammer is taking into account the market situation and where the hammer signal forms.
The best hammer signals will have other factors in their favor. They will also be forming at correct swing lows.
The chart example below shows three failed hammer candlesticks. All of these hammers had the same thing in common. They were all against the overall strong trend lower and they did not have other factors in their favor such as being formed at major support levels.
Hanging Man vs Hammer Candlestick Pattern
The hanging man and hammer candlestick patterns can be quite easy to mix up unless you understand one key factor.
Whilst both of these candlestick patterns look exactly the same when formed by themselves, when formed within the price action they are very different.
These two candlesticks also indicate the complete opposite. Whilst the hammer indicates a bullish reversal, the hanging man indicates a potential bearish reversal.
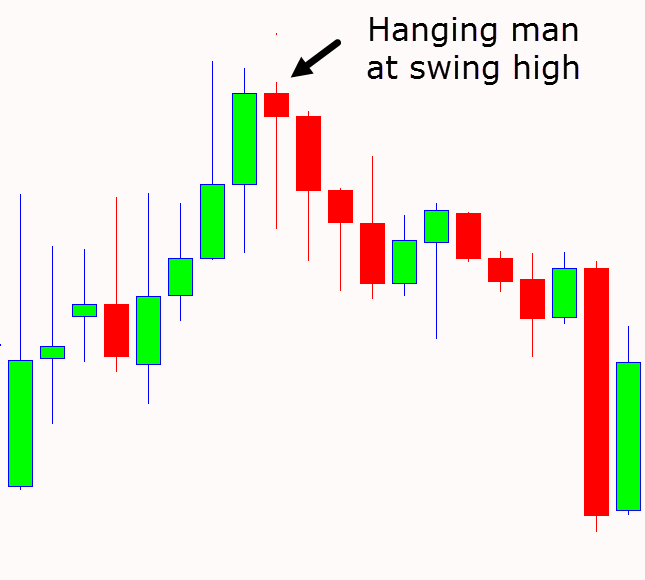
The major difference between the two is where they are formed.
Whereas the hammer forms at a swing low and sticks out, the hanging man forms at a swing high and sticks back in.
You can read more about trading the hanging man candlestick here.
Trading Hammer Candles With Indicators
One of the best ways to increase the odds of making profitable trades with the hammer is to use other tools and indicators to assess the market situation.
An example of this is first finding a trend and then trading in the trends direction.
One way you can do this is with moving averages.
Below is a chart example showing how you could use moving average with the hammer to find trade setups.
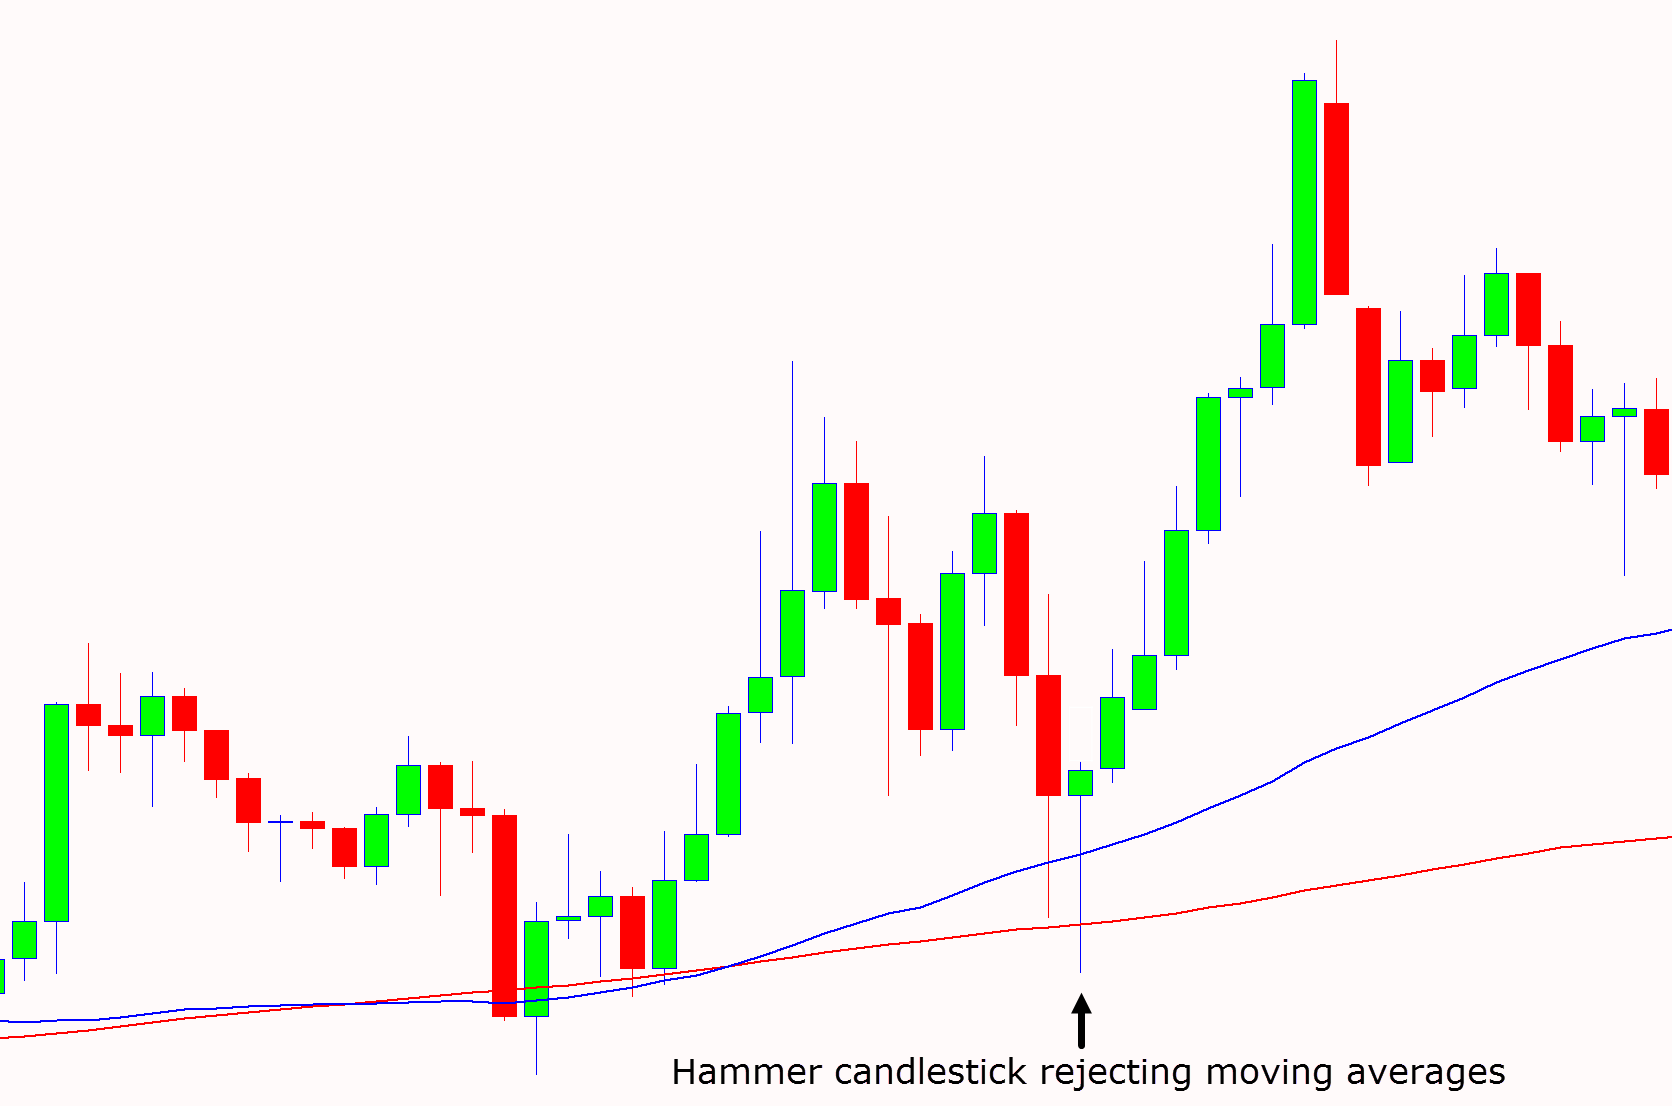
The moving average and moving average crossover can help you find trends and dynamic support and resistance levels.
You can use these trends and levels to look for trades at high value areas using the hammer as your entry signal.
Lastly
The hammer is one of many candlestick patterns you can use in your trading.
Keep in mind they will not always work and they are not a 100% foolproof trading entry signal.
The highest probability trades using the hammer will be found when adding in other factors to increase the trades odds such as indicators, major support and the overall trend.
