The relative strength index is a convenient and easy-to-use indicator in your trading.
You can use this indicator to see when a market is overbought or oversold and help you make trading decisions.
In this post, we go through exactly what the relative strength index is and how you can use it in your own trading. You will learn how to set it up in your MetaTrader charts and how you can use it to find potential buy and sell signals.
NOTE: You can get your free relative strength index trading strategies PDF guide below.
Table of Contents
What is the Relative Strength Index?
The relative strength index is commonly called the RSI and is a technical analysis indicator that can help show you the momentum of a market.
The relative strength index indicator is an indicator that adds an oscillator to your chart.
This oscillator rotates between 0 and 100. The two main levels traders keep an eye on with the RSI are the 30 and 70 numbers.
When the price starts moving above the 70 level, it is thought that the price is overbought. On the other hand, when the price moves below the 30 level, it is thought that the price is oversold.
Using these levels, you can start to predict potential market reversals when the price is either overbought or oversold.
How to Use the RSI
The RSI will rise as the amount of positive closes increases. On the other hand, it will fall as the amount of losses increases.
The relative strength index will smooth out this information and give you a very easy-to-read oscillator that moves higher and lower.
You can read about how exactly the relative strength is calculated here, but when using an indicator, all of these calculations are carried out for you, and all you need to worry about are the key levels.
The relative strength index was created in 1978 and is now one of the most popular indicators for price action and technical analysis traders.
You can use the RSI to both find and manage your trades, and we will discuss, you can combine it with other trading strategies.
The RSI is so popular and used widely throughout the markets because it is straightforward to add and start using in your own trading.
Relative Strength Index Trading Strategies
When you add the RSI indicator to your chart, you will be given an oscillator that moves higher and lower.
The two main levels we watch when using the RSI are the 30 and 70 levels.
For bullish reversals, we are looking to see when the price starts moving below the 30 level. This indicates that the price is oversold, and a potential reversal back higher could be on the cards.
For bearish reversals, we are looking to see when the RSI starts moving above the 70 level. Movement above the 70 level could indicate that the price is overbought and is looking to make a bearish reversal back lower.
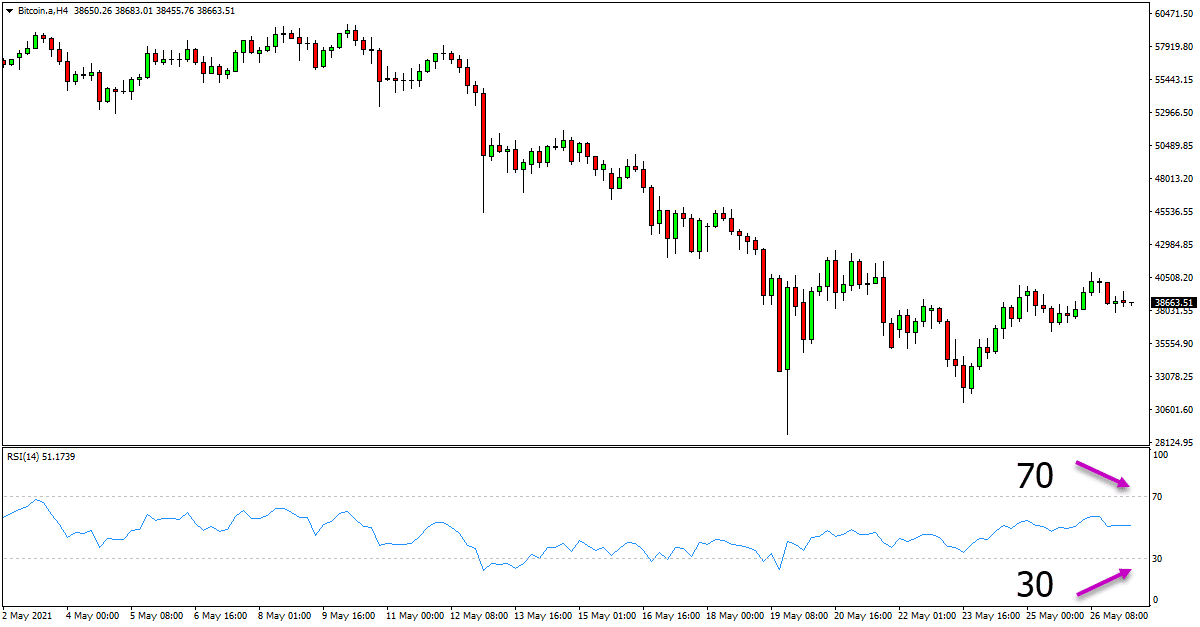
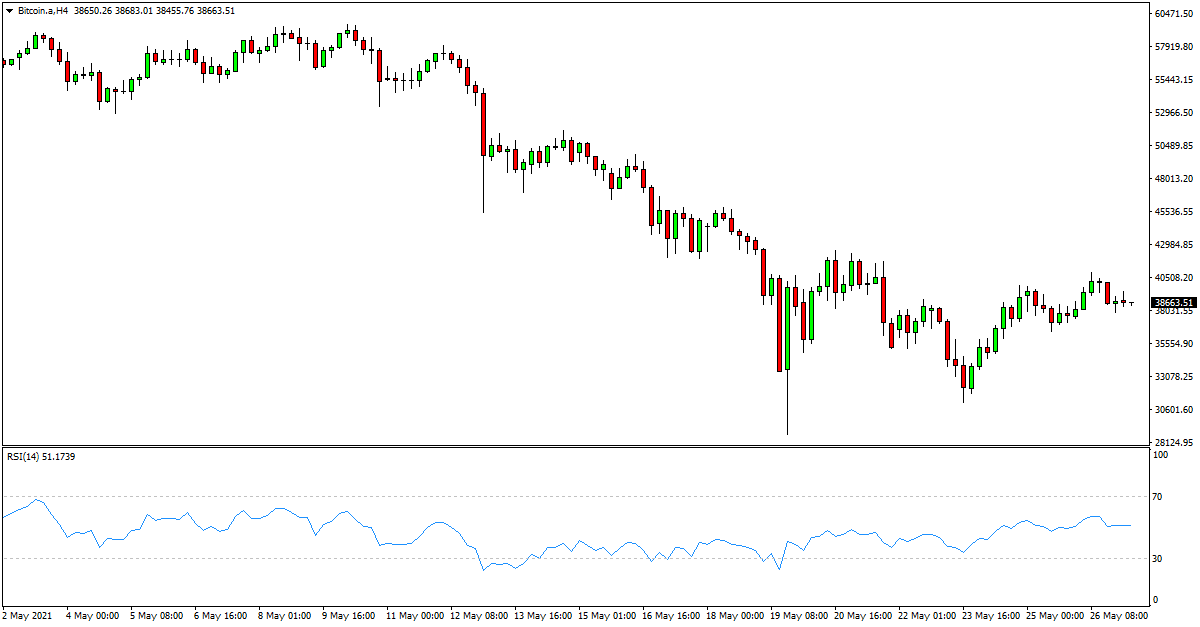
In trending markets, you will often notice that the RSI moves in a band or range and not showing overbought or oversold conditions.
In the chart example below, you can see the price has been in a trend lower, but the RSI stays between the 30 and 70 bands.

RSI Indicator Buy and Sell Signals
Whilst the relative strength indicator is great at finding overbought and oversold levels in the market, it can also be used to find buy and sell trading signals.
The best way to find buy and sell signals with the RSI is to combine it with other technical analysis strategies to confirm a potential trade.
One of the simplest ways of doing this is using the RSI at key levels in the market. These can be support and resistance levels or other areas of importance.
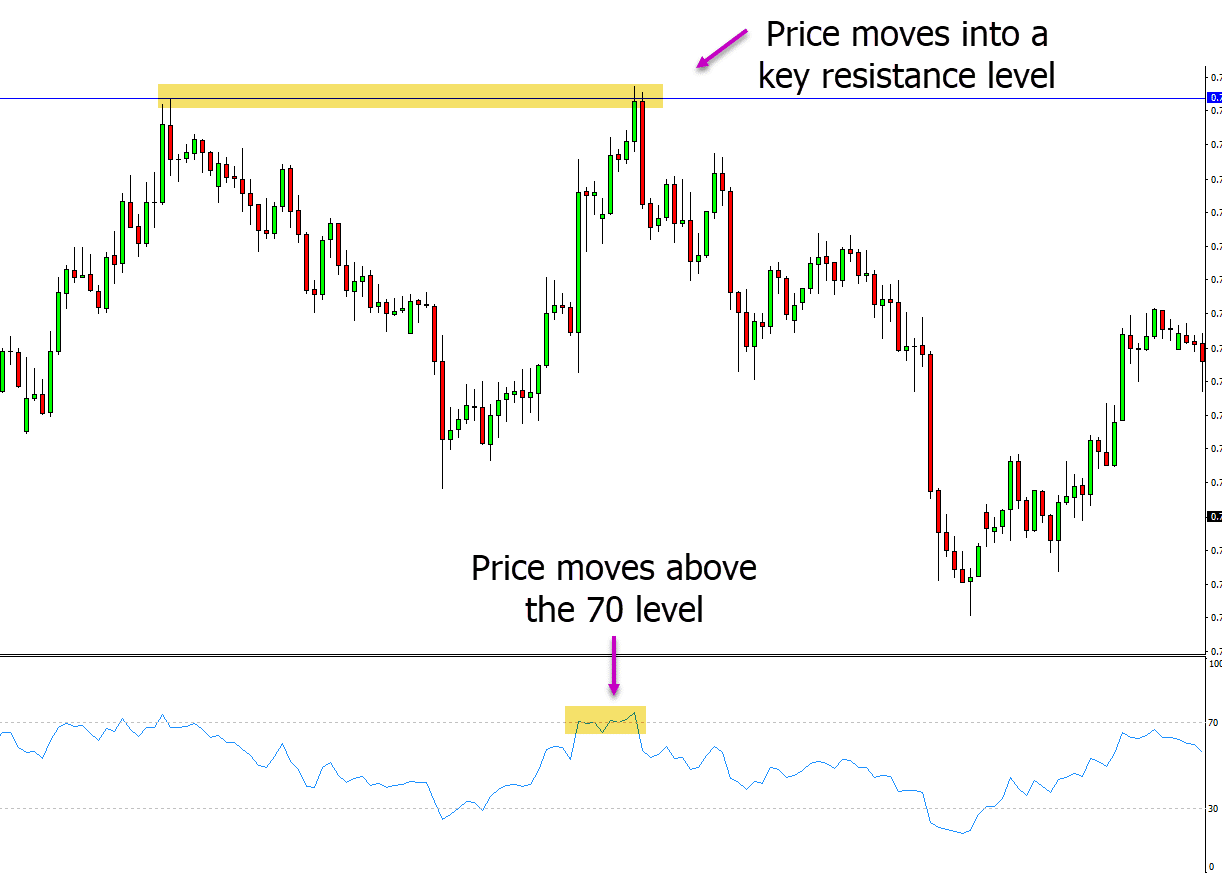
In the example below, price is moving into a key resistance level. This is a major level and a level we could be watching for potential short reversal trades. When we look at the RSI, we see that price is moving above the 70 level, indicating overbought conditions and a potential reversal back lower.
Using these two pieces of information, we could make a short trade and price as the price moves back lower and away from the resistance level.
If you wanted to add even more confirmation to your RSI trading signals, you could look to add Japanese candlesticks or other key indicators.
Using the Relative Strength Indicator in MT4 and MT5
Using the relative strength indicator in MT4 and MT5 is very easy, and after you have added it, you will have the oscillator at the bottom of your charts.
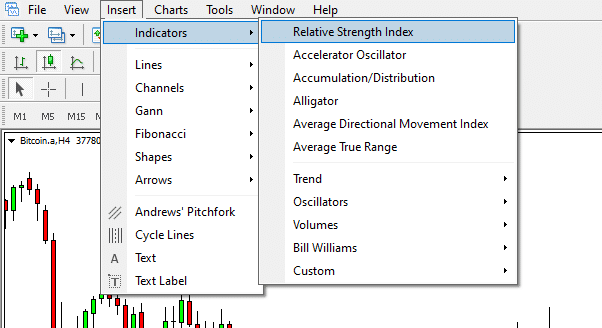
To add the RSI to your Metatrader charts, follow these instructions;
- Open your MT4 or MT5 charts.
- Click on the “Insert” button at the top of your charts.
- Select “Indicators” and then the Relative Strength Index.
- A box will then open, allowing you to customize the RSI indicator how you would like to use it.
See the example below for where you can find the RSI indicator in your MetaTrader charts.
NOTE: You can get your free relative strength index trading strategies PDF guide below.
