Supply and demand when Forex trading is no different to supply and demand with any other real world trade.
Whilst many trading websites will try and make this subject overly complicated, the truth is that it is not.
The trick however when it comes to using supply and demand levels when trading is being able to quickly and easily spot these levels to find and then manage your trades.
In this post we go through exactly what supply and demand is and how you can use it in your trading.
NOTE: Get your free Supply and Demand Forex Trading PDF Guide Below.
Table of Contents
What is Supply and Demand?
Supply and demand is simply how much something is wanted and how much there is to offer.
Supply is the amount on offer for a certain product, asset or in the case of trading Forex, a currency.
Demand is the amount that is wanted for a certain asset, product or currency.
For a simple real world example think of the price of petrol / gas. When there is a lot of gas around and there is a large amount of supply, then the price will fall and be cheaper.
However, on the flip side, if the demand increases and there is less supply available, then people will start to pay higher prices.
Supply and demand can be seen on everything from house prices through to the amount you pay for your food.
What is Supply and Demand in Forex Trading?
Supply and demand works the same way in Forex trading.
If there is a large amount of demand for a certain currency, then it will rise. If however, the demand falls away and there becomes an imbalance where there is too much supply, then just like in the real world the price will start to fall.
The easiest way to think about this is what happens when price starts rising rapidly in a rising market. As price begins to surge higher more and more traders are trying to enter (an increase in demand). Because there is not enough supply to keep up with this rising demand the price rises higher.
There are many ways to spot supply and demand levels on your Forex charts. Common ways are trendlines, support and resistance and even using dynamic support and resistance with moving averages.
However, the easiest ways for you to spot supply and demand levels on your charts is with major support and resistance levels. These levels where price continually bounces from show a consistent level where price is finding an oversupply and a level where demand grows.
How to Identify Supply and Demand in the Forex Market?
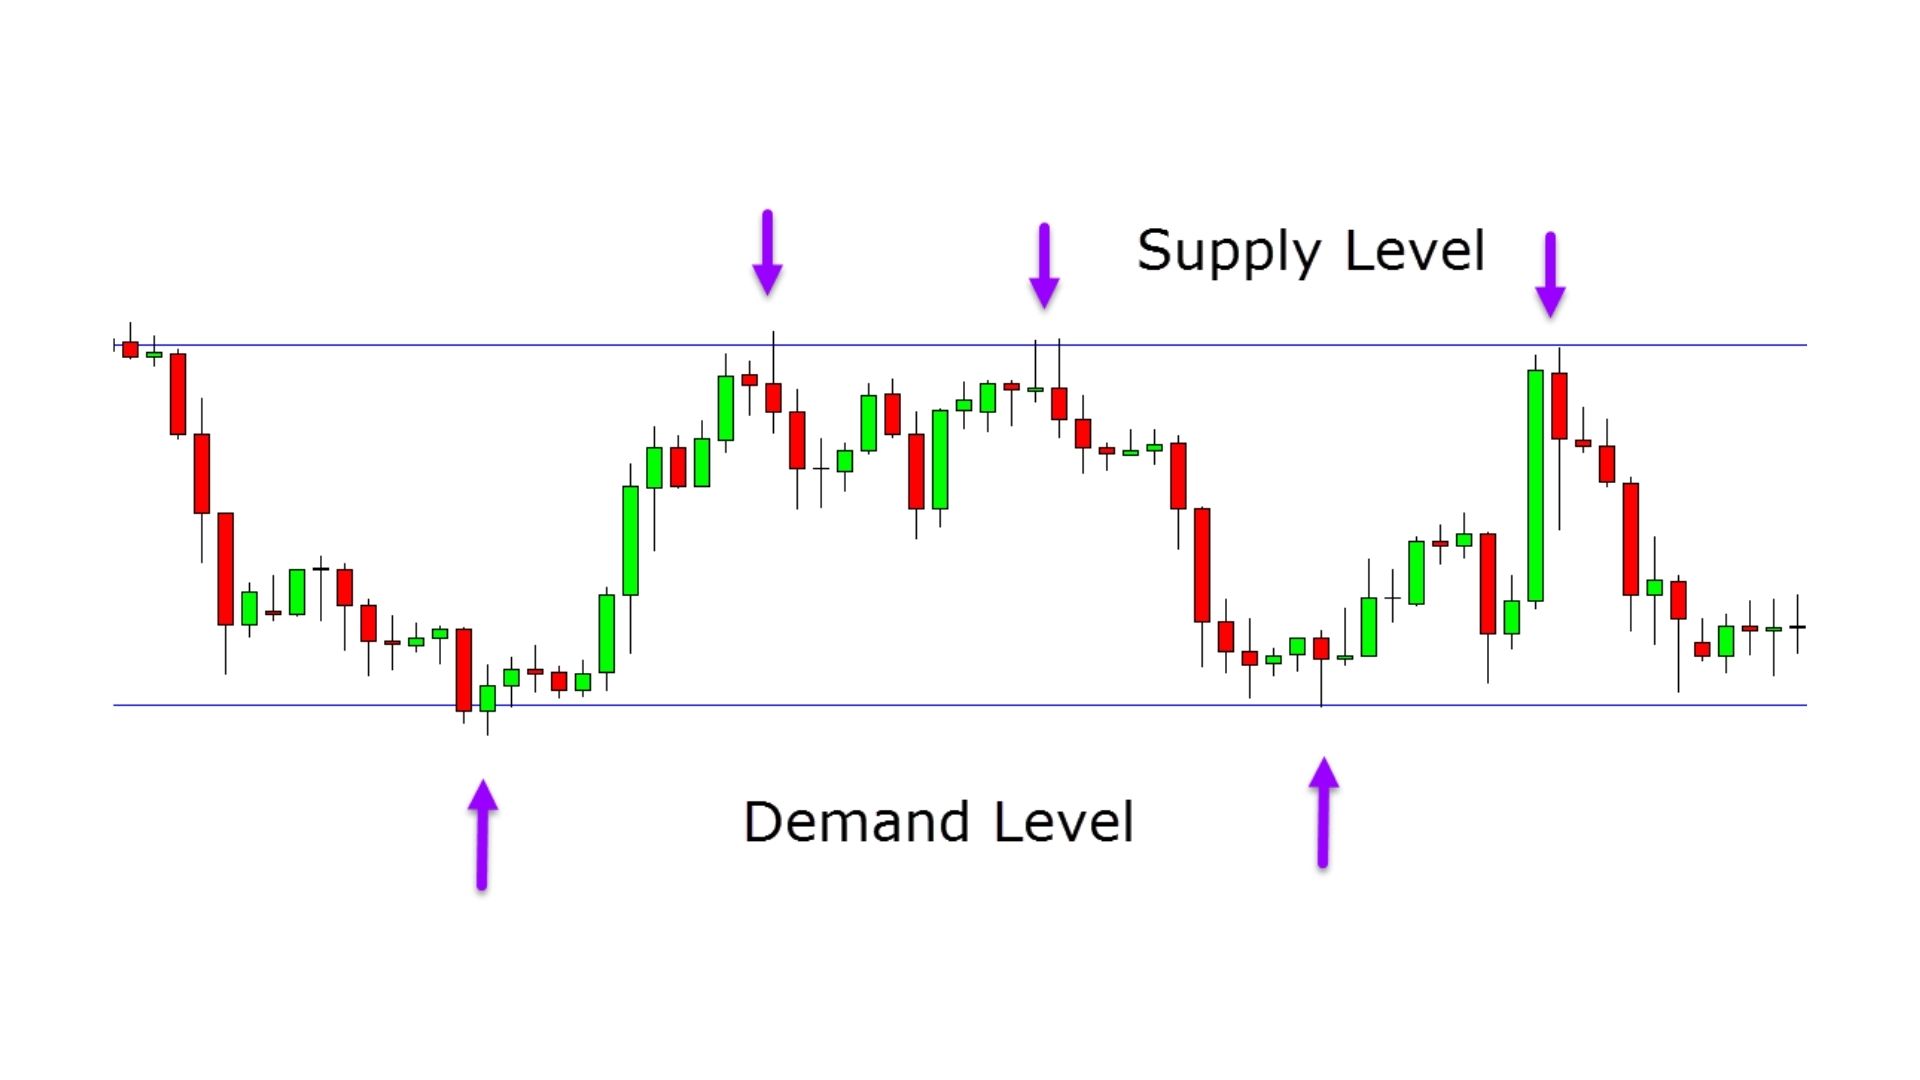
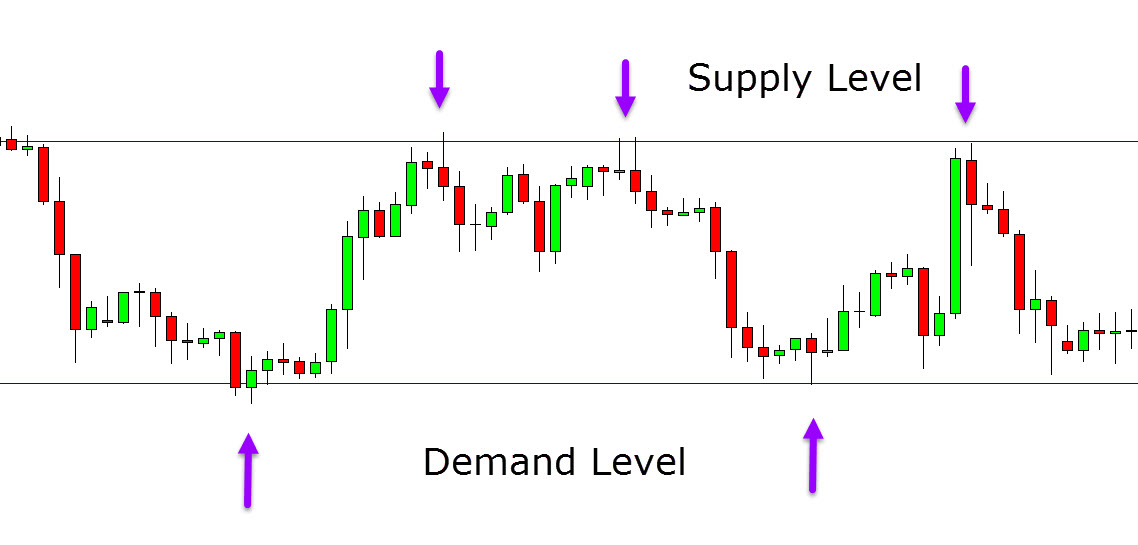
Price is in a constant tug of war between the buyers and sellers. This tug of war is to figure out the supply and demand levels and ultimately who is in control of the next move.
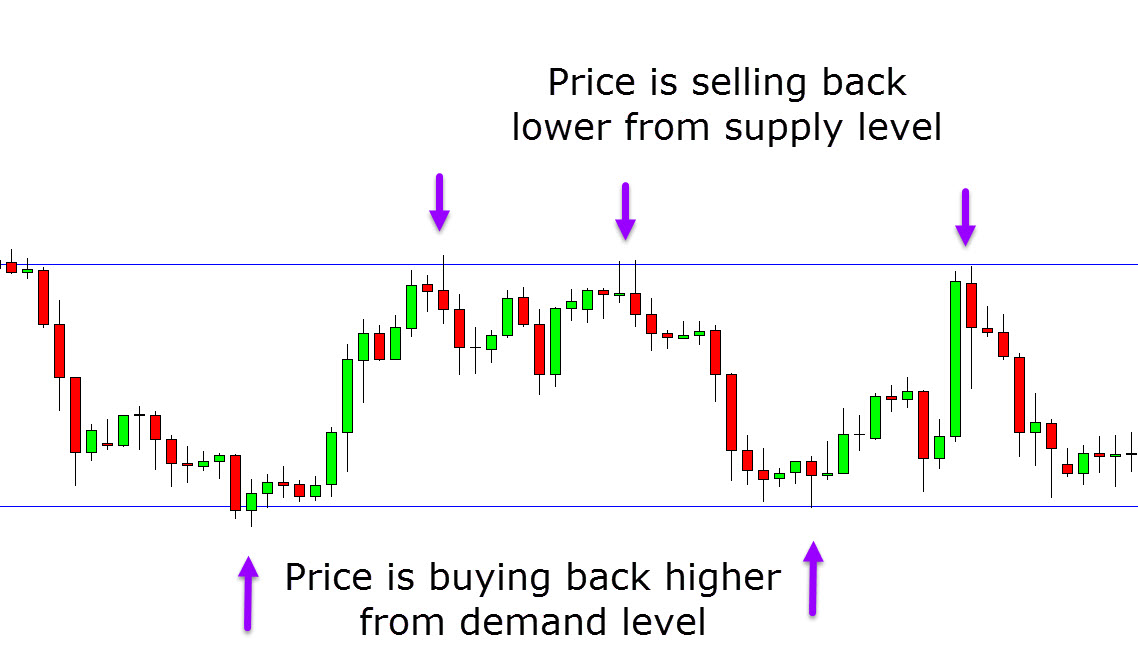
As the example chart shows below, as price moves lower there is an oversupply and a lack of demand. This sends prices lower. Price moves into a demand level (support) where the market dynamics shift. At this level that amount of demand picks up and because demand is now higher, the supply starts to get lower. This sends prices back higher.
As price moves back higher traders start to cash out of their profitable trades. Because traders are leaving their positions and selling out, all of a sudden there is more supply around. What happens when there is more supply and not as much demand? Price starts to fall back lower again.
Supply Demand Price Action Trading
Whilst there are many complicated ways you can start to use supply and demand levels in your trading, the easiest and often the best is with a clean price action chart.
What does a clean price action chart mean? No indicators or any other distractions. Just raw price action.
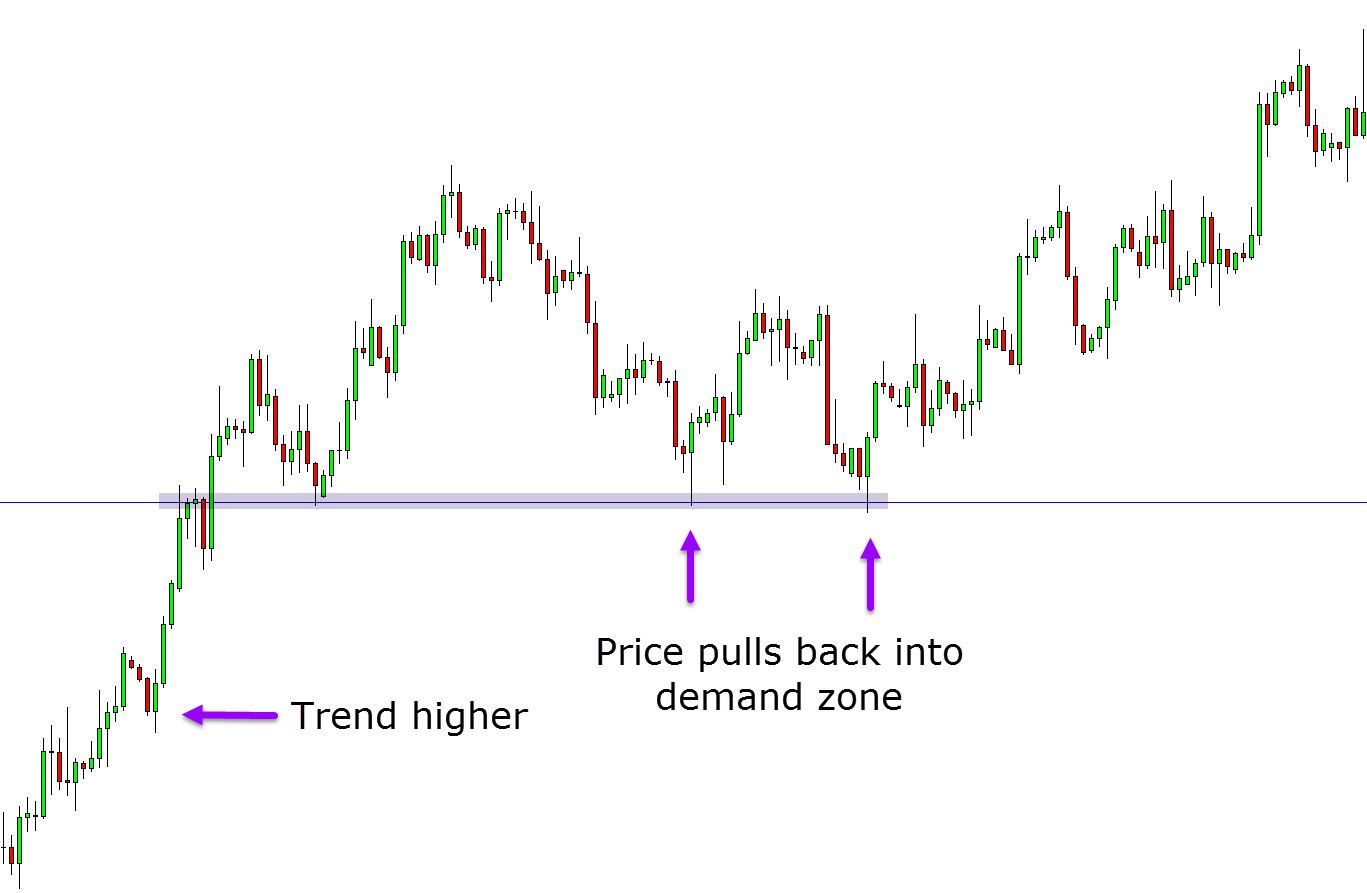
See the example chart below. First you notice that price is in a trend higher. You then want to find long trades inline with the current trend. As this example chart shows, you get two potential trading signals to make a long entry.
Price first pulls back into a clear demand (support) area where you could enter long. Price then makes a second pulback into the same demand zone before making another large move higher.
Finding Supply and Demand Trading Signals
Once you have learned how to spot obvious supply and demand zones on your charts, you can then start using them to find both high probability trades and also manage your trades.
You can use these levels to make very high reward trades and also to set your stop loss and profit targets.
You can also use these same levels on all time frames.
Simple Supply and Demand Trading Strategies
The next two examples of supply and demand trades are setups you will see and be able to use in your trading over and over again. They form on all time frames and repeat themselves time and again.
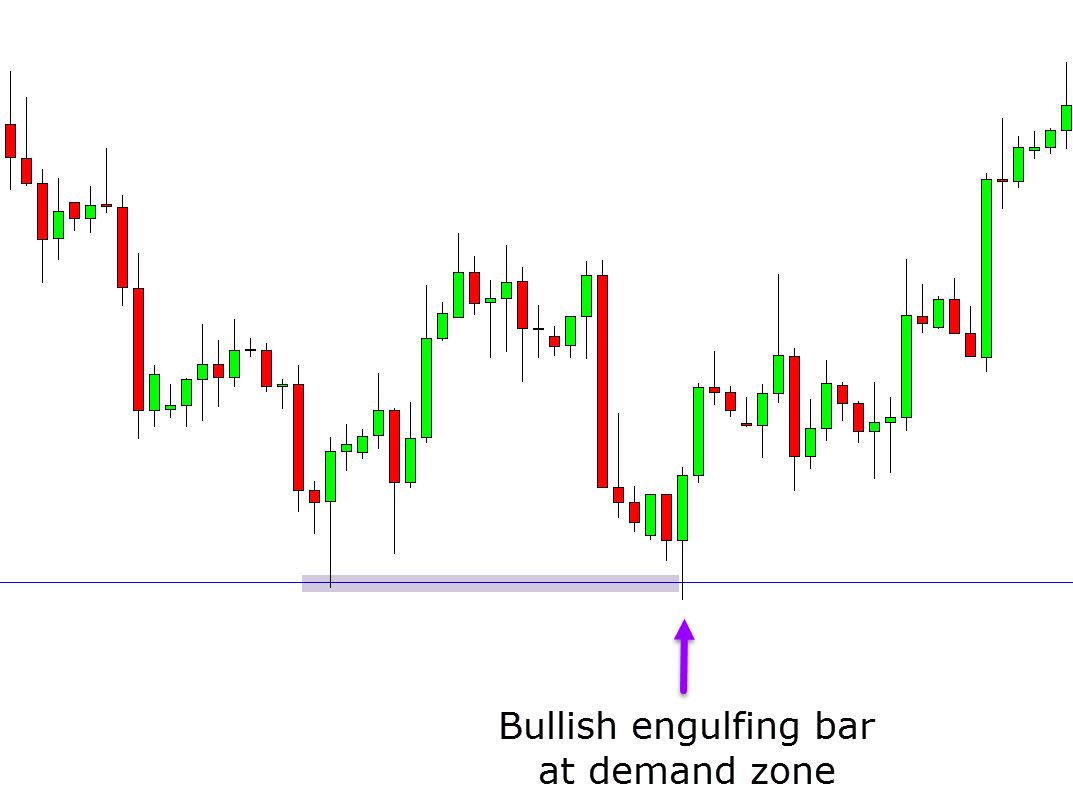
In the first example you identify a clear demand level. Price has clearly found demand at this level multiple times. If you are very aggressive you could just enter a long trade right from this level.
If you are more conservative you could look to increase the odds of your trade by using a bullish Japanese candlestick to confirm your trade. In this example price forms a bullish engulfing bar at the demand level to confirm a long trade higher.
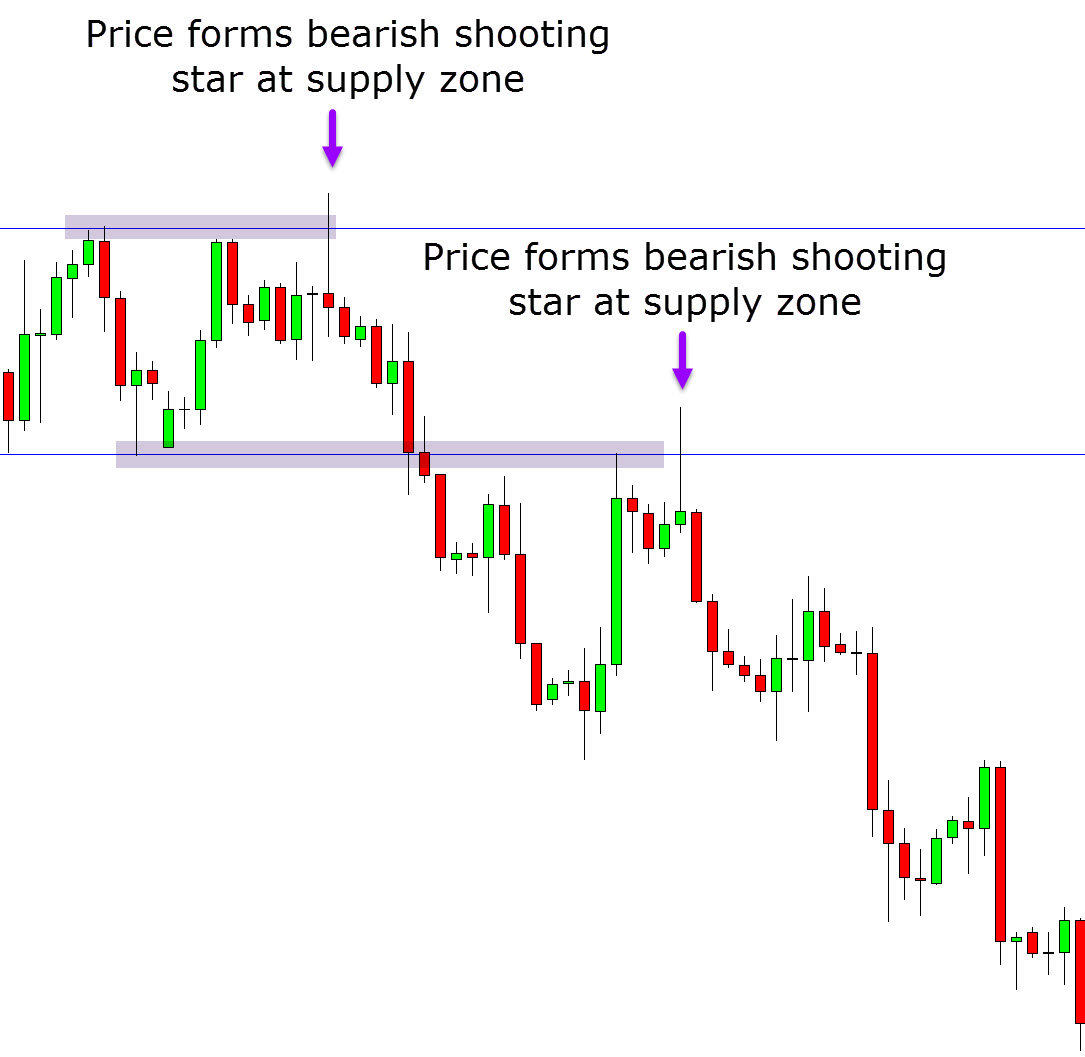
In the second example you notice that price is starting to make a move and trend lower. You also notice price break through a clear support level. When price moves back into this supply level you could start looking for short trades. Short trades here would be at an obvious supply level and inline with the trend lower.
Just like the first example you could also use a candlestick pattern to confirm the bearish move lower. In this example price forms a shooting star pattern to signal a move back lower.
Lastly
Being able to accurately identify and use supply and demand levels can take some time and practice.
It is not as easy as downloading and using an indicator that tells you what to do and what direction to trade.
However, there are many benefits to supply and demand trading once you have mastered it. You can use it to find trades on all time frames and it will also help you with your stops and profit targets.
Make sure you test out any new strategies on free demo charts before you ever risk any real money so you know that they work for you and you are completely comfortable with them.
NOTE: Get your free Supply and Demand Forex Trading PDF Guide Below.
