One of the basic tenets of technical analysis is that momentum precedes price. However, prices never move in a smooth line, and momentum will often be out of sync with the price. This mismatch between momentum and the actual price is referred to as a divergence. Traders can exploit these price discrepancies for profit.
The Divergence Cheat Sheet below offers an easily accessible, in-depth look at what a divergence is, the different types of divergences, and how to trade divergence efficiently.
Note: You can get your free divergence cheat sheet PDF below.
Table of Contents
What is Divergence?
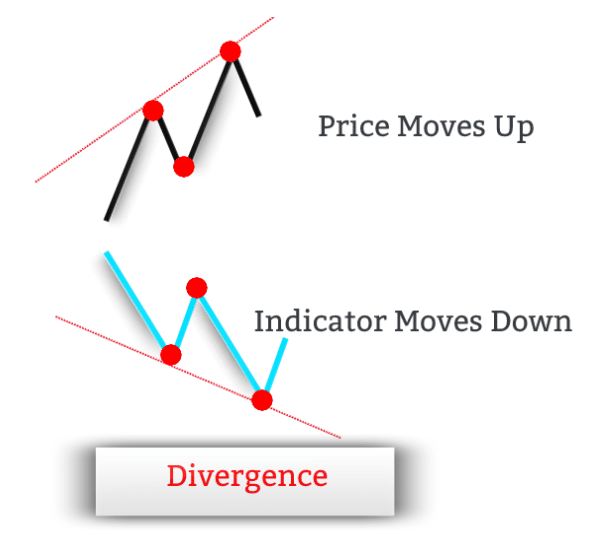
In trading, divergences occur when the price of an asset and the indicator are moving in opposite directions. In other words, when the price of an asset is out of sync with the corresponding indicator’s readings, a divergence signal occurs.
In normal market conditions, the price action of an asset and the technical indicator move in the same direction. In other words, when the price prints a new high, the technical indicator should print a new high as well.
Divergence is not a technical indicator per se, but a trading concept. There is no mathematical formula to calculate divergence.
The main purpose of a divergence is to signal momentum building into a trend, and give early reversal signals when there is a slowdown in the momentum.
Divergence doesn’t indicate when the reversal will happen, but it’s an early warning sign that the price might reverse soon.The opposite of divergence is convergence.
How Does Divergence Work?
To really dig deeper into the market, traders need to understand the foundation of how price in any market moves.
At the core, asset prices move in a series of higher highs and higher lows when we’re developing an uptrend. Conversely, when we’re developing a downtrend, asset prices move in a series of lower lows and lower highs.
The concept of successful trading is to buy low and sell high. In other words, you have to buy when the price is making a new low and sell when the price makes a new high.
Divergences can help traders distinguish when to buy at a new low and sell at a new high. This is done by studying the divergence signals – the mismatch between the price and the technical indicator.
Broadly speaking, there are two types of divergence signals:
- Regular divergence is also known as the classic divergence.
- Hidden divergence.
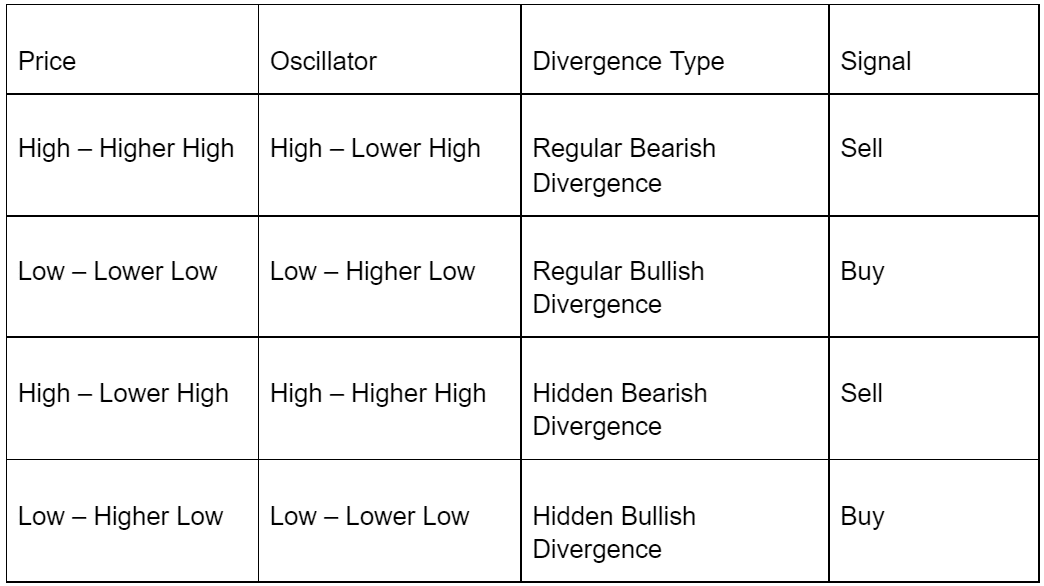
Divergence Cheat Sheet Table
The table below outlines the different types of divergence and the signals they generate.
Download your Divergence Cheat Sheet PDF so you can save this for later!
Regular Divergence
Regular divergences can be further classified into regular bullish divergence and regular bearish divergence:
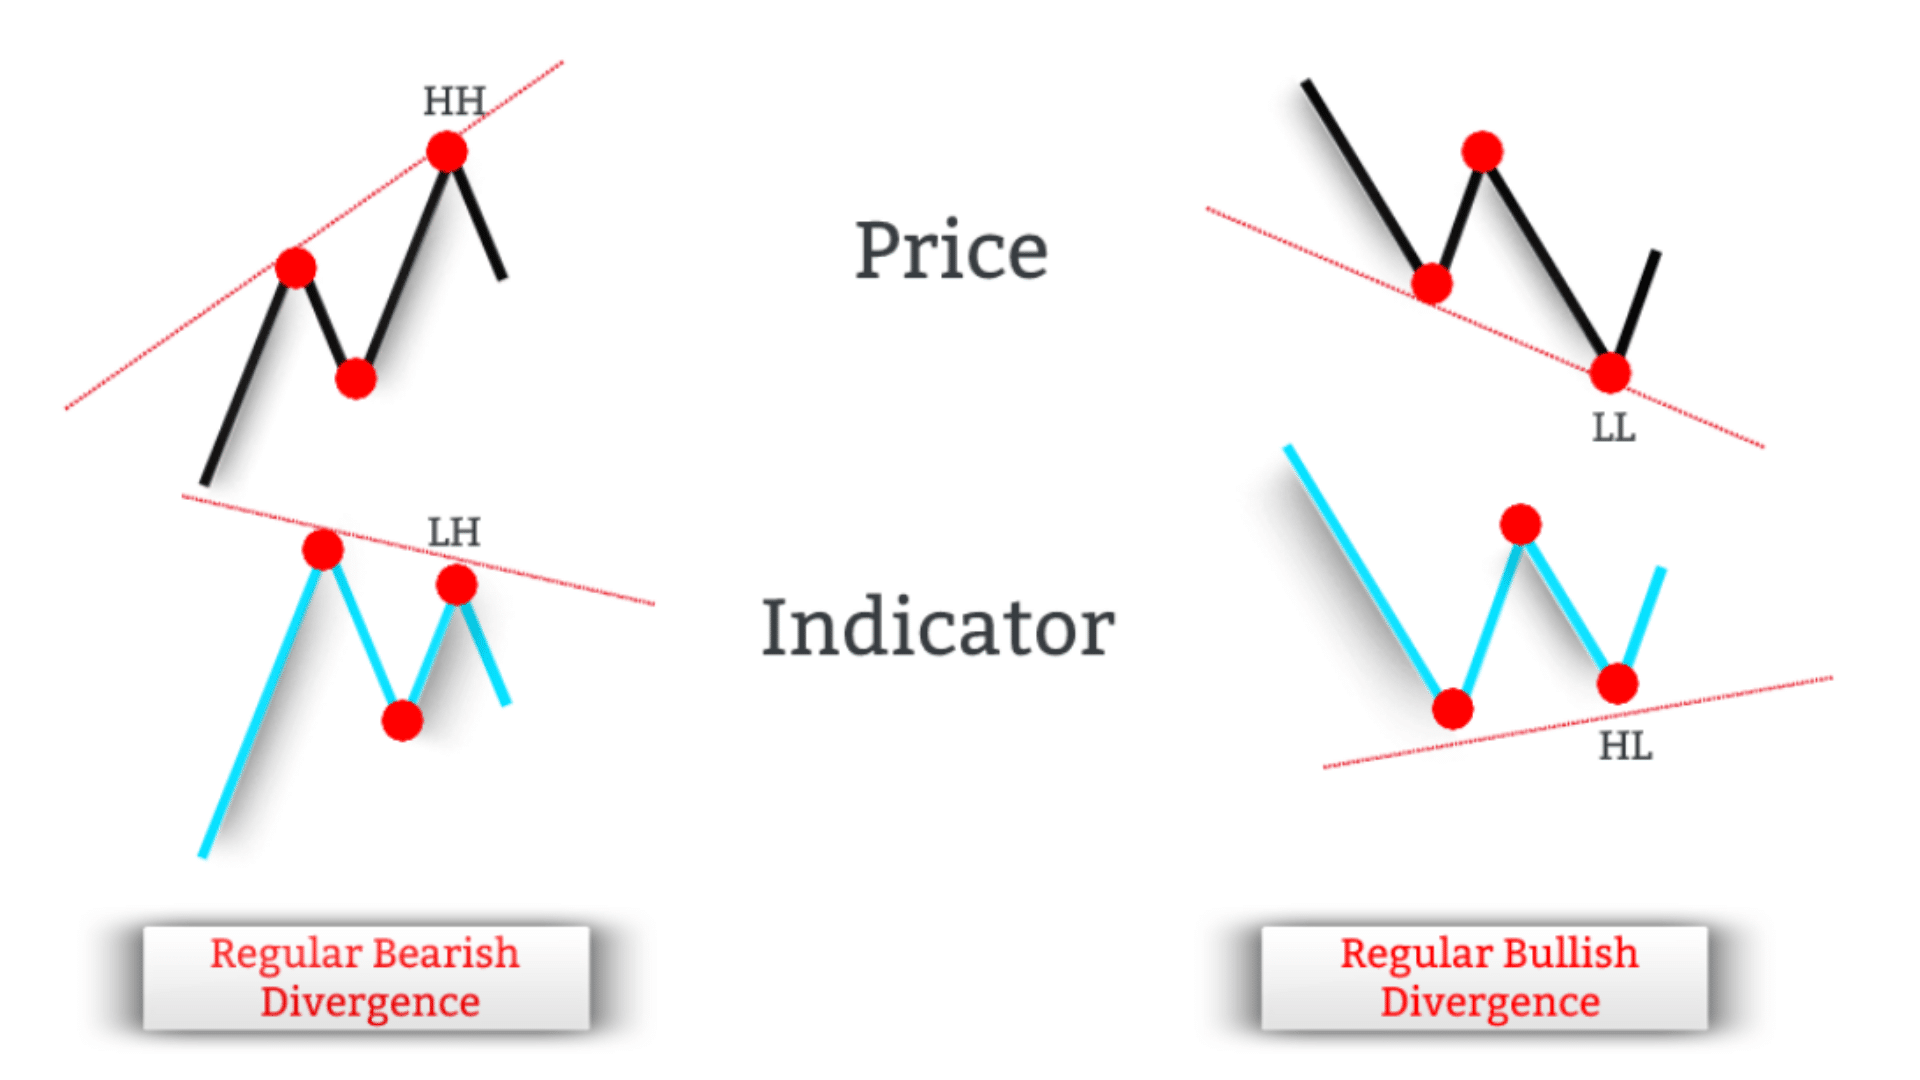
Regular bullish divergence happens when we have a disagreement between prices that are falling (making lower lows) and a technical indicator that is rising (making higher lows).
Regular bearish divergence happens when we have a disagreement between prices that are rising (making higher highs) and a technical indicator that is falling (making lower highs).
The regular bullish divergence is an early sign that the prevailing downtrend will change direction and turn to the upside. In this regard, the regular bullish divergence is a buy signal.
Conversely, the regular bearish divergence is an early sign that the prevailing uptrend is about to change direction and turn to the downside. In this regard, the regular bearish divergence is a sell signal.
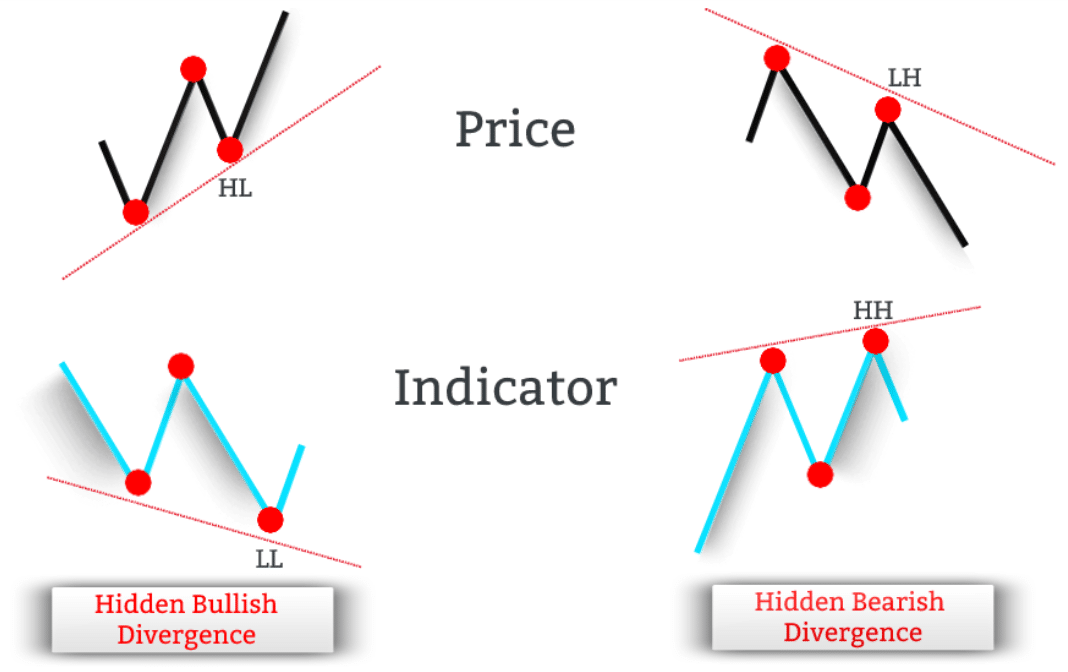
The image below outlines side-by-side the difference between the regular bullish divergence and regular bearish divergence.
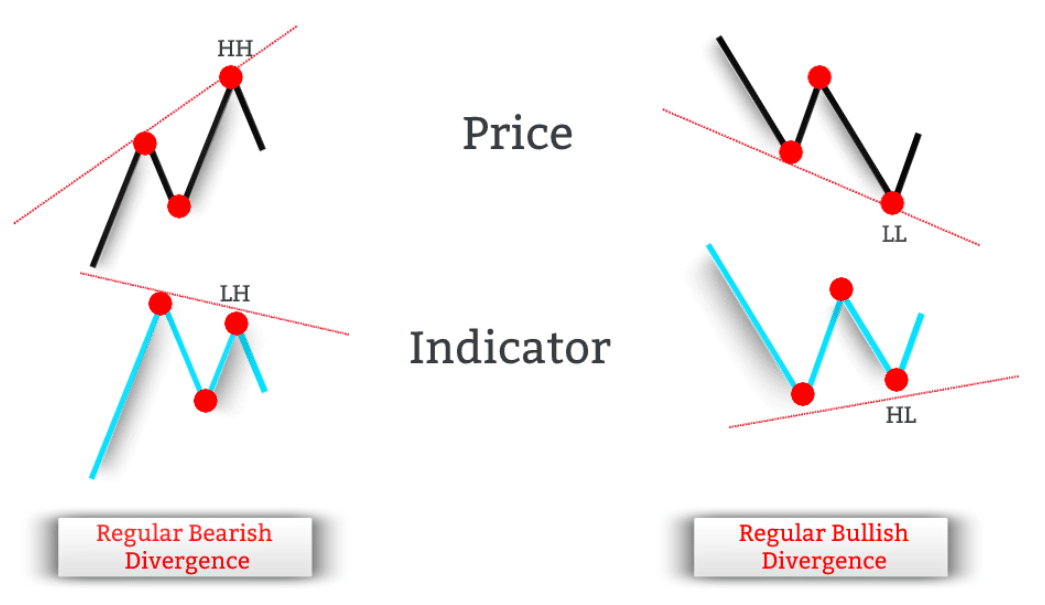
The ideal place where a regular bullish divergence can develop is at the end of a downtrend. This type of divergence then naturally leads to an uptrend.
Conversely, the ideal place where a regular bearish divergence can develop is at the end of an uptrend. This type of divergence then naturally leads to a downtrend.
Hidden Bullish Divergence
The hidden divergence doesn’t differ that much from the regular divergence. For a hidden divergence to happen, we need to see a mismatch between the price and the technical indicator similar to regular divergence.
However, while regular divergence signals a possible trend reversal, the hidden divergence signals the possibility of trend continuation. Hidden divergences tend to develop within an existing trend.
Usually, hidden divergences indicate that the prevailing trend is still strong enough to resume itself.
Just like the regular divergence, we can distinguish two different types of hidden divergence:
- Hidden bullish divergence.
- Hidden bearish divergence.
A hidden bullish divergence happens when the price is making a higher low, while at the same time, the indicator is making a corresponding lower low.
The hidden bullish divergence is an early sign that the prevailing uptrend is ready to resume. These divergence signal develop after prices have pulled back. In this regard, the hidden bullish divergence is a buy signal.
The image below outlines side-by-side the difference between the hidden bullish divergence and hidden bearish divergence.
Usually, the hidden bullish divergence can be observed in uptrends.
Hidden Bearish Divergence
Hidden bearish divergence happens when the price is making a lower high, while at the same time, the indicator is making a corresponding higher high.
This serves as an early sign that the prevailing downtrend is ready to resume. Typically, a hidden bearish divergence signal develops after prices have pulled back. In this regard, the hidden bearish divergence is a sell signal.
A hidden bearish divergence can typically be observed in downtrends.
Hidden divergences don’t occur as often as regular divergences. However, hidden divergences can tell traders in advance when a prevailing trend might resume.
In a nutshell, the hidden divergence occurs simultaneously with short-term retracements in the price. In other words, the hidden divergence signals the potential end of a pullback.
- Hidden bearish divergence – the end of a pullback in a downtrend.
- Hidden bullish divergence – the end of a pullback in an uptrend.
Divergence Indicator
Before recognizing regular divergence and hidden divergence and the possible trend reversal or trend continuation signals, traders should choose a technical indicator.
Usually, momentum oscillators like the RSI, Stochastic, MACD, etc., are used by retail traders to determine when the price of an asset and the indicator fail to converge.
The same way the price of an asset moves up and down, establishing peaks and valleys, technical indicators converge or diverge from the price making equivalent peaks and valleys.
Some technical indicators can be applied directly on the price chart or in a separate window, usually below.
Traders can use any oscillator to identify divergence, but the MACD, stochastic, and RSI indicators work best.
In contrast, the money flow index (MFI) is an alternative to identify hidden divergence. This is because the money flow index is a trend following indicator.
The Relative Strength Index (RSI) indicator is one of the most popular technical indicators to spot regular divergence and hidden divergence.
Divergence RSI
The Relative Strength Index (RSI) is a leading technical indicator, meaning that it precedes price movements.
An image of the RSI Indicator is presented below.
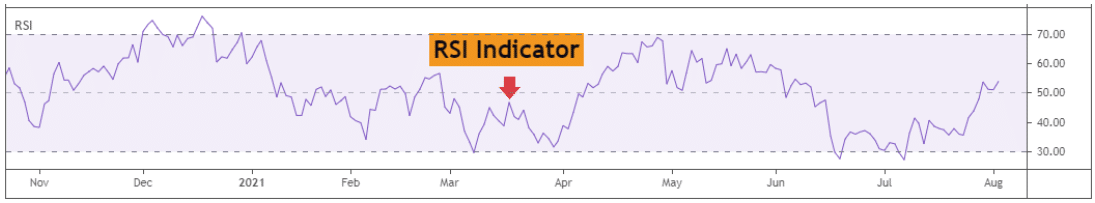
With the RSI indicator, traders can identify both regular divergences and hidden divergences.
However, the RSI divergences can’t be used as a timing tool. In this case, candlestick chart patterns can act as a confirmation for the resumption of the prevailing trend (in the case of RSI hidden divergence) or the trend reversal (in the case of RSI regular divergence).
Traders can look for long positions if they spot regular or hidden RSI bullish divergence. On the other hand, traders can look for sell positions if they spot regular or hidden RSI bearish divergence.
Bullish Divergence RSI
The chart below outlines the regular bullish RSI divergence.
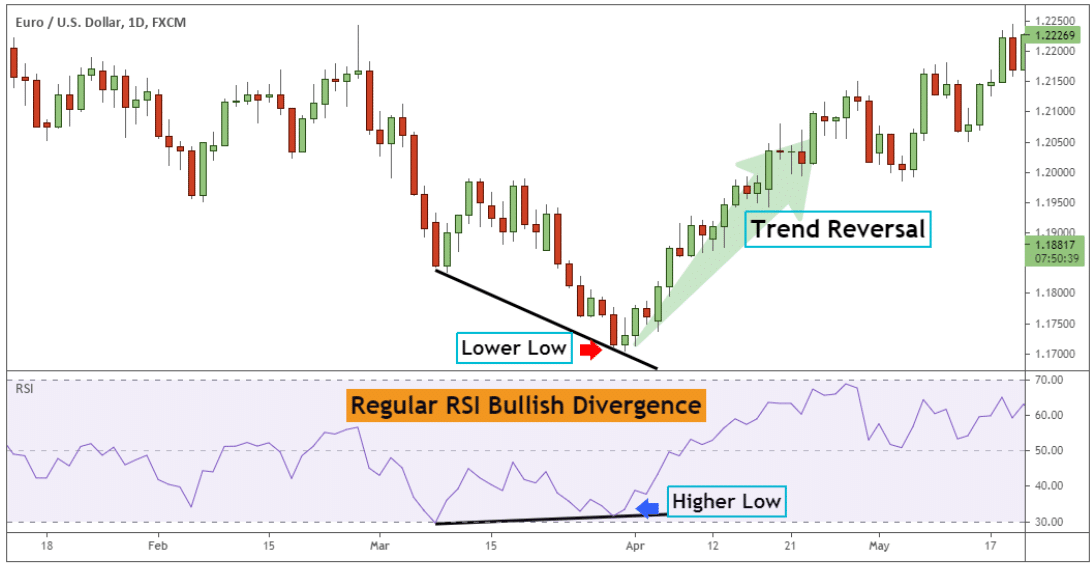
The price is making a new lower low compared to the previous swing low point on the price chart. At the same time, the RSI indicator prints a higher low relative to the previous low.
After forming the lower low on the price chart, the prevailing trend reversed from bearish to bullish.
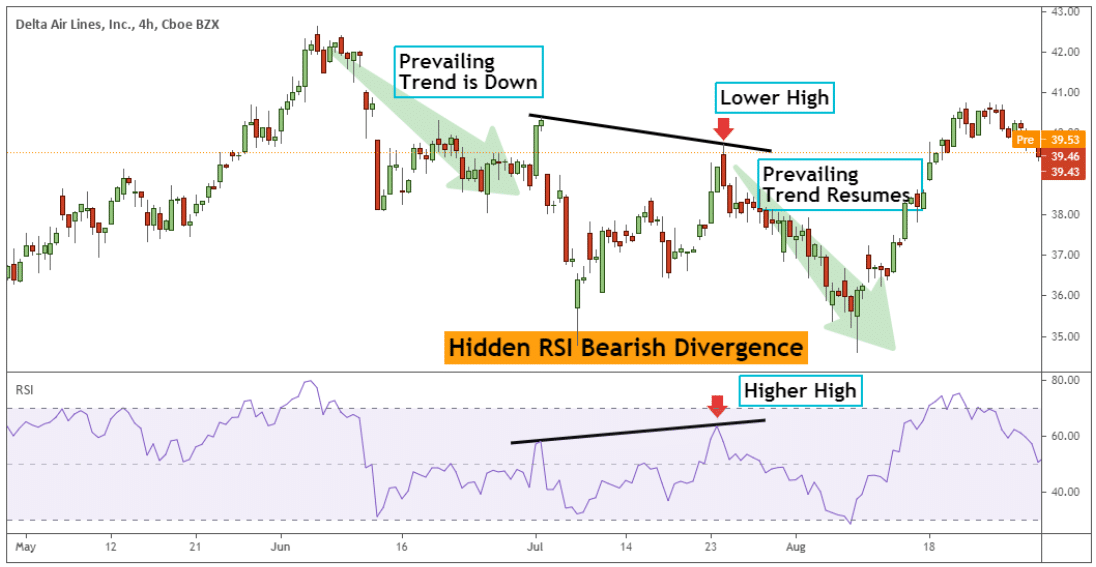
After forming the higher low on the price chart, the prevailing trend resumes and moves to new highs.
It’s crucial to understand that the bullish hidden divergence can develop in any place within the uptrend as long as all the technical conditions are satisfied.
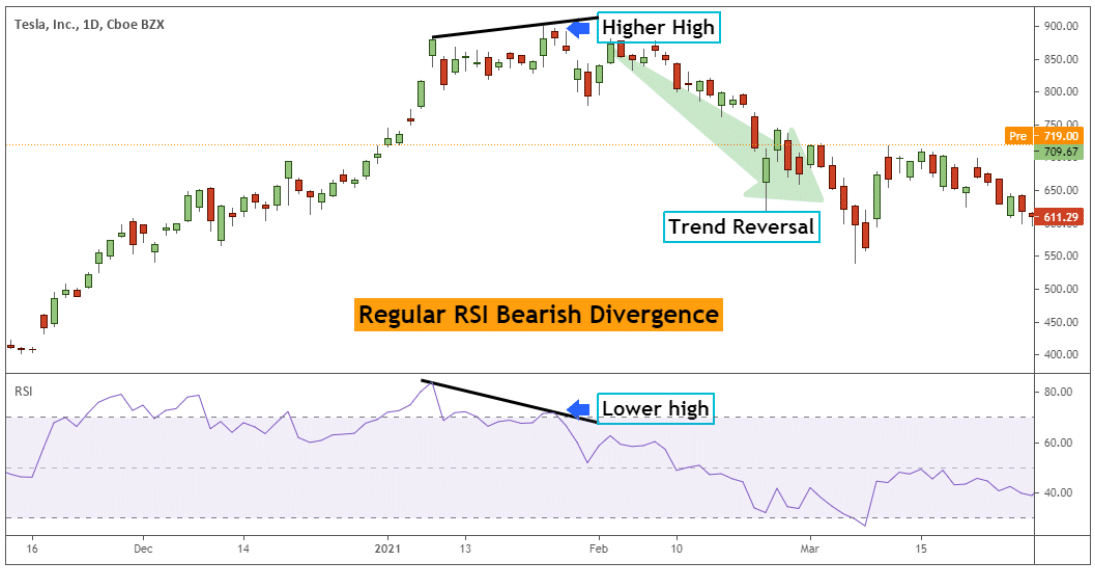
Bearish Divergence RSI
The price makes higher highs in a regular bearish RSI divergence, but the RSI oscillator prints lower highs.
In the example below, traders can see that the price is making a new higher high compared to the previous swing high point on the price chart.
At the same time, the RSI indicator prints a lower high relative to the previous high printed on the RSI oscillator. Following the RSI bearish divergence, the price started reversing quickly, and a new trend emerged.
Lastly
In summary, traders need to know that regular divergence signals a trend reversal, while at the same time, the hidden divergence signals a trend continuation.
Trend following traders are better off focusing on identifying hidden divergence as this will help them ride the overall market trend. Because the hidden divergence is a trend continuation signal, out of the two types of divergence, the hidden divergence carries a higher rate of success.
Last but not least, trading divergence works across all time frames; however, the higher the time frame is, the more reliable the divergence signal tends to be.
Note: You can get your free divergence cheat sheet PDF below.
