As technology has developed, so have the tools available to technical analysts. These days, you would be hard-pressed to find any analysts trading in the financial markets that do not rely on the use of indicators.
Indicators are mathematical calculations designed to provide insights into the probable price movements of a security in the future.
The insights these indicators provide are based on various metrics such as trading volume and historical price data. They provide technical analysts with specific information that they use to inform their trading decisions.
This post discusses one specific indicator known as the Andrews Pitchfork indicator.
NOTE: You can get your free Andrews pitchfork PDF trading guide below.
Table of Contents
What is the Andrews Pitchfork?
The Andrews’ Pitchfork is a technical indicator used to identify support and resistance lines and highlight potential breakout and breakdown levels. It was developed by Alan Andrews and is described as a pitchfork due to the pattern that its price movements make on a price chart.
You can see an example of Andrews’ Pitchfork below.
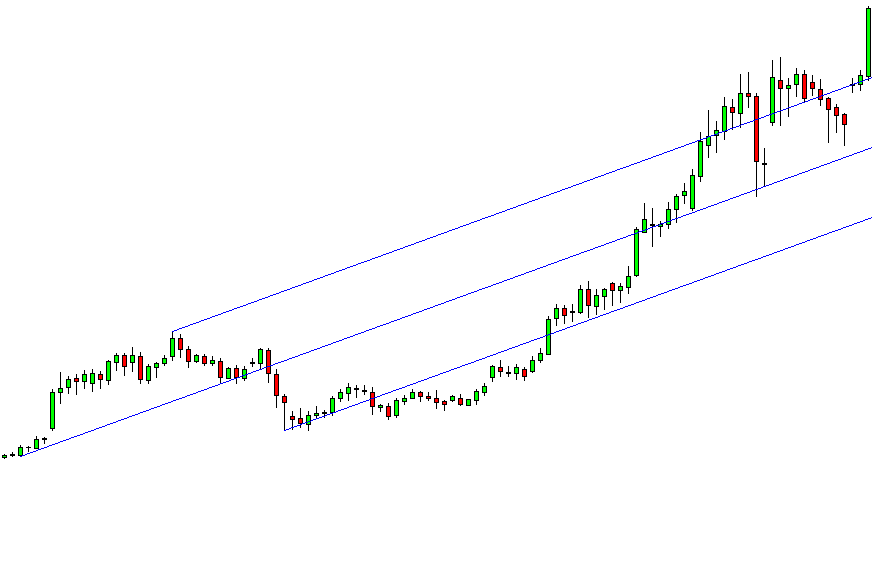
If you examine the chart above, you will see a central “median” line running through the center of the pitchfork.
Through study and observation, Mr. Andrews concluded that the price of a security would gravitate toward the median line 80% of the time. Wild price fluctuations could account for the remaining 20%.
The general approach to trading with this pitchfork indicator is found in these wild price fluctuations. Since you know that the price will generally retrace towards the median line, you can enter long or short positions when the price moves away from this median line. This is a fundamental trading strategy using the Andrews’ Pitchfork indicator.
Further down on this post, we will examine a more sophisticated approach to trading this indicator in more depth.
How to Draw Andrews Pitchfork
Drawing Andrews’ Pitchfork on a price chart is fairly straightforward. The pattern uses three parallel lines created with three points at the end of a previous trend. You would then draw a line from the first point through the midpoint of the other two points.
You do not need any advanced drawing tools to plot Andrews’ Pitchfork on a price chart.
Let’s examine seven simple steps to draw Andrews’ Pitchfork yourself.
- Identify the beginning of a trend. The trend can either be an uptrend or a downtrend. This will be point 1.
- Points two and three will be drawn at the pivot points (the reaction highs and lows of the uptrend/downtrend).
- Point 1 will be your starting point for the median trend line. You can draw this line now.
- The distance between points 2 and 3 represents the channel width.
- At this point, draw and extend a trend line from point 1 through the midpoint of points 2 and 3.
- Once this is done, draw and extend trend lines from points 2 and 3 parallel with the median trend line drawn in step 3.
- If needed, you can change the slope of the pitchfork by changing point 1. This may need to be done as; occasionally, the established slope will not be realistic. Pitchforks that are too steep will easily break, and pitchforks that are too flat will not accurately capture the trend.
Andrews Pitchfork Trading Strategies
Whilst there are many different trading strategies with Andrews’ Pitchfork, they are centered on the same three basic principles.
Firstly, prices typically move around the median line. When examining the price movements of a security using a pitchfork, you should note that the price movements generally revolve around the median line the majority of the time.
Secondly, when the price breaks away from the median line, there is an 80% chance that the price of that security will regress to this median line.
The final principle is that when the price of the security breaks through the range of the pitchfork in the opposite direction of the general trend, this represents a signal for a potential reversal in the trend.
Since we know that this trend reversal signal exists, one of the most popular strategies for trading an Andrews’ Pitchfork is based on this final principle and involves trading breakouts outside the expected range. Let’s take a look at how we might do this in a situation where the uptrend is about to reverse after a bearish breakout.
Assume that you are observing a price chart and notice a potential breakout. At this point, you should wait for the breakout to be confirmed. This confirmation will occur when the price falls below the pitchfork indicator to create a bottom before rising again to the bottom of the pitchfork, testing the resistance.
After this resistance has been tested, the price has a high probability of falling back to its bottom. If the price falls below this bottom, the breakout has been confirmed, and you can begin to enter your short positions.
As always, you should look for your entry point and keep an eye out for a good position to set your stop loss. In this trade, you should set your stop-loss order at the resistance level that was tested before the price fell back to its bottom.
Similarly, your profit target should be twice as much as your risk. Therefore, if you enter a $200 position and have a stop-loss order at $180, your take-profit order should be at $240, twice the amount you stand to lose.
Andrews Pitchfork Indicator for MT4 and MT5
The Andrews pitchfork indicator is built right into your MT4 and MT5 charts with no other downloading required.
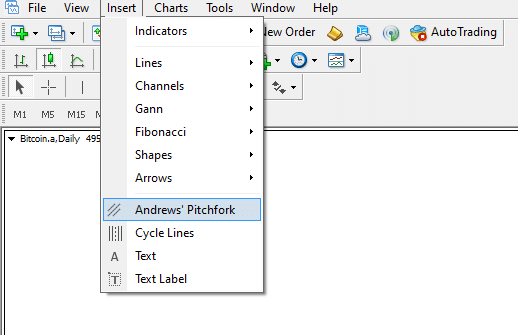
To use the Andrews pitchfork on your Metatrader charts, follow these steps.
- Open your MT4 or MT5 charts.
- Click on ‘insert’ and then ‘Andrews pitchfork’.
- You will now be able to select the points on your chart where you want the indicator placed.
Note: Don’t know how to install and use these indicators? Read How to Download, Install and Use MT4 and MT5 Indicators.
Lastly
Unfortunately, there is no concrete methodology for placing the various points when it comes to Andrews’ Pitchfork. Instead, it would help if you use your own judgment when placing these channels.
As with most aspects of technical analysis, there is a subjective component that is required to succeed. This subjective component is why you need to build experience by experimenting with the indicator before using it in a live setting.
Since reliably placing these three pitchfork points will be the key to successfully using this indicator, traders must have the experience necessary to do this before risking any significant amount of capital.
