American trader Bill M. Williams was born in 1932 and went onto create revolutionary trading indicators, books and trading theories.
Williams has now been trading for over half a century and has revolutionized the way traders look at their charts and use indicators.
In this post we will look at who exactly Bill Williams the trader is, the books he wrote and the famous indicators he created.
Table of Contents
Who is Bill Williams the Trader?
Bill Williams is a famous author, indicator inventor and technical analysis trader.
In the 1990s Williams began to receive recognition because of his series of books on ‘chaos theory’.
Bill Williams is most popularly known for his suite of indicators that he created including; Accelerator Oscillator, Alligator indicator, Awesome Oscillator, Fractals Indicator, Gator Oscillator and the Market Facilitation Index.

A lot of trading platforms today have Bill Williams indicators built directly into their charting platform. An example of this is MT4 that has a tab set out just for Bill Williams indicators.
Williams proposed that the financial and trading markets can never fully be known by anyone.
His suggestion and strategy to making money in the markets was looking at the behavioral side of a trade, rather than stressing about the fundamentals.
Bill Williams had a psychology and engineering degree that helped him build a better understanding behind the behaviors of the market.
Williams identifies himself as a trend trader where he tries to align with the markets and the perceptions of where the value lies.
Bill Williams Indicators
Accelerator Oscillator
The Bill Williams Accelerator Oscillator was created to identify early changes in the force of a move that a market or asset was making.
Williams proposed that before the trend changes, the momentum also changes.
This indicator is created out of his other indicator the Awesome Oscillator.
Whilst the Awesome Oscillator – AO gains an insight into market momentum, the Accelerator Oscillator identifies early market changes by subtracting a 5-period SMA off the AO.
Alligator Indicator
The Alligator Indicator creates trading signals using convergence and divergence.
The Alligator Indicator is created by using three smoothed moving averages (SMA). The first SMA is set at five, the second at eight and last at 13. These are all Fibonacci sequence numbers.
The Alligator Jaw makes the slowest turns and the lips make the fastest identifying possible trade setups.
Awesome Oscillator
The Awesome Oscillator or AO is used to identify the current markets momentum.
The AO identifies momentum by calculating the difference between the 34 period and 5 period simple moving averages.
This is a good indicator if you are looking to find a possible market reversal or to confirm you have found a trend.
Fractals Indicator
Fractals in the non financial space are known as a pattern that is recurring.
Within the trading and investment space, the Fractals indicator is used to spot potential market turning points and recurring patterns. This is achieved with drawn arrows on your chart.
If price shows a potential bearish fractals pattern it could signal a move to the downside, and a bullish fractals pattern could indicate a move higher.
Gator Oscillator
The Gator Oscillator indicator is derived from another Bill Williams indicator, the Alligator. This indicator is often used to time entries and exits.
The Gator Oscillator is created with two lines, one positive and one negative.
This is achieved by deriving the balance lines from the Alligator indicator and creating two values.
The positive and negative values are the difference between the two balance lines.
This indicator can be used with the Alligator indicator to find and then time quality trade setups.
Market Facilitation Index
The market facilitation index is used to look at a current price movement and measure its strength.
If you have found a potential trade, then this indicator could help you decide one way or another if the trend is strong enough to make an entry. It could also help you spot potential new trends forming.
The Market Facilitation Index creates a second chart below your main price action chart to show you the price changes per tick and plots.
How to Use Bill Williams Indicators in MT4 / MT5
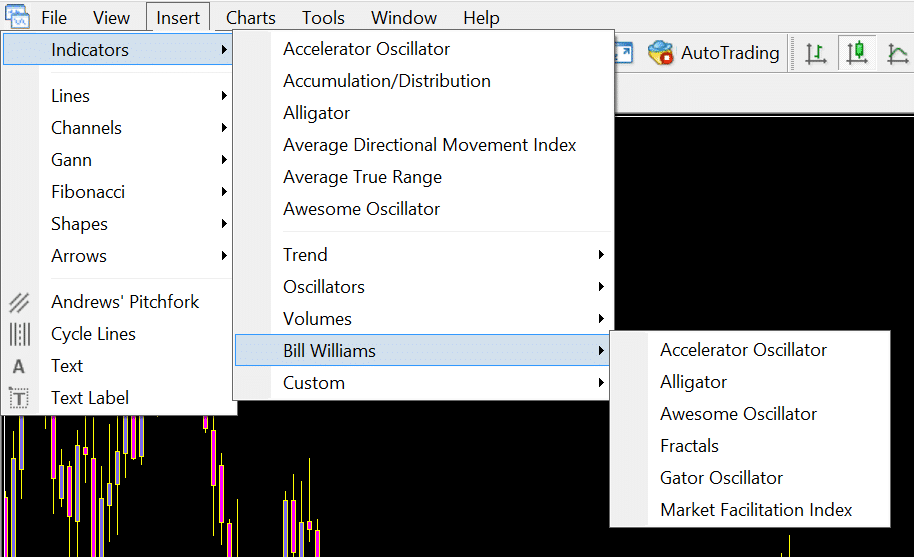
As mentioned earlier, MT4 and MT5 include the suite of Bill Williams indicators in a very easy to get to indicators tab.
As the image shows below; to use any of these Bill Williams indicators discussed, just open your MT4 / MT5, go to “Insert” >> “Indicators” >> “Bill Williams”.
Lastly
Bill Williams has created a lot in his lifetime and left a lot for traders to use to profit in their own trading.
Make sure when testing the Bill Williams indicators and other strategies you first do so on a free demo account before ever risking any real money.
As with any new strategy, make sure you are profitable on a demo account and only then risk real cash.
