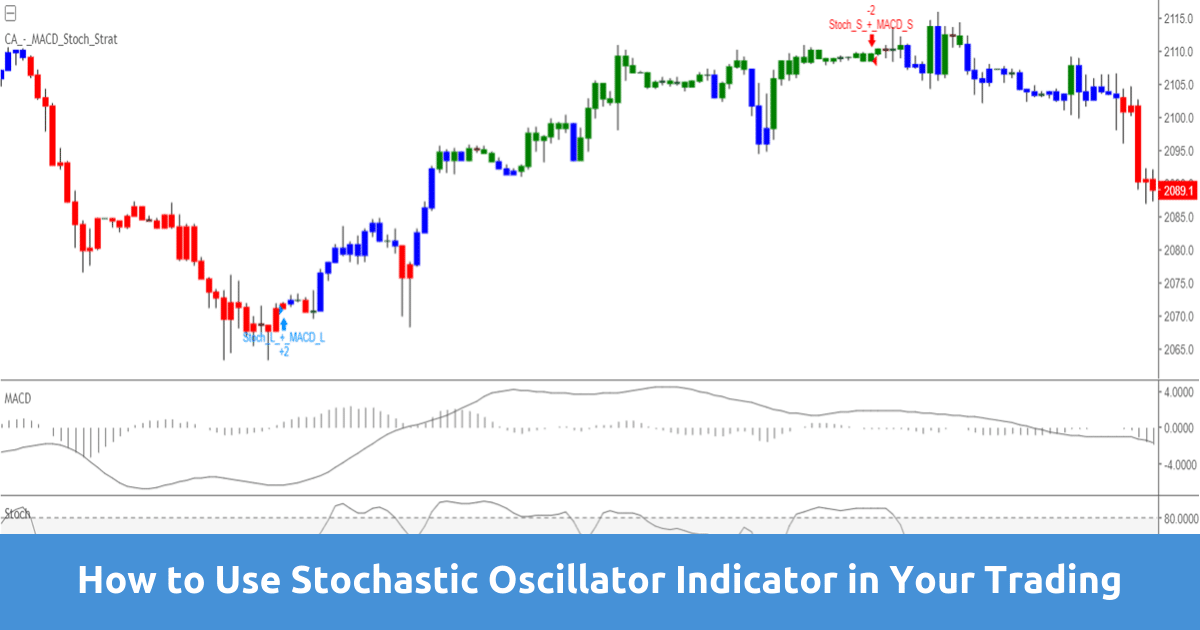
Different kinds of indicators have been developed to help us confirm the quality of a certain chart pattern or build our own buy and sell signals. If you are looking for a technical investment analysis tool that lets you determine where a trend might be ending, then stochastic oscillator is what you are looking for.
Here’s what you should know about stochastic oscillator.
NOTE: Get Your Free Stochastic Oscillator Indicator PDF Download Below.
Table of Contents
What is Stochastic Oscillator?
Developed in the 1950s, the stochastic oscillator is a momentum indicator that measures the relationship between a closing price of the security to its price range over a given period of time.
Using the process of stochastic oscillator helps traders determine the best time when to buy or sell the security. It helps a trader predict price swing turning points by comparing the security’s closing price to its price range. This type of indicator uses support and resistance levels.
Stochastic Signals
There are a few main strategies you can use the stochastic oscillator to find solid trade signals in the market that include;
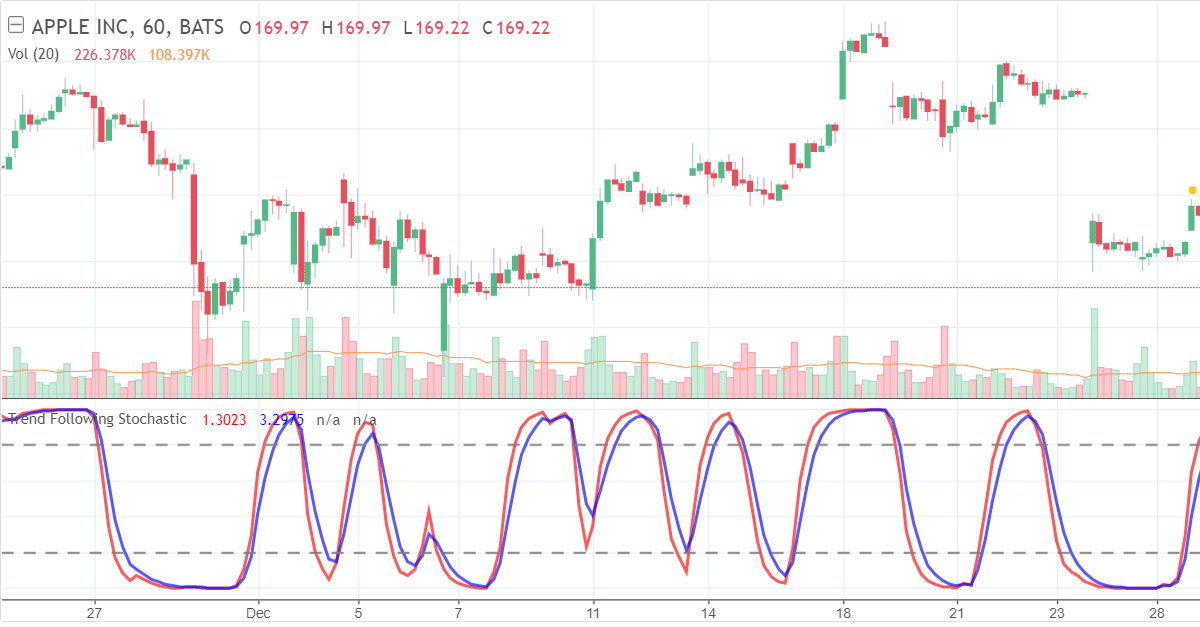
Trend Following
The trend is still valid as long as the stochastic keeps crossed in one direction.
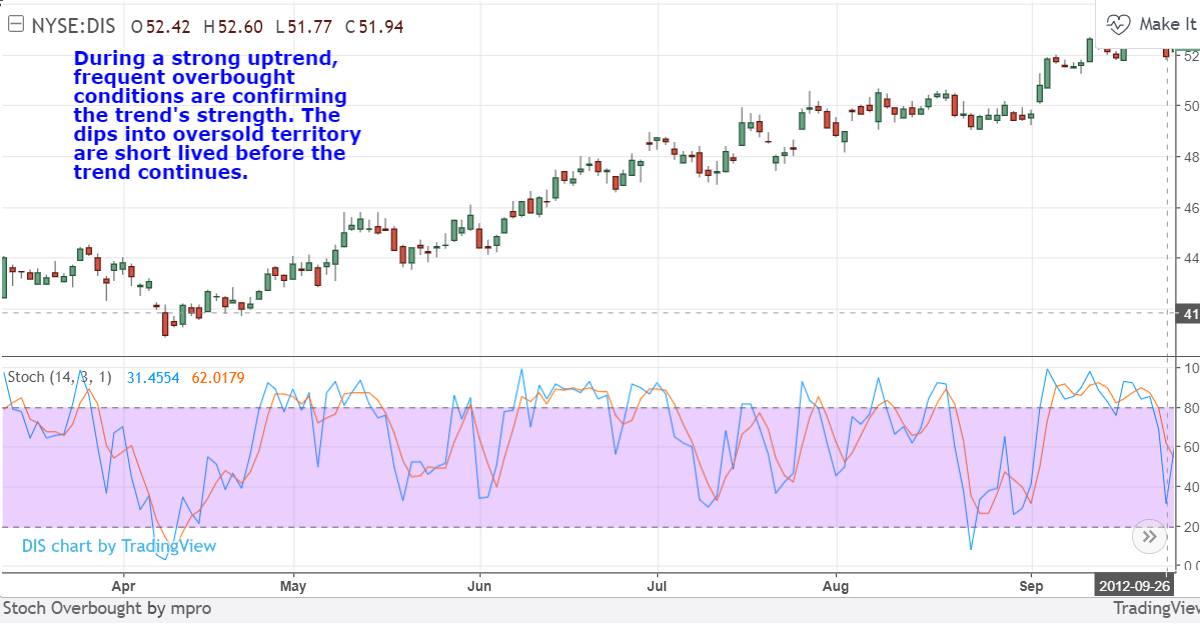
Strong Trends
Stick with the trend when stochastic is in the oversold/overbought area. Do not fight it.
Breakout Trading
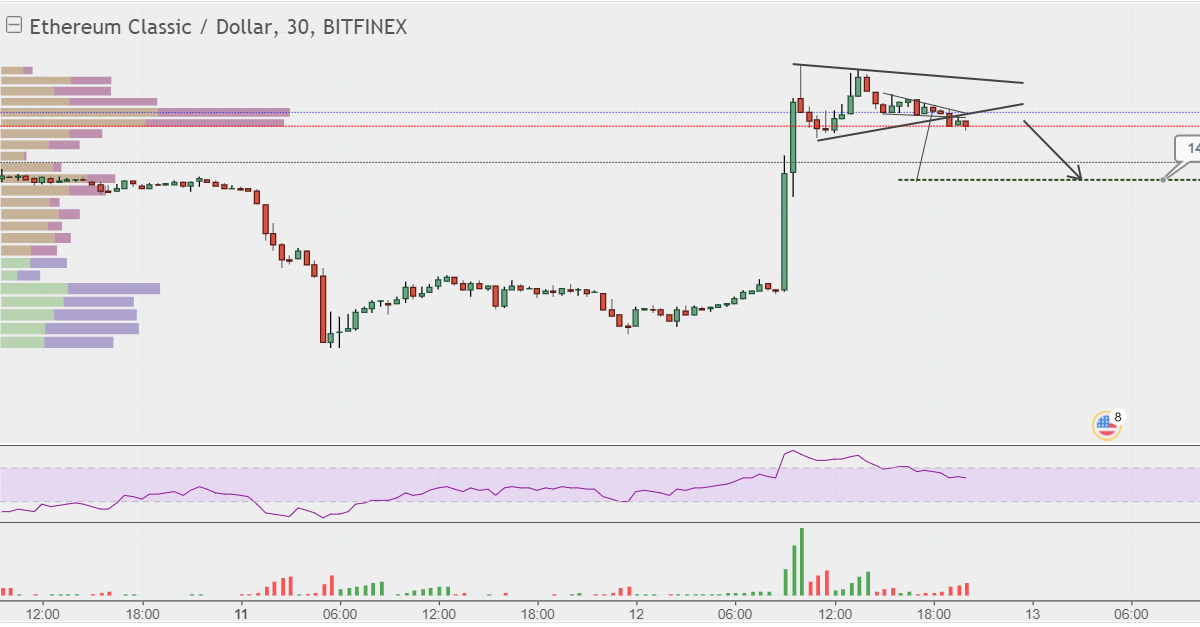
If the stochastic suddenly accelerates in one direction and the two stochastic bands are widening, then it can determine the start of a new trend.
Trend Reversals
When a stochastic is changing direction and leaves the areas of where the overbought/oversold occurred it may indicate a new reversal.
You can also combine moving averages or trend-lines on the stochastic to confirm this as we will discuss in a moment.
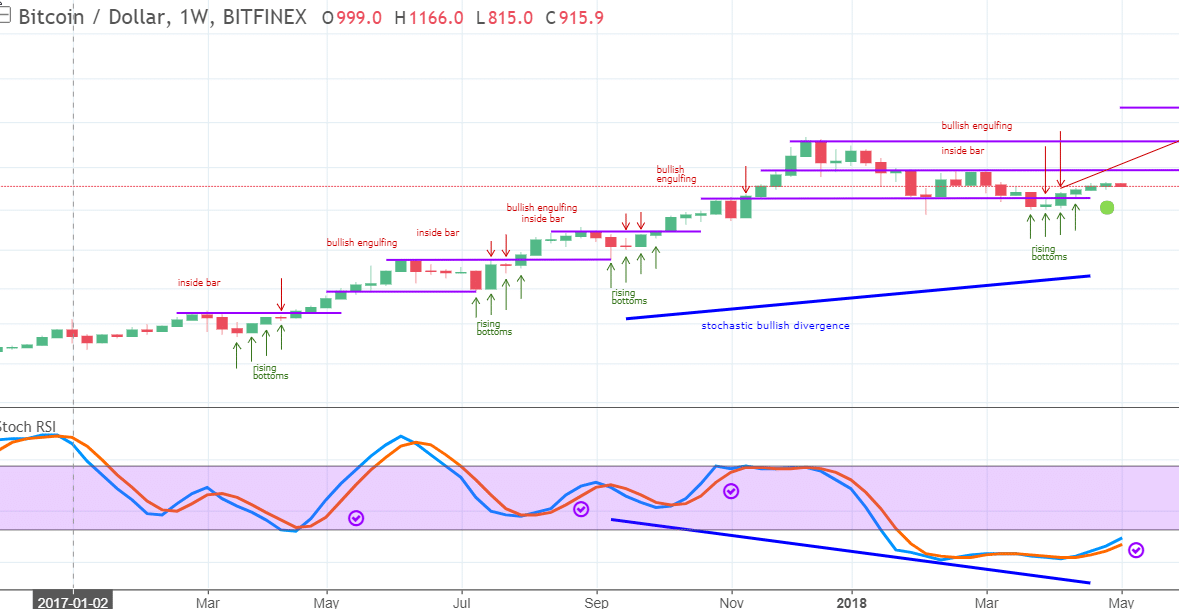
Divergence
With every momentum indicator, divergence is important as it helps show potential trend reversals.
What Stochastic Settings Should be Used?
14 periods are the default settings of stochastic oscillator.
The 14-period can either be days, weeks, months, hours, or even an intraday time frame. The next one is a 3-day SMA default settings for the %D. The stochastic oscillator has two numbers (%K and %D) which is explained below.
What Markets are Stochastic Oscillator Used?
The best way to trade the stochastic oscillator is in a ranging market rather than a trending market. Trending markets require lagging indicators such as MACD (simple, weighted, exponential moving average are also in this category) as it will keep you in a trend as long as the trend remains intact.
Moving averages tend to flatten in a sideways market and offer no useful information, thus lagging indicators are deemed useless in a trading market.
Ranging markets are tricky to trade because despite using oscillators, there will still be an increased frequency of signals, both buy and sell. That is why the use of stochastic is best in a ranging market.
How to Use the Stochastic Oscillator in Your Trading?
Originally the use of the stochastic indicator was to follow the momentum of a price, however, its current use is to identify an overbought and oversold security. To determine if the security is overbought or oversold, the stochastic is scaled from 0 to 100.
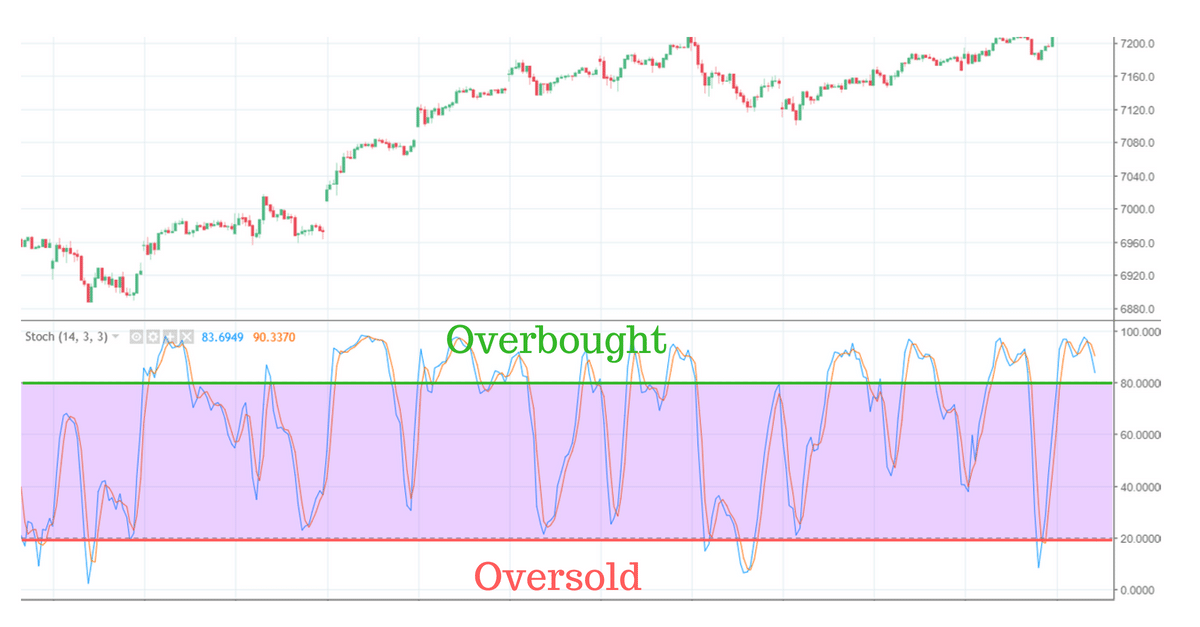
As you can see from the image above, there are two lines referring to Overbought and Oversold. The blue line in the chart above is the %K line, and the orange line is your %D line.
The security is considered as overbought when the stochastic lines are above 80 (green line in the chart above). When the chart indicates that the security is overbought, it means that it is expensive or it is the best time to sell a security.
In contrast, if the stochastic lines are below 20 (red line in the chart above), it means that the security is oversold.
When the chart indicates that the security is oversold, it means that it is cheap and worth buying. You can calculate the stochastic oscillator by determining two numbers.
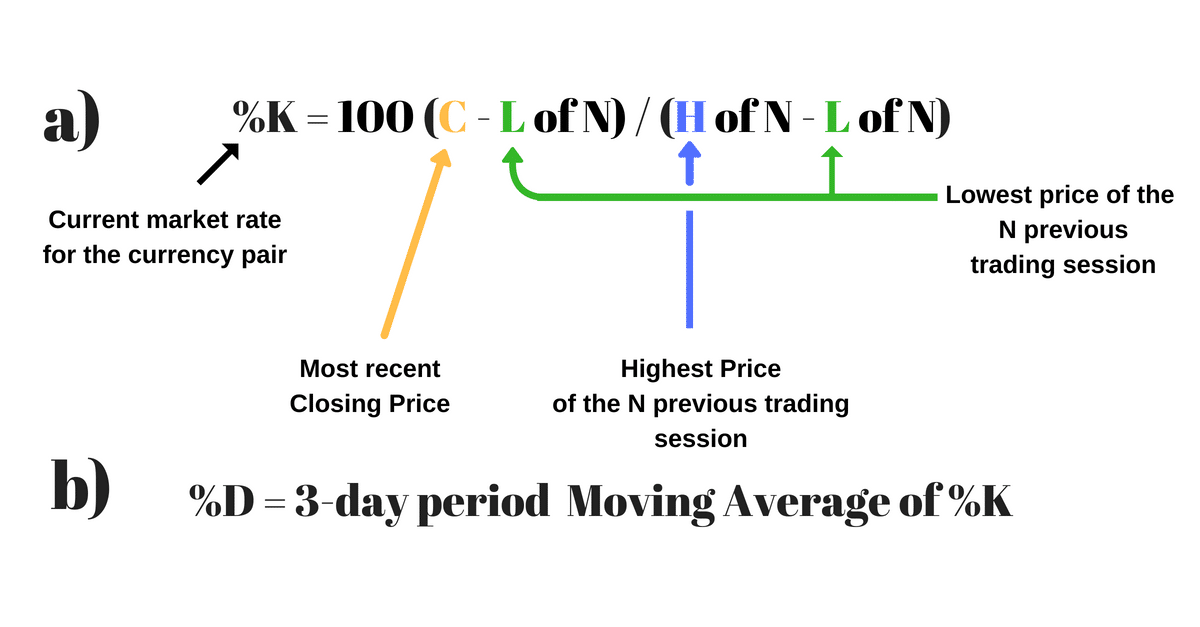
As shown above, the FIRST is a formula,
%K = 100 (C – L of N) / (H of N – L of N)
As mentioned before, 14-period is the default setting of stochastic oscillator, meaning that the value of N is 14 and 3 for the %D.
The SECOND factor,
%D which is a 3-period moving average of %K.
The formula for %D line is %D = 100 X H3 / L3. The numbers are then plotted on a graph side by side so that analysts may look for fluctuations between 0 and 100.
How to Use the Stochastic Oscillator with Price Action and other Indicators?
Stochastic Oscillator with Price action
The use of stochastic oscillator is best with price action when looking for support and resistance levels. To find those levels, you use the stochastic indicator as a guide and price action to tell us when the markets are either overbought or oversold at any given time using the one-hour chart and confirming it on the 4-hour chart.
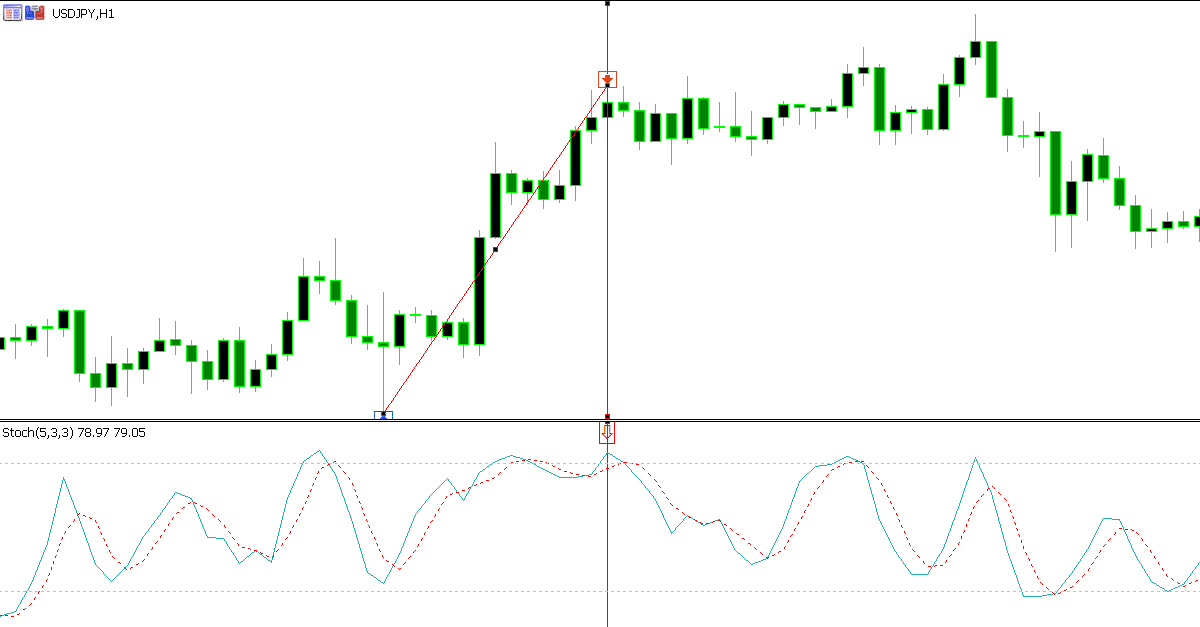
As shown above in the 1-hour chart, we can see a swing low and a swing high. Notice that in the stochastic indicator that it is overbought. After that, we move to the 4-hour chart.
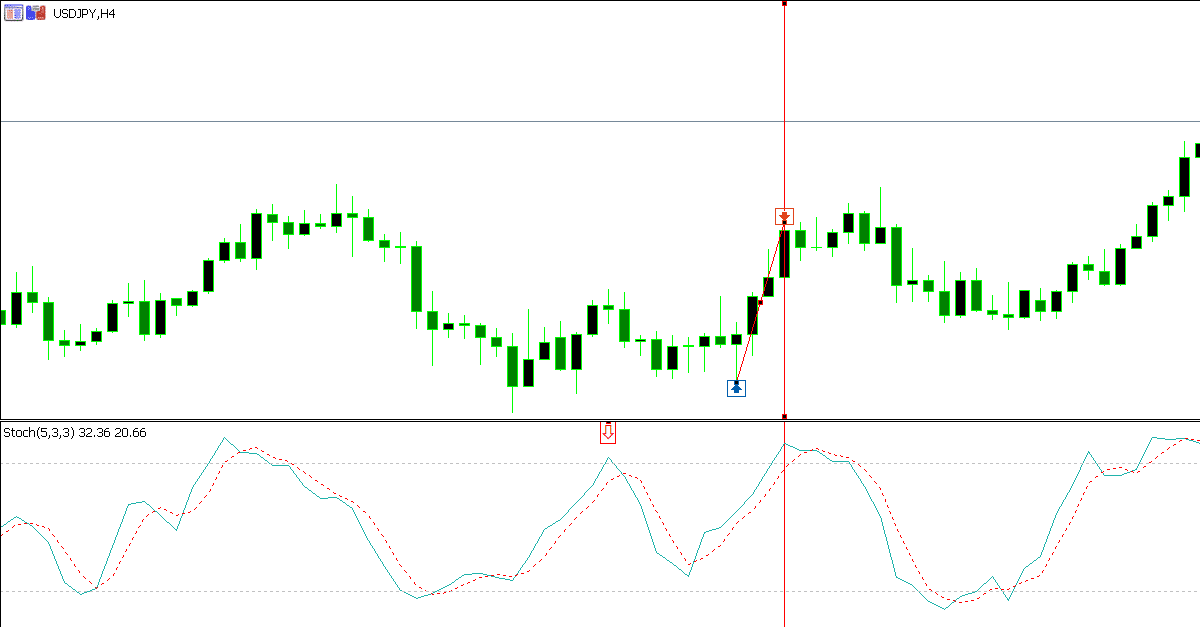
If the 1-hour and the 4-hour chart indicate that it is overbought, then that becomes a very high probability setup to trade.
Stochastic Oscillator with MACD
The MACD – Moving Average Convergence Divergence indicates price trends and direction, whilst the stochastic oscillator compares a stock’s closing price to its price range over a period of time.
This is what makes these two indicators work well together because stochastic compares a stock’s closing price to its price range over a certain period of time, while the MACD is the formation of two moving averages diverging from and converging with each other.
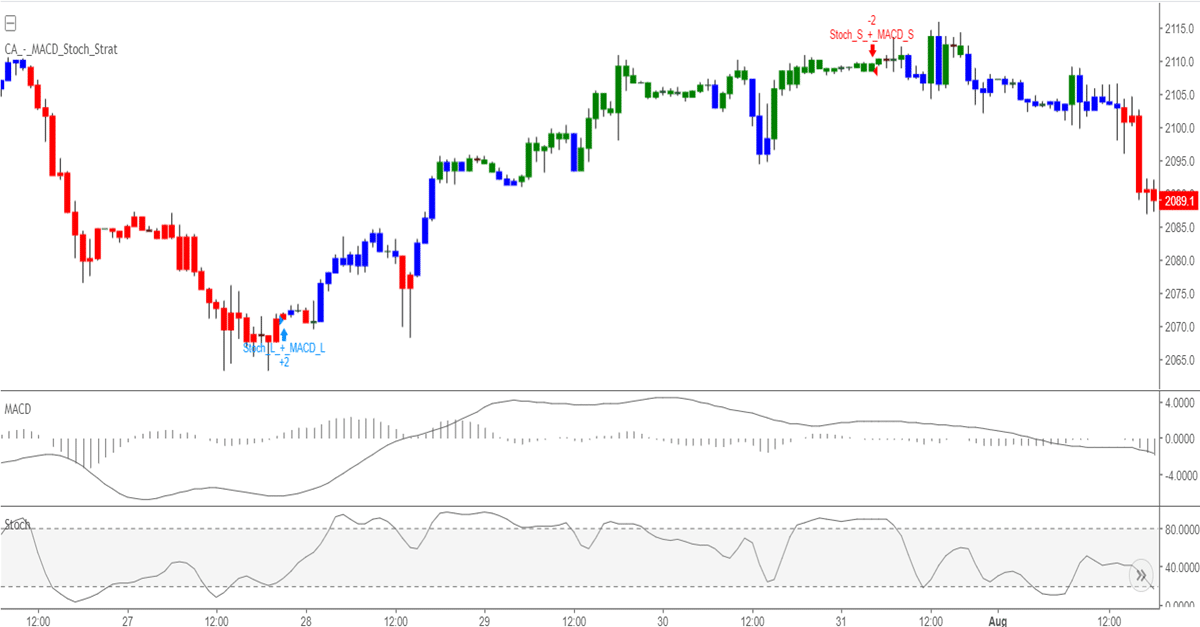
When using these two indicators, look for the bullish crossover to occur within two days of each other. The crossover typically occurs below the 50-line on the stochastic to get a longer price move.
Preferably you might want the histogram value to move higher than zero within the two days you placed your trade.
Stochastic Oscillator with RSI
The use of stochastic RSI in technical analysis is to provide a stochastic calculation to the Relative Strength Index (RSI).
In short, stochastic RSI indicator is an indicator of an indicator.
This indicator ranges between 0 and 1 which is then plotted as a line. Rather than standard price data, it is created by applying the formula of a stochastic oscillator to a set of RSI values.
The difference of using the stochastic RSI is that it improves sensitivity and generates a higher number of signals than the traditional indicator.
You can calculate stochastic RSI by using this formula.
StochRSI = (RSI – Lowest Low RSI) / (Highest High RSI – Lowest Low RSI)
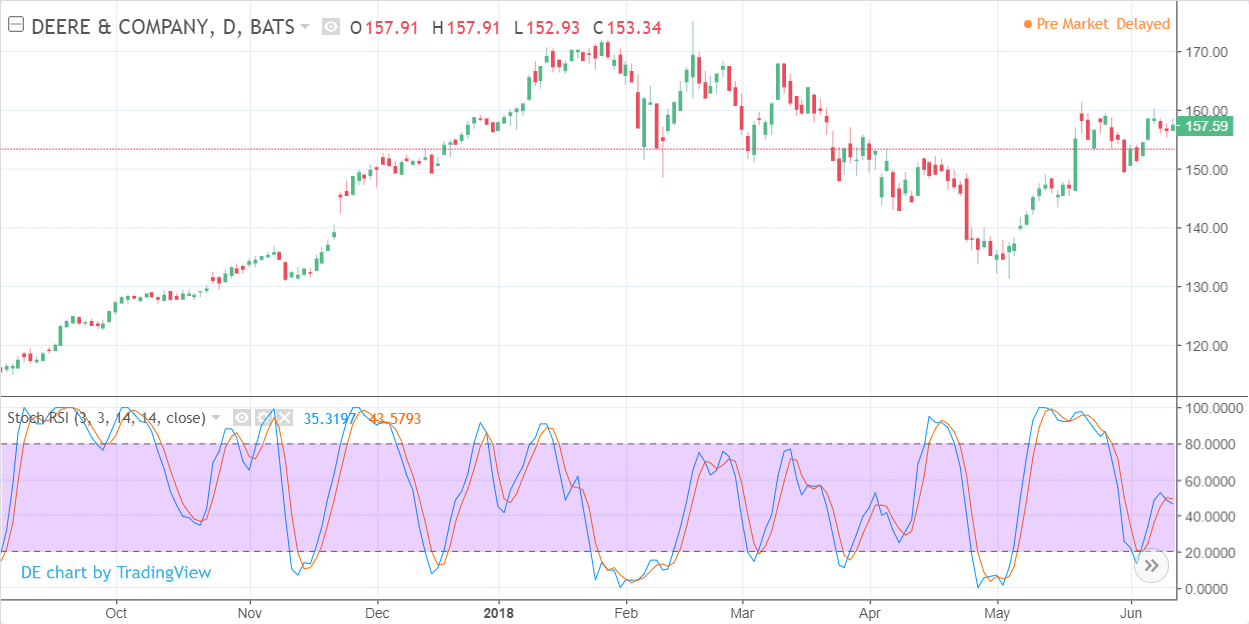
The stochastic RSI doesn’t always look similar to the price, meaning it’s a derivative of price.
An indicator is considered as oversold when the value drops below 0.20, meaning that the RSI value is trading at the lower end of its range and that the short-term direction of the underlying security may be nearing a correction.
On the other hand, a reading above 0.80 indicates that the RSI may be reaching extreme levels and you can use it to signal a pullback in the underlying security.
Recap
The stochastic oscillator provides trade signals to let you know where the trend might be ending. You can use it in many different ways, such as overbought/oversold levels, divergences, and bull/bear trade setups.
Many traders often misinterpret the stochastic indicator and it is an indicator that need practice to perfect.\
NOTE: Get Your Free Stochastic Oscillator Indicator PDF Download Below.
