Whenever you are executing a trade, you will normally use various indicators either to confirm, analyze, or identify trading opportunities.
One of these indicators is the CCI or the Commodity Channel Index, which traders use to determine whenever an investment vehicle is close to reaching an oversold or overbought condition.
This is a momentum-based indicator, similar to the RSI or other similar indicators.
In this article, you will find out what the CCI indicator is, the optimal settings for you to use it, some trading strategies, and the CCI indicators on the MT4 and MT5 platforms.
NOTE: Want a full list of some of the best free MT4 and MT5 indicators you can use in your trading? You can get them below.
Table of Contents
What is the CCI Indicator?
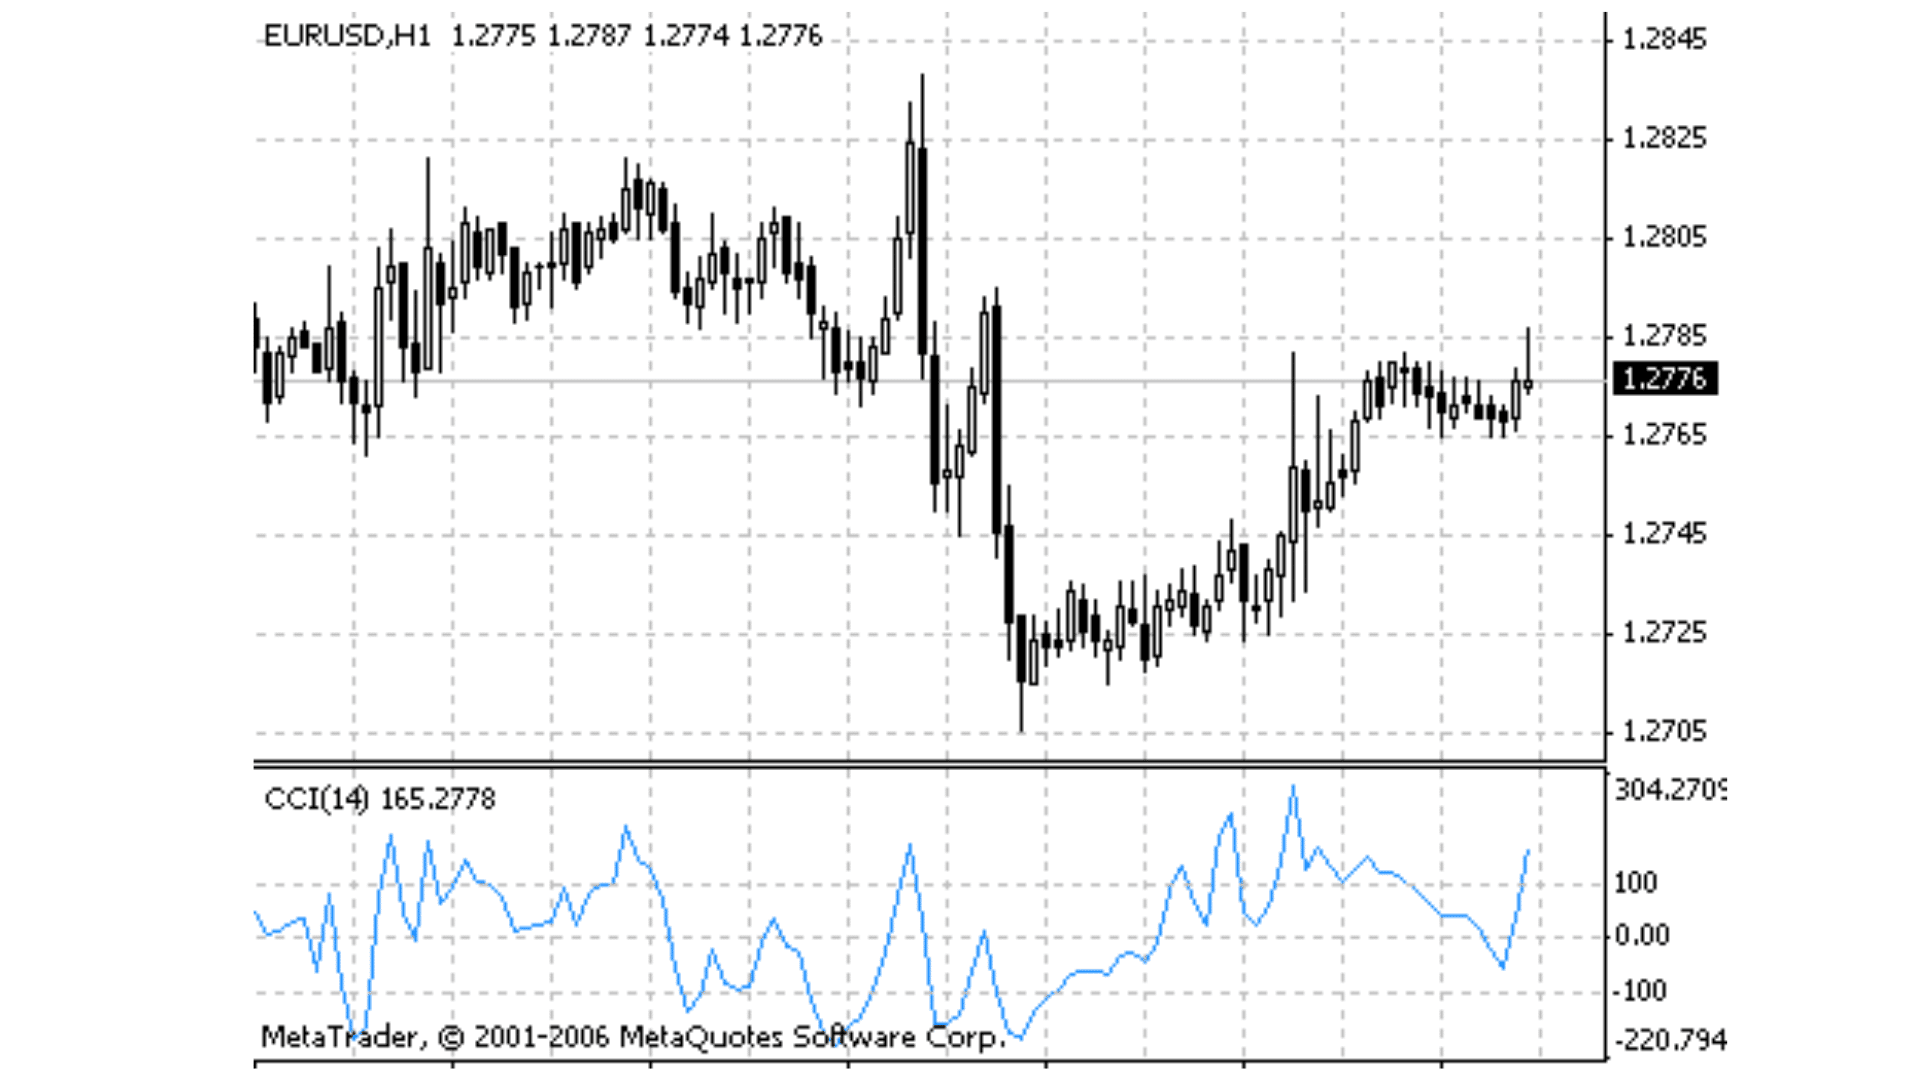
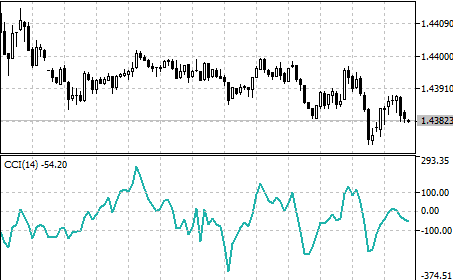
The CCI indicator is an oscillator that can identify cyclical trends in the price of a security.
Most securities move upwards and downwards cyclically, with bull markets followed by bear markets and vice versa. In such situations, identifying where the security’s price has reached its upper or lower limit and is going to reverse can be a handy indicator to use for opening trades.
The CCI gained its name as the Commodity Channel Index because it was initially used only for commodities; however, it is now used to analyze stocks.
The base for a CCI is the zero line; however, there is no limit to how high or low the value of the CCI can be. The default period for the indicator can be anywhere between 14 and 31 periods. Most people tend to pick a number between these depending on their trading strategies.
Picking a smaller number will result in a highly sensitive indicator, and the noise might increase. The formula for the CCI indicator can be given as:
CCI = (Typical Price – Moving Average) / (0.15* Mean Deviation)
The typical price in this scenario is the average of the particular day’s high, low, and close prices. The moving average is the average of the typical prices over the time period chosen.
The mean deviation is also carried out by analyzing the differences between the typical prices and the moving average. While the exact method in which traders use this indicator might vary, the consensus is that a CCI score greater than 100 indicates an overbought security. A CCI score below -100 indicates an oversold security.
This information can then be used in conjunction with other trading strategies as a confirmation or an indicator.
NOTE: You might also like the rate of change indicator.
CCI Indicator Best Settings
The main parameter that you have to enter while using a CCI indicator is the time period. As mentioned earlier, the normal period used can be anywhere between 14 and 30 periods.
A period here is the duration of your candlestick, which could be one minute, an hour, or a day. Using a shorter range, for example, 10 periods, might make the CCI very volatile and give you a lot of noise.
Overly sensitive indicators can provide misleading data and indicate that a security is overbought or oversold when it isn’t. The greater the time period chosen, the less likely it is that the CCI value will go beyond the range of -100 to 100. A short-term trader might choose to have only 15 periods in their CCI to have more signals.
However, long-term traders might opt for longer periods to eliminate noise and only trade on the surest signals.
The only other parameter you need to enter on any trading platform you are using apart from the time period is the candlestick duration.
Usually, long-term traders use daily or weekly candlesticks, whereas short-term traders might use hourly or even minute candlesticks. The shorter your candlestick duration, the higher the noise will be because while securities move cyclically in the long run, these cycles might not be as well-defined or as prominent in the short run.
CCI Indicator Strategies
A fundamental CCI indicator strategy is to rely on the “-100 to 100” range. A CCI number above 100 is a sell signal because it indicates that the security has been overbought and is ripe for a turnaround, and a number below -100 is a buy signal.
Traders can either trade on both buy and sell signals or use one as an entry and the other as an exit opportunity.
Multiple Timeframe CCI Strategy
At the same time, more nuanced and complex strategies can also be used to trade on the CCI indicator. Two CCI indicators are used in this strategy, one with a longer period and another with a shorter period.
The long-term chart can establish the major trend that security has been following over time. The short-term chart can be used to identify entry and exit opportunities for the security. Most active traders prefer this strategy.
A straightforward example of how this strategy can be used is demonstrated through an example. Say the long-term CCI moves above +100; this indicates an upward trend in the security and that the overall market is bullish. After establishing the overall market sentiment using the long-term chart, you would look for buy signals on the short-term CCI chart.
Combining the two time frames can result in a strategy that will ensure that you are always on the right side of the overall trend on the security. While this will reduce the number of actionable signals by eliminating around half of all setups at any given point, it will allow you to make higher probability trades.
CCI Indicator MT4
The MT4 CCI indicator can be used for two main purposes: the first is to identify divergences or reversals in the share prices, and the second is to identify when a particular stock price might be overbought or oversold.
You can add it to your trading platform by following these steps:
- Enable the CCI indicator on the MT4 platform.
- Enter the time period you wish to use based on the type of trading strategies you will apply.
- Select an appropriate candlestick duration for your trading strategies.
- Establish the range on which you are going to trade. While most traders use -100 to 100, you can adjust this figure based on your own requirements. If you were to increase the range, it would result in fewer signals on which you can trade, and if you chose to decrease the range, it would mean more signals for you to trade on.
You can read about and get the CCI indicator for MT4 here.
CCI Indicator MT5
The CCI indicator for the MT5 trading platform works in roughly the same way as that on the MT4 platform, with one key difference.
On the MT5 platform, you can trade a variety of other instruments aside from just forex.
As mentioned earlier, while the CCI was created mainly for commodities, but it is now used on stocks and CFDs too, and the MT5 platform allows you to do so.
The steps to do so are pretty much the same as they were on the MT4 platform, in that you select the indicator, plug in the time periods and the candlestick duration based on your trading strategies, select the range on which you are deciding to trade, and then begin trading.
You can read more about and get the CCI indicator for MT5 here.
Note: Don’t know how to install and use these indicators? Read How to Download, Install and Use MT4 and MT5 Indicators.
Lastly
The CCI indicator is a useful and highly relied-upon momentum indicator that indicates a trader when a particular security has been overbought or oversold.
It can be calculated using the typical prices and the mean deviations of the security’s price over a defined period of time.
You can use the CCI indicator as a single indicator or in a combination: the long-term CCI setting the trend and the short-term CCI indicating entry and exit opportunities.
It is quite easy to add the CCI indicator to both your MT4 and MT5 platforms, and you should definitely consider this indicator as a confirmation before making any trades.


