Whenever you are trading on the market, you will rely on various indicators to ensure that you are making the right decisions. These might include candlestick charts, indications of trends, and other statistical indicators such as Moving Averages and Bollinger Bands.
Identifying the right indicators that work for you and are best for your trading strategy is an essential part of making sure that you can trade profitably.
One of the leading indicators traders use is the Rate of Change Indicator, also commonly referred to as the ROC.
In this article, you will find out what the ROC indicator is, what settings you can change on the indicator, some examples, and how MT4 and MT5 ROC indicators work.
NOTE: Want a full list of some of the best free MT4 and MT5 indicators you can use in your trading? You can get them below.
Table of Contents
What is the Rate of Change Indicator?
A Rate of Change indicator measures the percentage change of the current price compared to the price a certain number of periods ago.
As the name suggests, it can be used to identify how quickly the change in the share price is occurring. The ROC indicator is used for various purposes, the most notable among them being to confirm price movements or to detect divergences in the stock price.
In addition to this, the ROC can also be used to identify when a particular stock might be overbought or oversold to make it easier for you to spot trend reversals.
The formula for the ROC is given as ROC = [(Current Price/Price before n periods) -] X 100. Usually, traders tend to use the closing prices of 14 days ago as the n; however, this can be modified quickly based on the preferences of the trader and the timeline on which they are trading.
For example, if the 14-day indicator is used on the S&P 500, it will divide the price of today’s market close by the price at market close 14 days ago. Then, the number will be subtracted by 1, giving the percentage change in the stock price from 14 days ago.
Rate of Change Indicator Settings
Depending on your preferred trading method and the strategies you employ, you will end up using the ROC indicator in very different ways.
For example, someone who makes trades using 1-minute candlesticks might use the ROC with an hour set as the designated time, and the ROC might serve as a confirmation for them. On the other hand, someone who trades based on the resistance and support levels might use the ROC to identify when the stock might be oversold or overbought.
The different scenarios and uses for ROC indicators have been discussed below.
As a Tool for Confirmation
The ROC Indicator can be used as a tool for confirming the direction of the price action and the general sentiment of the market.
For example, if you notice that the ROC is consistently showing higher lows, this is an indicator of a bullish market.
On the contrary, lower highs indicate the onset of a bearish market. Therefore, the ROC serves as a helpful confirmation tool that you can use to reconfirm your trades.
As an Indication for Overbought or Oversold Stock
If a trader observes that the ROC of a stock crosses a particular predesignated mark, say 10%, indicating that the stock has gone up 10% in the past two weeks, this might suggest that the stock is overbought. This might mean the wrong time for the trader to be buying the stock.
A similar scenario can be created for oversold stocks. Therefore, the ROC indicator serves as a signal to indicate when the stock might be in a dangerous zone ripe for a reversal, especially when this might not be visible from the candlestick chart itself.
If the ROC indicates that the stock is overbought, then a trader will avoid buying the stock since most of the upward momentum has already run out. Instead, the trader might begin looking for sell signals and opportunities to short the stock, as when the stock price reverses, it will create a strong bear market.
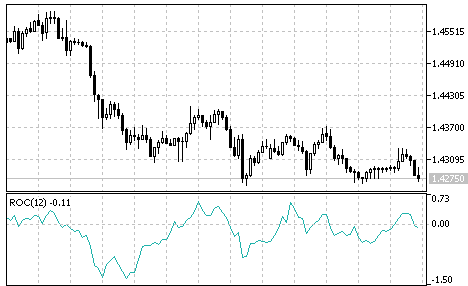
Rate of Change Examples
While most trading software calculates the ROC for you, it is still essential for you to know how this was calculated and how you can use this indicator for your trading strategies. This can be best explained using the example given below.
The rectangle on the right is an example of how the ROC can be calculated.
By dividing the candle price on the right to that of the candle on the left edge of the rectangle, the net answer was 1.0467. This means a positive 4.67% change in the stock price during this time, or that the price increased by 4.67%.
As seen at the bottom of the chart, the indicator has a baseline of 0. If the ROC is above the 0% mark, the stock price is moving upwards and is bullish. If the ROC is below 0, this indicates that the stock price is falling.
Most traders also set a safe range for the stock price movements, and they deem the stock to be overbought or oversold when it crosses out of this range.
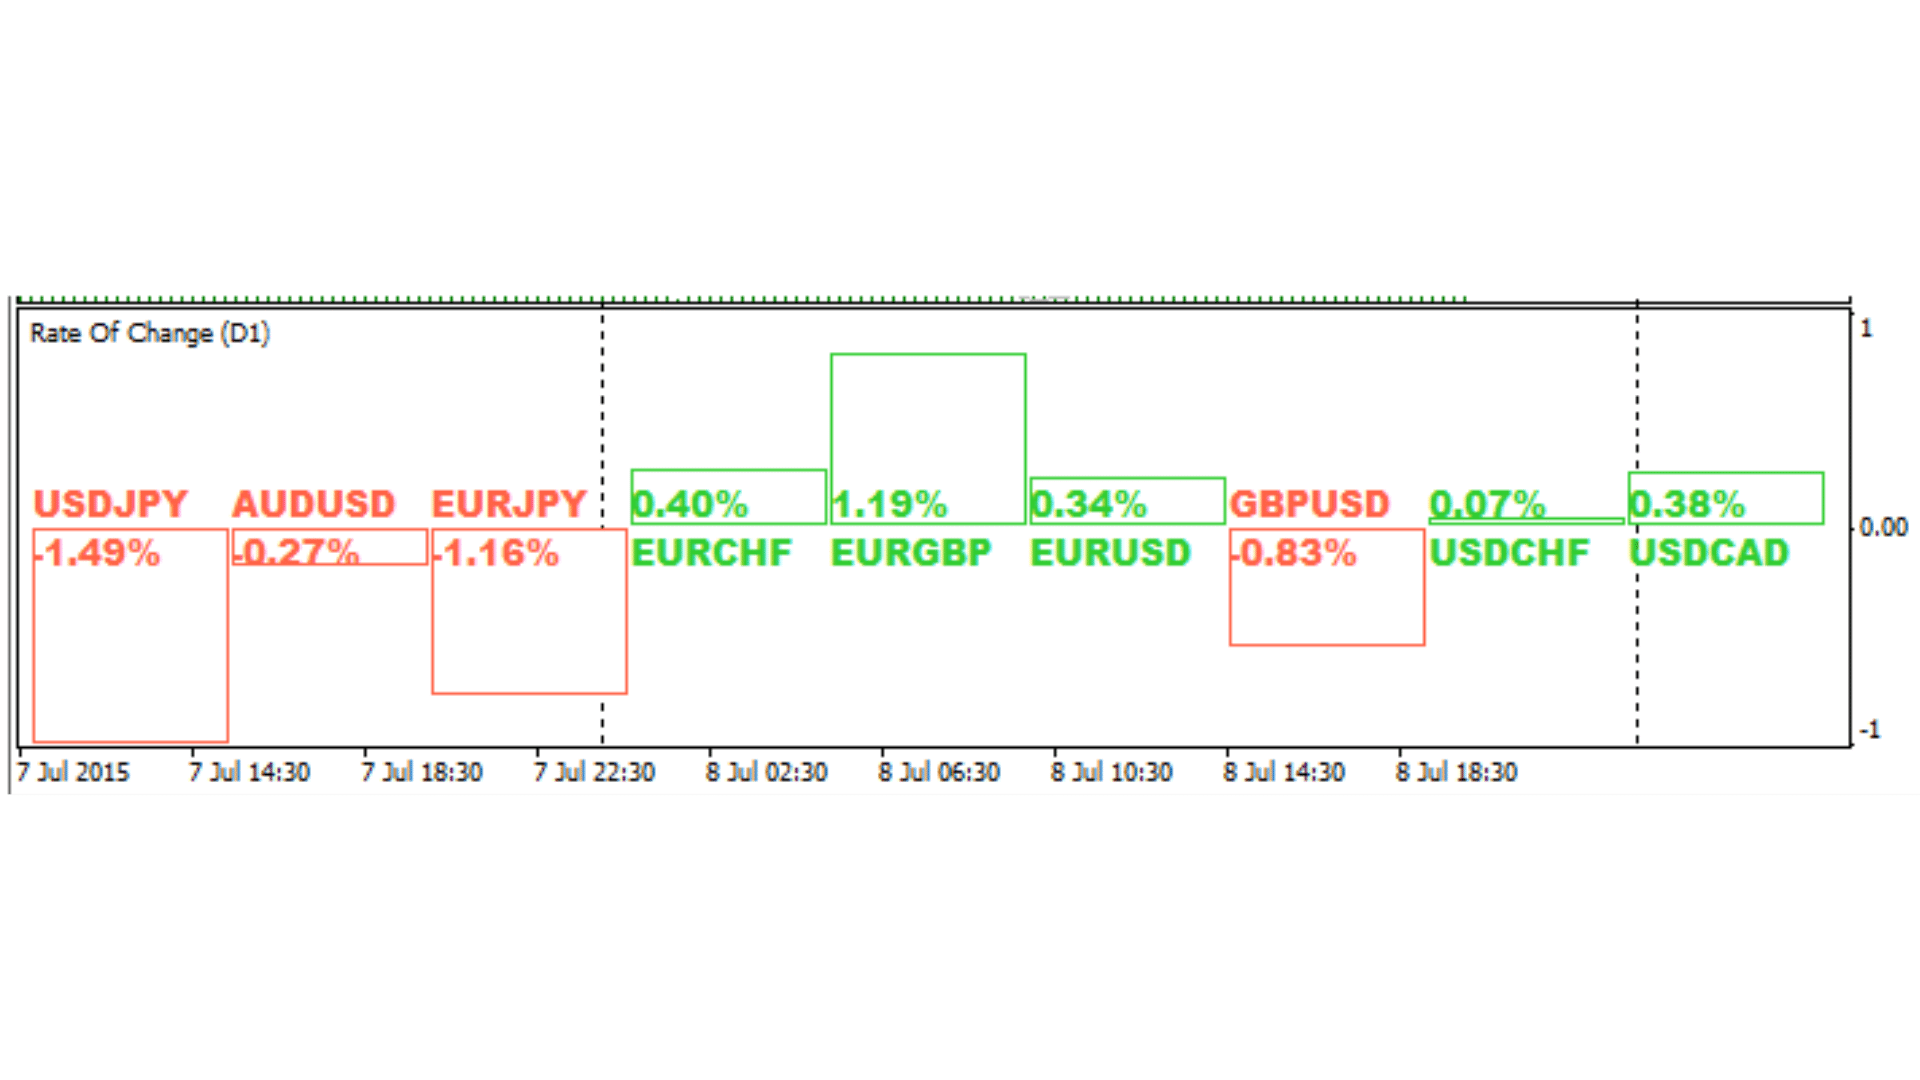
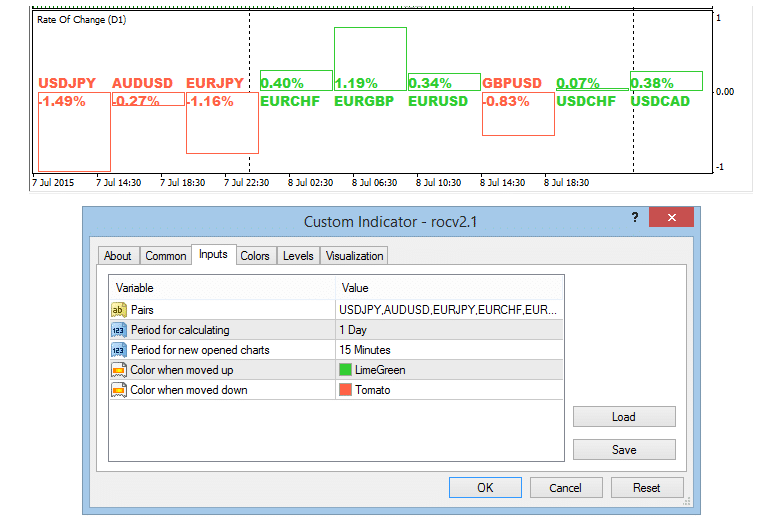
Rate of Change Indicator MT4
The MT4 ROC indicator lets you view the rate of change in the prices for any pair you enter.
Some of the things that you should keep in mind while using the ROC indicator on MT4 are:
- Enter the name of the pair without using spaces. For example, if you are trading the USD/JPY pair, you would enter USDJPY as the pair.
- Enter the period that you would like to consider for calculating the ROC. This could be anywhere ranging from 1 day to 3 months.
- Select the colors that you wish to use to denote positive and negative change.
- The ROC on MT4 allows you to view multiple pairs simultaneously, and to do so, you must enter them all together, separated with commas and no spaces.
- If you are viewing multiple pairs, the bars will automatically adjust when a particular pair’s ROC crosses the window’s border.
You can read more about and get the ROC indicator for the MT4 platform here.
Rate of Change Indicator MT5
The ROC indicator for MT5 also works in a very similar way to the ROC indicator for MT4, and you can view the rate of change for the various pairs you enter by following the same set of instructions as the ones for MT4.
Some of the features of an MT5 ROC indicator include:
- It also allows you to view multiple pairs simultaneously. However, unlike MT4, MT5 will enable you to view different asset classes together too. For example, you can view the ROC for both forex and CFD pairs on the same window.
- The MT5 system is also easier to use overall because of the better interface, making the ROC easier to read and interpret, leading to faster execution of trades.
You can read more about and get the ROC indicator for the MT5 platform here.
Lastly
The ROC is a helpful indicator that most traders rely on to tell them whenever a stock is overbought or oversold and the general direction and momentum in which the stock is heading.
However, you need to understand what the ROC is, how it is calculated, and how to read the ROC indicator to apply it to your trading strategies. Through this, you can use the ROC indicator to both the MT4 and MT5 platforms easily.
