
Chart patterns have gained popularity across various markets for their ability to uncover profitable trades and aid in effective trade management.
Among the numerous charting patterns available, some consistently reappear as favorites. These patterns appear on different timeframes and can be applied to various markets, including Forex and stocks.
In this post, we will explore what chart patterns are and how you can incorporate them into your own trading. Whether you are an experienced trader or new to the world of trading, understanding and utilizing chart patterns can greatly improve your trading outcomes.
NOTE: Get your Chart Patterns PDF Below.
Table of Contents
What are Chart Patterns?
Chart patterns and candlestick patterns may seem similar, but they have distinct characteristics.
While many traders use Japanese candlesticks to spot trading patterns, it’s important to distinguish between a chart pattern and a candlestick pattern.
A candlestick pattern usually involves just one or two candlesticks. For example, it could be an inside bar or a dragonfly doji.
On the other hand, chart patterns are formed over longer timeframes and involve more candlesticks. They reveal significant reversals or the development of larger trends.
Don’t assume that chart patterns are only for long-term trading. They can be applied to short-term trading, intraday trades, or even scalp trades.
In the upcoming sections, we’ll explore different types of chart patterns and how they can be used across various trading timeframes.
How to Use Chart Patterns
Chart patterns can be employed in various ways to improve your trading, but one of the most popular is identifying high-probability trade opportunities.
Chart patterns repeat themselves over time. They persist because each pattern reflects the actions of traders through price movements.
Traders tend to exhibit similar behaviors in similar situations. Consider how they get greedy when chasing profits or fearful when experiencing losses. These emotions remain consistent.
This is why the same patterns appear repeatedly. Traders engage in similar actions in the market, resulting in the formation of familiar patterns.
You can leverage this knowledge to your advantage by spotting and trading these patterns for profitable trades. By understanding and recognizing these candlestick patterns, you gain an edge in the market.
Trading Classic Chart Patterns
There are numerous chart patterns available for you to learn and apply to your trading. Similar to the wide range of indicators out there, you don’t have to know them all to be profitable.
Instead of trying to learn and trade multiple patterns, it is often more effective to focus on one or two classic chart patterns and become an expert in them. It’s better to have a deep understanding of a few patterns rather than being average at many.
By mastering these selected patterns inside out, you increase your chances of making successful trades. So, don’t overwhelm yourself with too many patterns. Choose a couple of classics and dedicate your efforts to truly mastering them.
Here are a few to get you started:
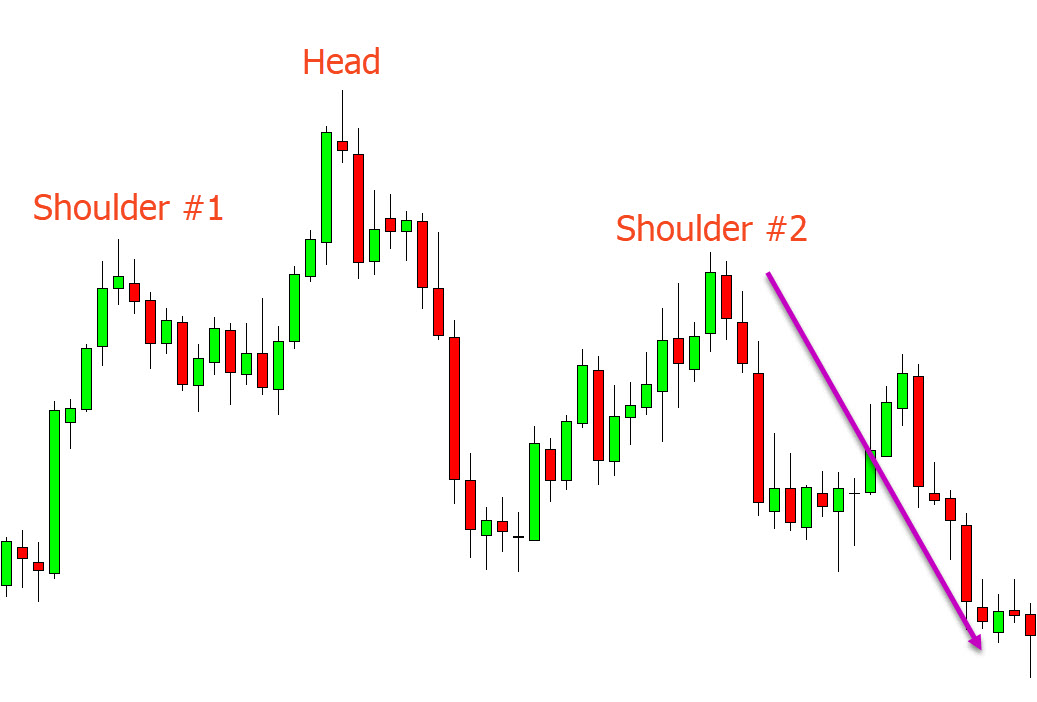
Head and Shoulders
The head and shoulders is quite possibly the most popular of all the chart patterns.
Once you know how to identify it you will start to see it on all your charts and time frames and you will see how profitable it can be. When done correctly this pattern can be incredibly reliable.
The head and shoulders pattern is formed with three peaks and a neckline. The first peak is shoulder one or the ‘left shoulder’. The second peak is the head and the third peak is the right shoulder.
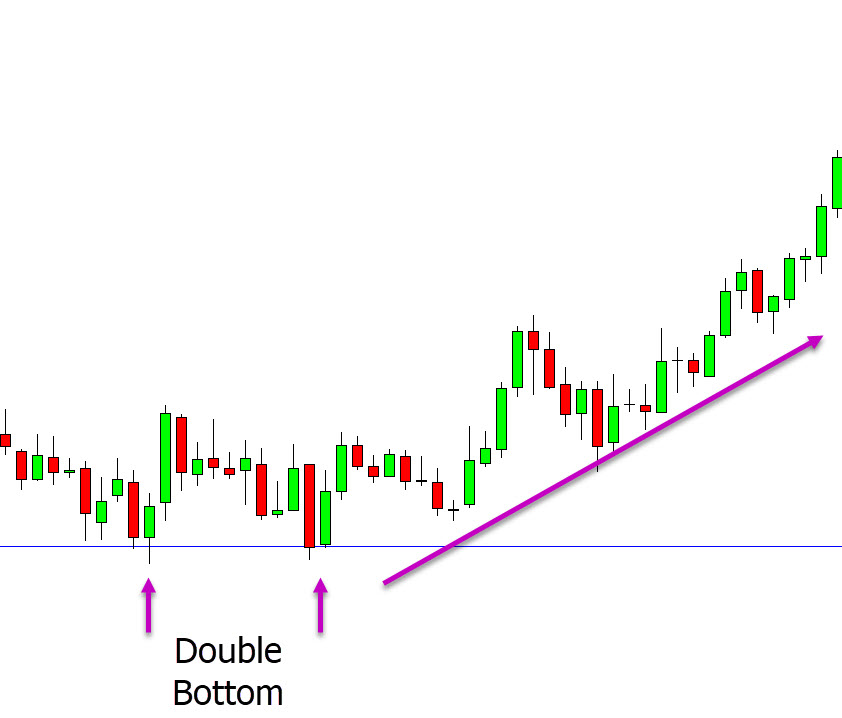
Double Top and Double Bottom
Double Top and Double Bottom is a very easy pattern to identify, but a very reliable reversal pattern.
This pattern is formed with two peaks and a neckline. For example; with a double top we need to see price form two peaks rejecting the same resistance level.
For a double bottom we need to see price forming two swing lows rejecting the same support level.
Entry is normally taken when price breaks higher or lower through the neckline.
Day Trading Chart Patterns
Charting patterns are not just for the higher time frames and you can use them for both day trading and intraday trading.
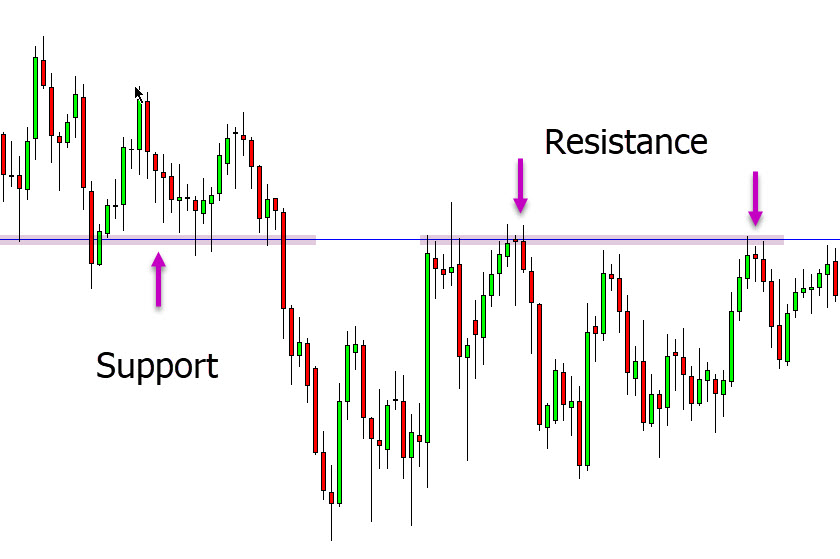
The most commonly used pattern that is used by everyone from the big banks right down to the smallest retail trader is support and resistance.
- When using support and resistance you are either looking to buy / sell the bounce, or buy / sell the breakout.
- When buying or selling the bounce you are looking for the support or resistance level to hold and for price to make a reversal.
- When buying or selling the breakout you are looking for a key support or resistance area to break.
Intraday Chart Patterns
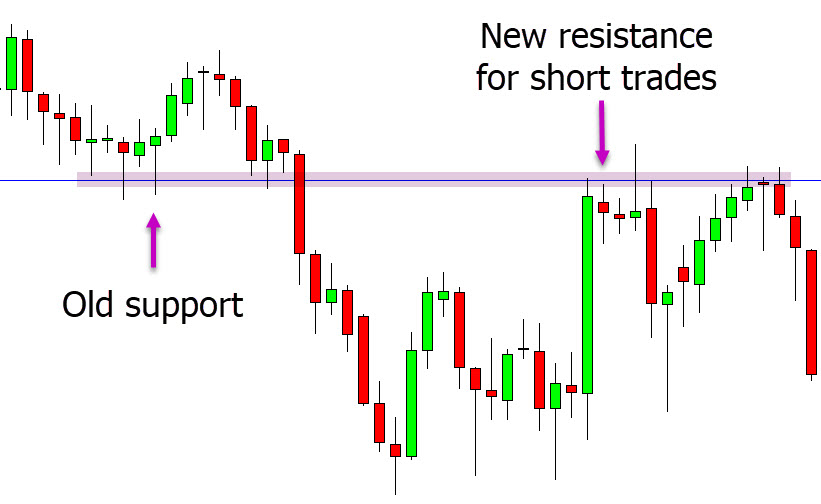
Another very popular pattern that can be used on all time frames and in many different markets is role reversal trading.
With role reversal trading you are using support and resistance levels, but you are looking for these levels to change their roles.
See the example chart below. At first price finds this level as a support level. Price then breaks lower. When price makes a new move back higher you are watching to see if the old support level will hold as a role reversal and new resistance level. If it does you can look for short trades.
You can use these role reversals as old support / new resistance and vice versa, old resistance and new support levels.
Lastly
In this post, we have discussed just a few of the popular chart patterns. However, there are many more patterns you can explore and use in your trading.
Remember, you don’t need to learn all of them. It’s often better to focus on one or two patterns that you prefer and become really good at them.
By mastering your chosen patterns, you can improve your trading outcomes. Don’t feel overwhelmed by the vast number of patterns available. Instead, select the ones you like the most and dedicate your time to mastering them.
As you gain proficiency, you can gradually expand your knowledge and explore additional patterns. The key is to find the patterns that resonate with you and continuously improve your understanding and execution of those particular patterns.
NOTE: Get your Chart Patterns PDF Below.
