When carried out correctly, counter trend trading can be a high probability trading strategy.
When counter trend trading, you are looking to profit from the price action moves against the broader trend.
In this post, we look at counter trend trading and how you can use it in your own trading.
Table of Contents
What is a Counter Trend Trade?
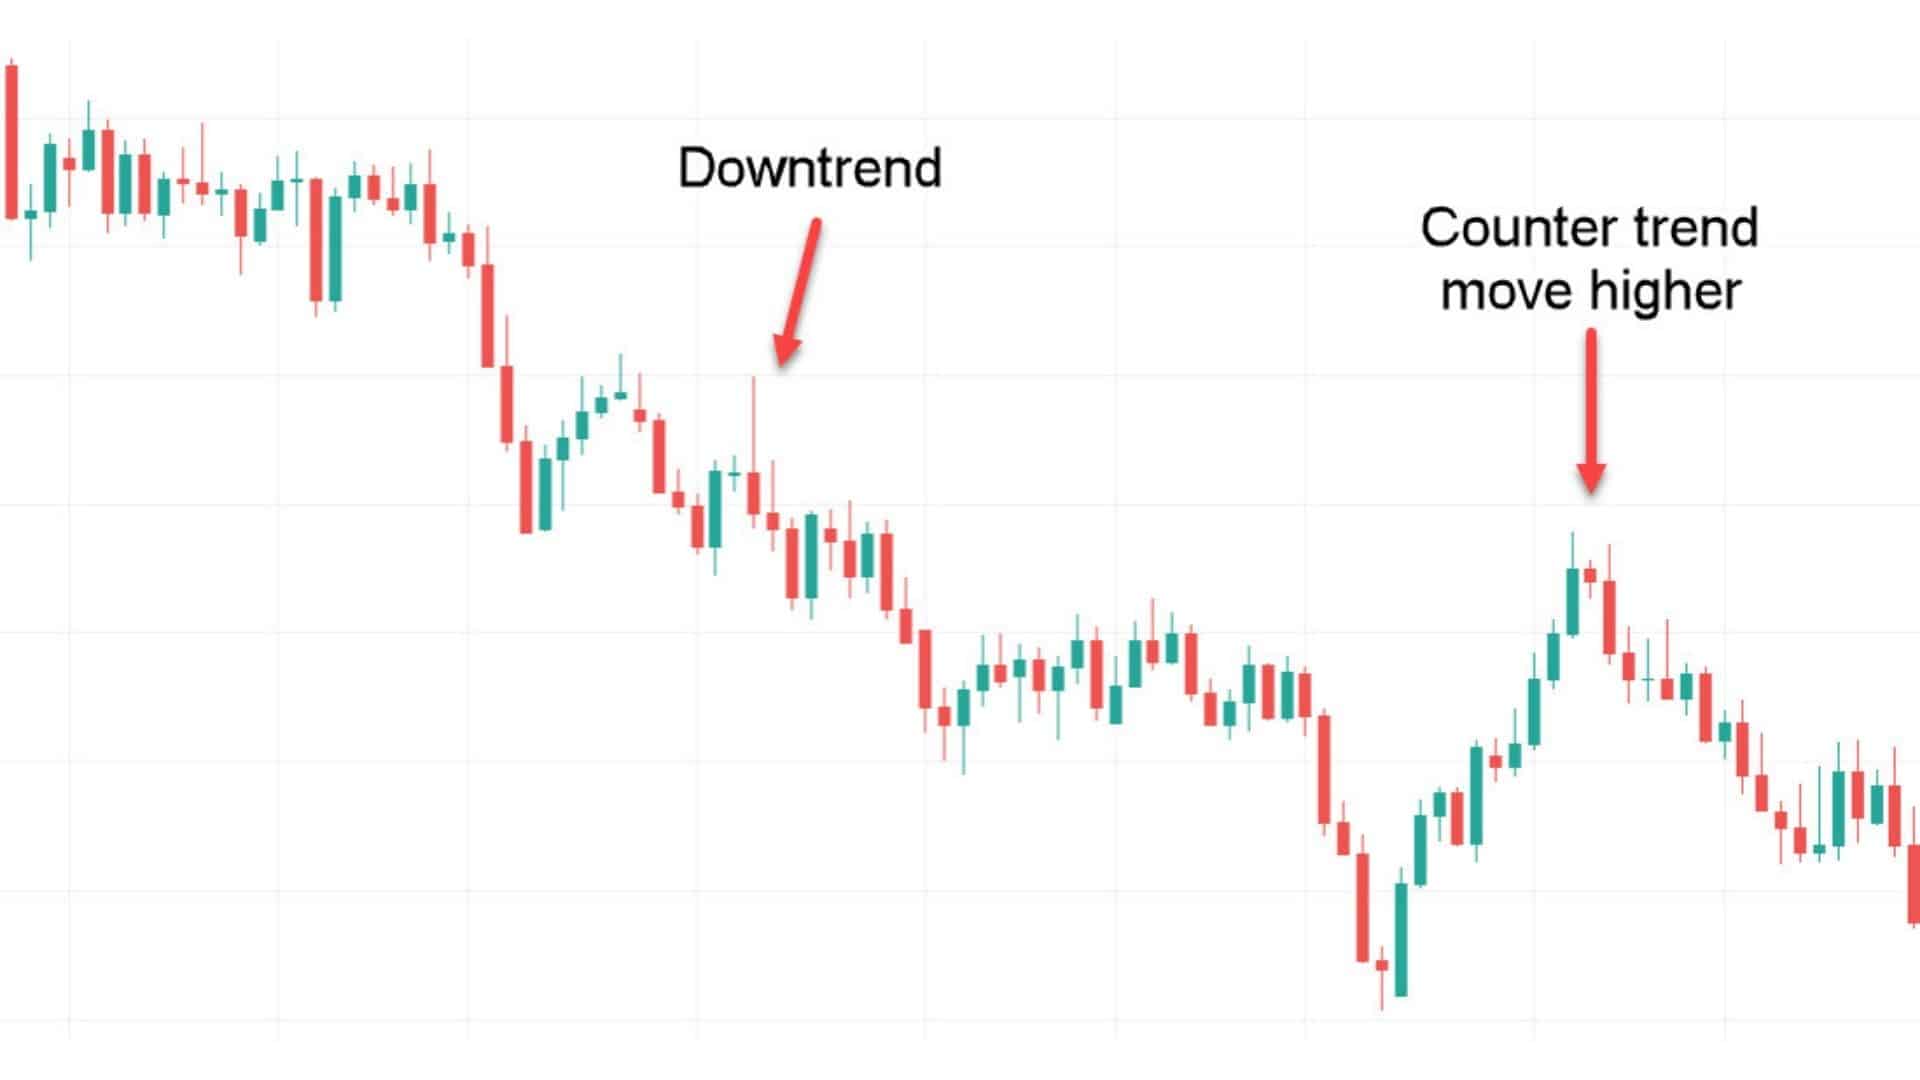
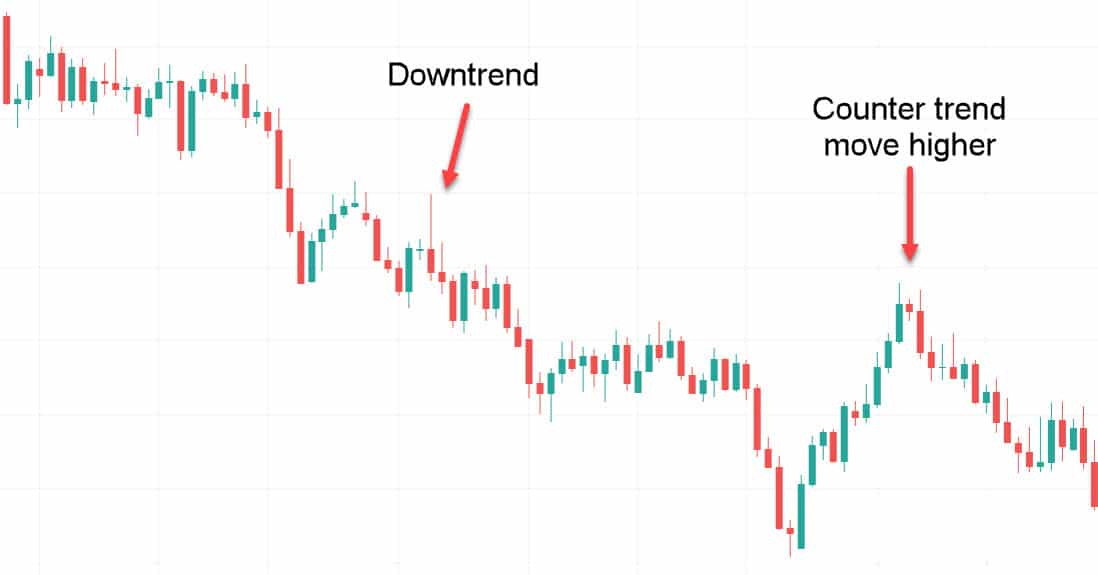
When making a counter trend trade, you are looking to profit from the swings higher or lower against the primary trend.
Counter trend trading is so popular because you can do it in any market and time frame. You can also make short sharp trades and profit from going both long and short.
Most counter trend traders will be swing traders looking to book a profit when the price makes a swing against the apparent trend.
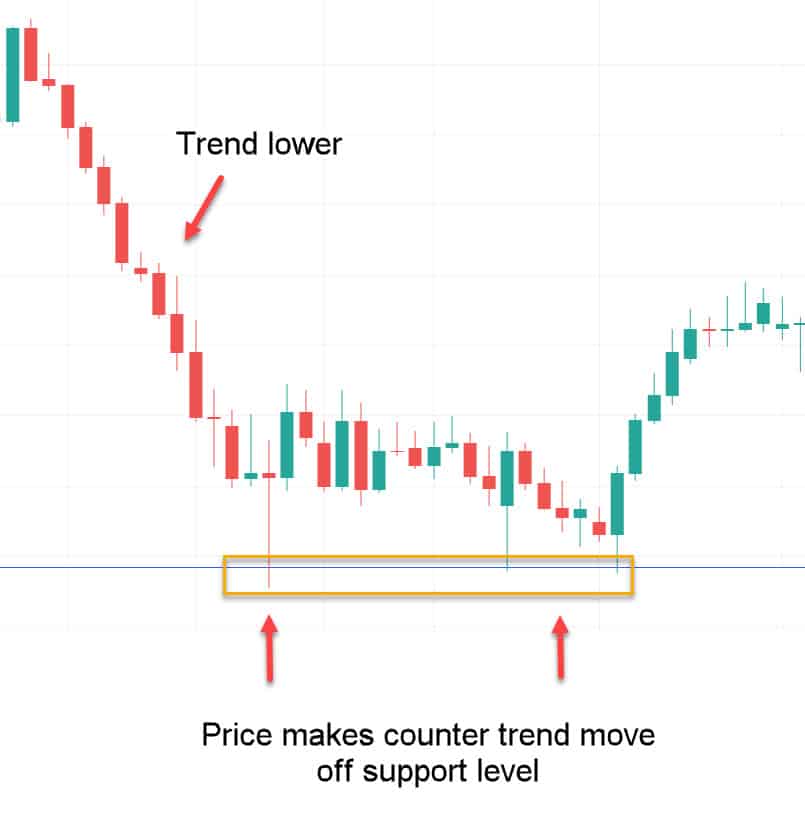
In the example chart below, you can see a clear trend lower. Price had been making a series of lower highs and lower lows.
A counter trend trader would be looking to buy the swing low and make a profit as the price moves higher against the trend lower.
Counter trend traders will often analyze the price action and can use popular indicators like the moving average to help them find their trades.
How to Identify Counter Trend Trades
The first trick to finding counter trend trades is to find a clear trend.
This can be done on any of your favorite markets and time frames.
You can use price action analysis and indicators such as the moving average to find when the price is trending higher or lower.
After you have identified a clear trend, you are looking for an opportunity to make a trade against the trend.
One of the best indicators you can use to find these trades is the relative strength index (RSI) indicator.
The RSI is a straightforward indicator that can help you identify when the price action is overbought or oversold.
You can combine this information with your price action analysis to find trades when you have identified overbought or oversold market conditions.
Counter Trend Trading Strategy
Counter trend traders will often use a combination of price action and indicators to find and make their counter trend trades.
One of the most straightforward strategies to make counter trend trades is combining price action and an indicator like the relative strength index.
Using the RSI indicator, you will be able to identify when a market is overbought or oversold and is looking at making a potential correction.
In the example counter trend strategy below, we use price action to identify potential counter trend moves.
Price had been in a strong trend lower, but price moves into a demand and support zone.
Counter trend traders could be looking at this support level to make potential long trades against the trend lower, looking for price to correct against the trend.
Using Counter Trend Trading Indicators
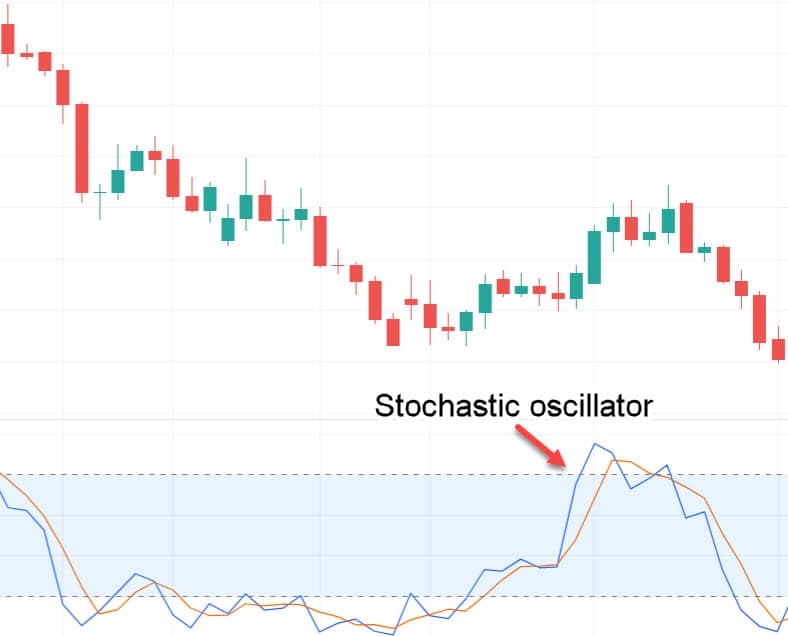
Two popular indicators for making counter trend trades are the stochastic oscillator indicator and the relative strength index (RSI).
These indicators can help you find when the price is overbought or oversold and when the price could soon be making a correction.
The RSI is a straightforward indicator that oscillates between 0 and 100.
Price the reading moves above the 70 level; it indicates the price is overbought. This could also signal that the price is looking to make a reversal back lower.
On the flip side, when the price moves below the 30 level, it indicates the price is oversold. This could be hinting at price making a reversal and moving back higher.
Lastly
Counter trend trading strategies can be as straightforward or as complicated as you like.
Some of the best strategies will combine several things, such as popular indicators and price action analysis.
The easiest way to perfect these strategies is to download some free demo charts and make practice trades. That way, you can test with different markets and different time frames.
