Technical analysis is undoubtedly one of the most powerful techniques to study the price and predict the upcoming movement in the market. While there are several ways to perform technical analysis, indicator-based analysis is one of the most popular ways.
Technical indicators are typically designed to interpret the market situation by cutting out the noise (volatility). And some indicators can help you identify the trend and current momentum.
However, there are a few that give information on volatility, trends, as well as momentum. The Donchian Channel indicator is a versatile indicator that can do all of this.
In this post, we go through exactly what the Donchian channel indicator is and how you can use it in your own trading.
NOTE: Want a full list of some of the best free MT4 and MT5 indicators you can use in your trading? You can get them below.
Table of Contents
What is the Donchian Indicator?
The Donchian channel is essentially a volatility indicator that reveals support and resistance levels in the market by considering the highs and lows of a given timeframe.
The indicator is plotted along with the price action that visually looks like a fluctuating channel.
Since the Donchian indicator incorporates primarily the highs and lows set by the market, Donchian channels are primarily applied on candlestick charts rather than line charts because candlesticks consider the high, low, open, and close that is required by the indicator in its calculation. As a result, it clearly helps analysts comprehend the volatility of the underlying asset.
The channel plotted around the price action is used by traders to identify potential breakouts & retracements. It determines the relationship between the past price and the current price of an asset, helping speculators predict the bullishness and bearishness in a specific timeframe.
How Does the Donchian Channel Indicator Work?
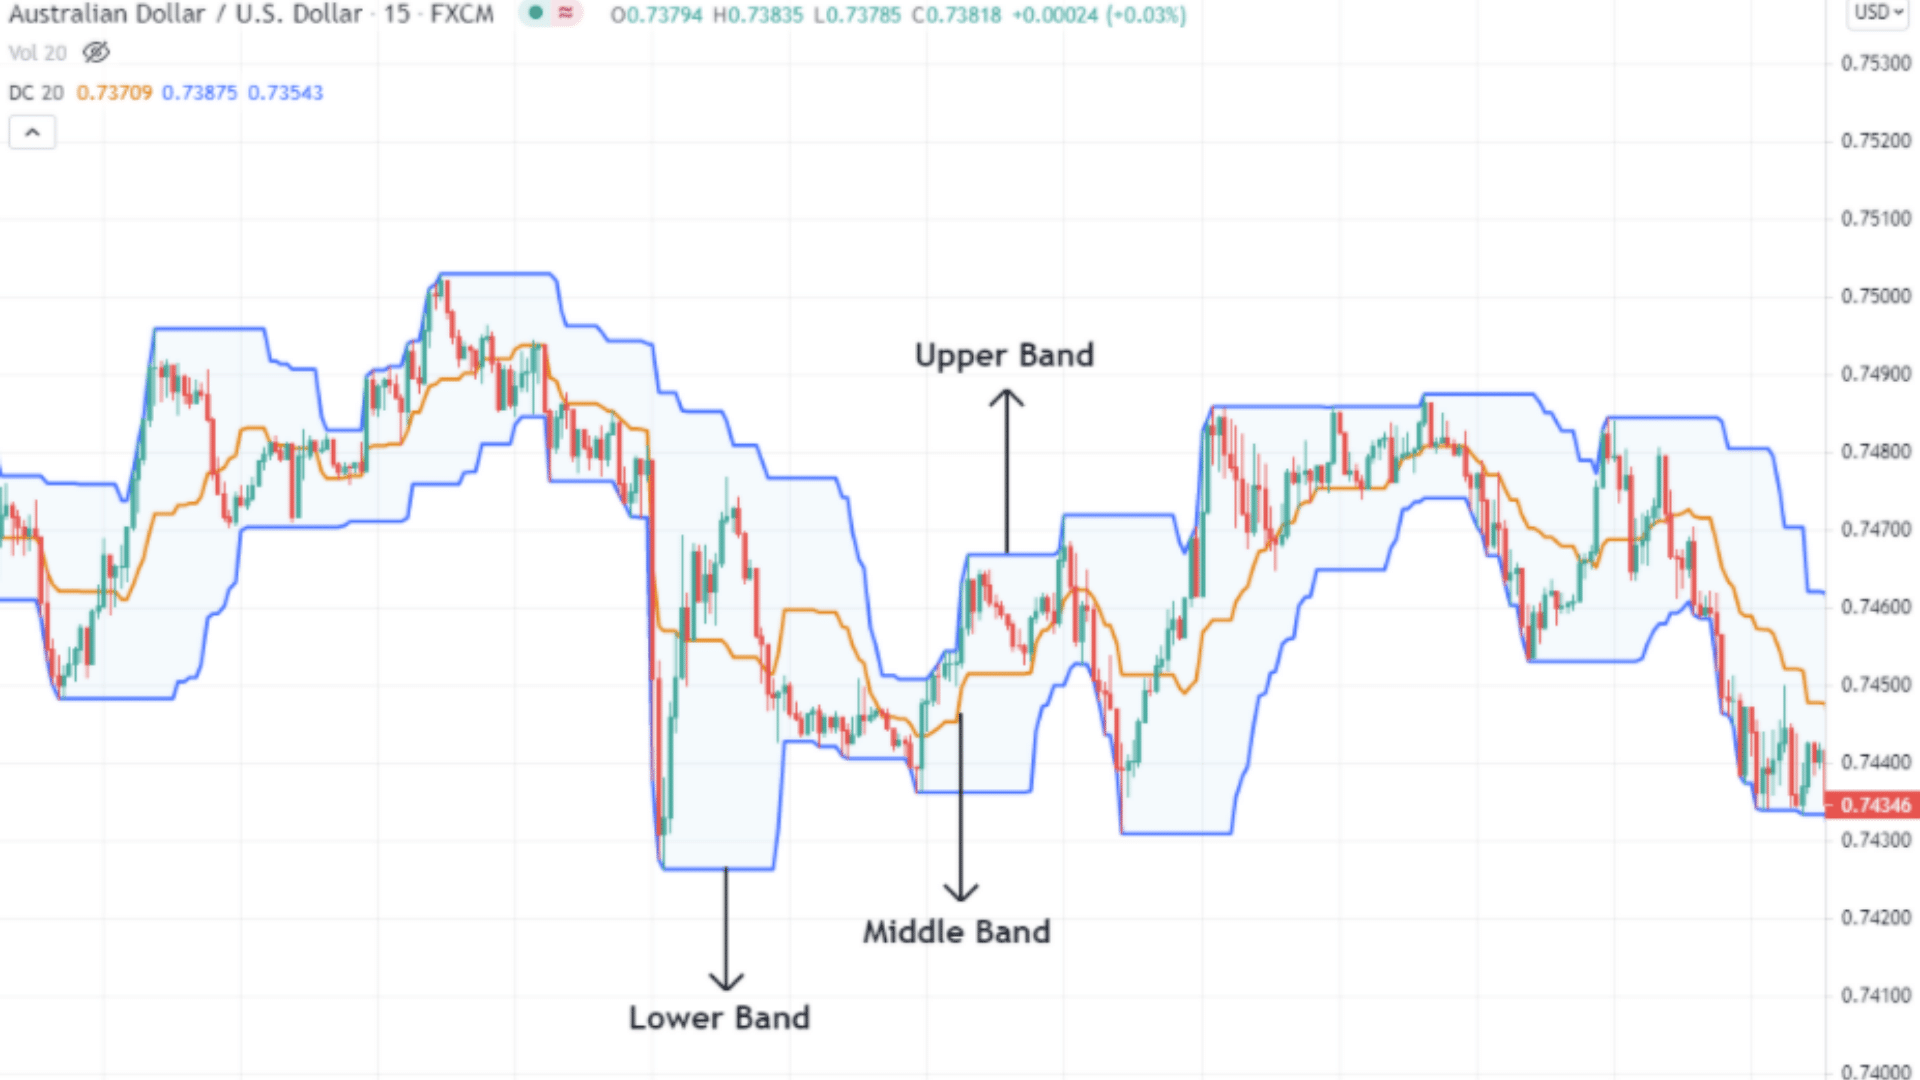
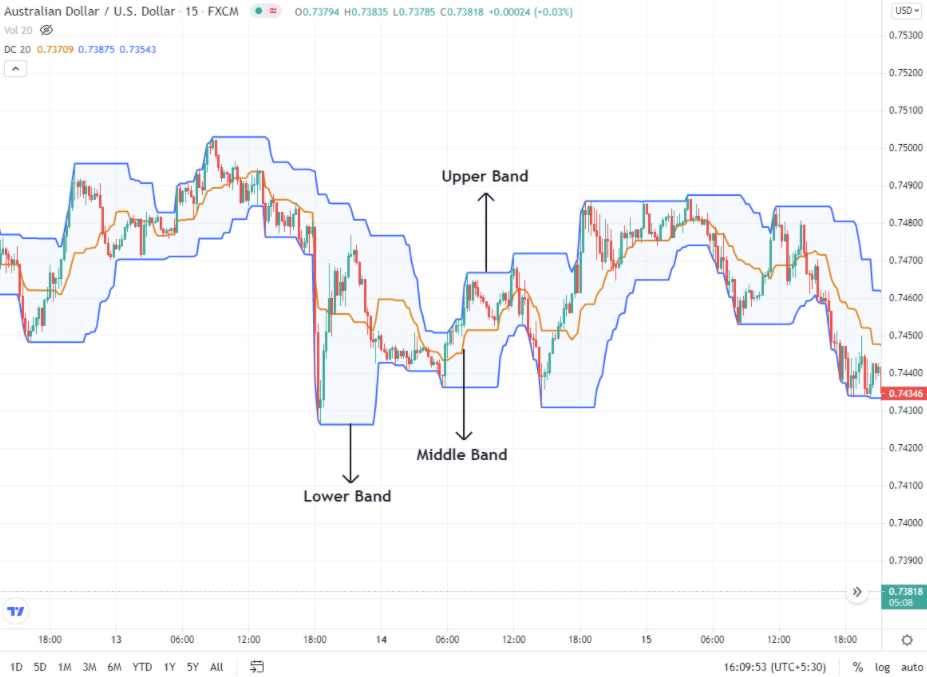
The Donchian indicator is a channel with three lines drawn against the price action. The crux of the indicator lies in interpreting the three bands, the upper band, lower band, and middle band.
All three bands work together and indicate the momentum of the market.
The upper band depicts the highest high from the previous period, while the lower band represents the lowest low from the previous period. The middle band is based on the average of the present high and the present low of that trading period.
Upper Band Interpretation
If the market is hovering around the upper band and trading between the middle and the upper band, it indicates that the buyers are dominating the market currently, and the same could continue in the upcoming trading session. Hence, traders position themselves looking for buying opportunities.
Lower Band Interpretation
If the market is trading towards the lower band for a long period, it is an indication that the bears are trying to maintain control of the market. Traders would normally then prepare to go short.
Middle Band Interpretation
The middle band is the average between the upper and the lower band for that period. If the price action is more or less at the middle band, it indicates that the volatility in the underlying asset is weak, and there is no clear sign if the bulls or bears will head the market henceforth.
Donchian Channel vs Bollinger Bands
The Donchian channels and the Bollinger Bands visually look the same. Though they exhibit a few similarities, they are very different from one another in many significant aspects.
Firstly, they differ with their calculations. While Donchian channels consider the highest high and the lowest low for measuring the three-band values, Bollinger Bands, on the other hand, records the difference between two standard deviations from the simple moving average for the specified period.
Secondly, the trading interpretation is the opposite.
For instance, in Donchian channels, if the market breaches above the upper band, it indicates that the buyers have officially made a move, and the current trend could continue further.
With Bollinger Bands, when there is a breakout above the upper band, it suggests that the market is in an overbought situation and hence could reverse its direction.
Donchian Indicator Trading Strategies
The Donchian channel is one the most reliable indicators in the market to exist.
Since the predominant trend of the market backs the indicator, it comes with an added layer of safety.
Following are a few compelling strategies using the Donchian channels.
Donchian Breakout Strategy
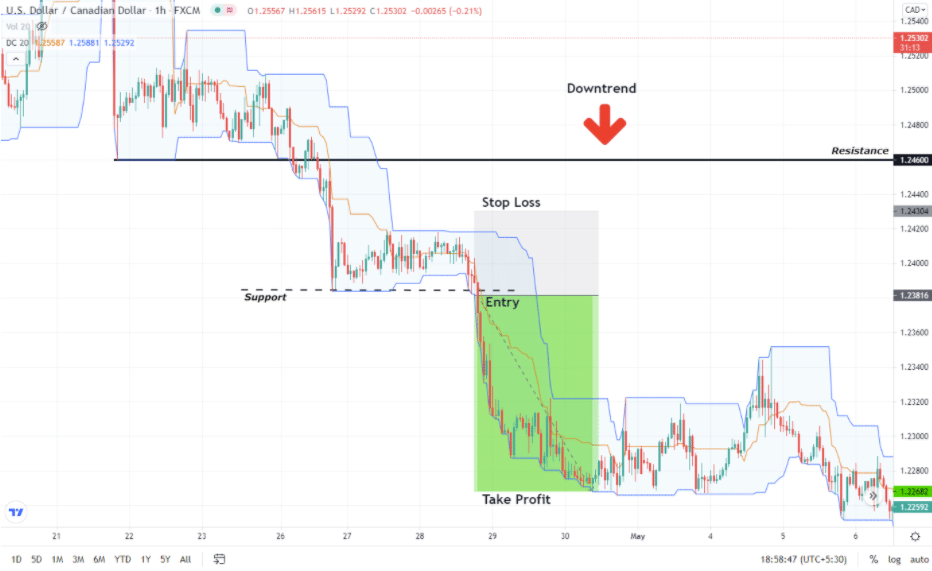
According to the Donchian breakout strategy, traders can go short in a down-trending market when the price breaches below the recent low (support) and reverses below the middle band of the Donchian channel.
Similarly, traders can go long in an uptrend as the market breaks through the recent high/resistance and crosses above the middle band.
In the below example, the market is in a clear downtrend.
The support is formed at 1.23816. The market ranging and trading around the middle band indicates that the bears are accumulating their orders before heading south. As the price plunges below the middle band and breaks through the support, we can trigger a short (sell) trade.
The stop loss can be placed above the upper band, while the take-profit can be executed as a market order when the momentum slows down and begins to trade above the middle band.
Donchian Trend Continuation Strategy
As the name suggests, this strategy follows the predominant trend of the market.
With this strategy, you can go long/short once the indicator switches to either band when a trending market is in the pullback phase.
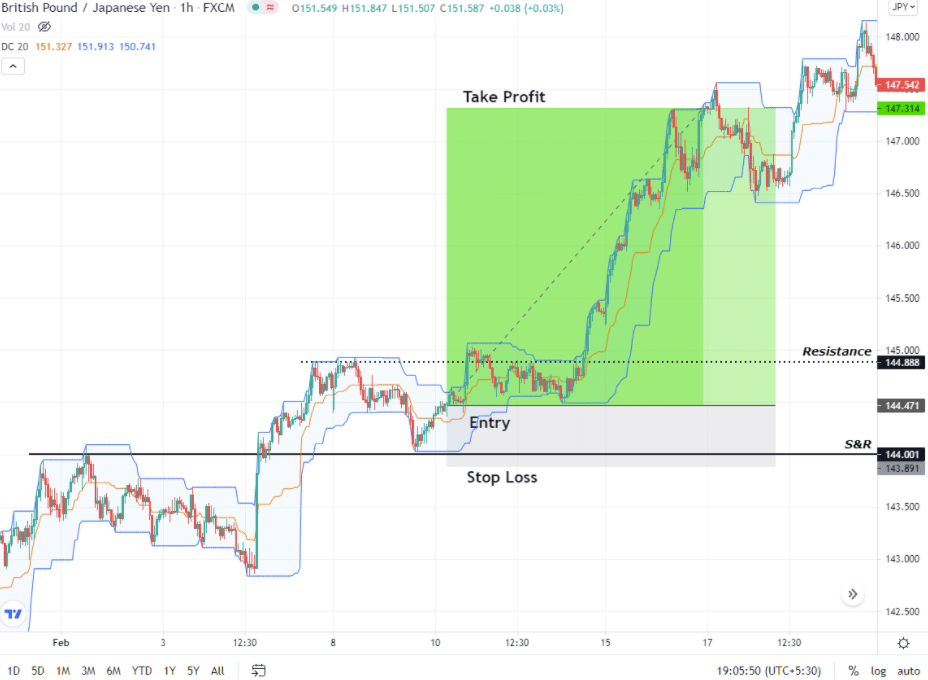
In the below chart, we see that the market is in a clear uptrend. As the retracement begins from the resistance, we wait until the price switches from trading below the middle band to above the middle band. Once the price crosses over the middle band and trades around the upper band, we can go long.
With this strategy, the stop loss can be placed below the recent low, and the trade can be closed when the market reverses below the middle band after the breakout from resistance.
Donchian Indicator MT4 Free
The Donchian indicator on MQL5 is available for download (free) for the MT4 trading platform.
The default period (previous trading sessions) is set to 20 but can be manually altered.
The rest of the functionalities, including calculating the upper, lower, and middle band, are done automatically.
Donchian Indicator MT5 Free
The Donchian indicator on MQL5 is available for download (free) for the MT5 trading platform.
The default period (previous trading sessions) is set to 20 but can be manually altered.
The rest of the functionalities, including calculating the upper, lower, and middle band, are done automatically.
Lastly
The Donchian channel indicator is a powerful technical indicator that determines the volatility and helps determine the upcoming trend of the market.
Plotted as a channel, it is similar to that of Bollinger Bands, but both the indicators’ calculation and interpretation are distinct.
The Donchian channel is great by itself, but it is recommended that you use it in conjunction with other technical factors to increase its accuracy and reliability.
