The double top and double bottom pattern are among the most common and popular technical analysis trading patterns used by Forex and other financial markets traders.
They are also one of the most go-to methods for identifying a potential top or bottom of an asset during a trading session.
In this post we go through exactly what the double top and double bottom pattern is, how to trade them and how you can use an indicator to quickly find them in MT4 and MT5.
Table of Contents
What is the Double Top and Double Bottom Pattern?
The double top and bottom patterns are chart patterns where the price of an underlying asset or security moves in a pattern that resembles the letter “W” (double bottom) or “M” (double top).
These patterns are used in technical analysis to understand the movements of an asset or security.
They can also be used as part of a trading strategy to take advantage of recurring patterns in the price of an asset.
The double top is a reversal pattern that is formed after an extended move higher and signals a reversal back lower.
Similar to the double top, the double bottom is also a trend reversal pattern that signals a reversal back higher after price has been moving lower.
The double top pattern is bearish, whilst the double bottom pattern is bullish.
Note: You may also like How to Trade Triple Top and Bottom Patterns.
How to Identify the Double Top and Double Bottom Pattern?
The double top formation is often referred to as the “M-shape” pattern, and it is bearish in nature.
This pattern is formed after the price of the market being traded has been in an uptrend. This can provide you with an opportunity to sell or short the security.
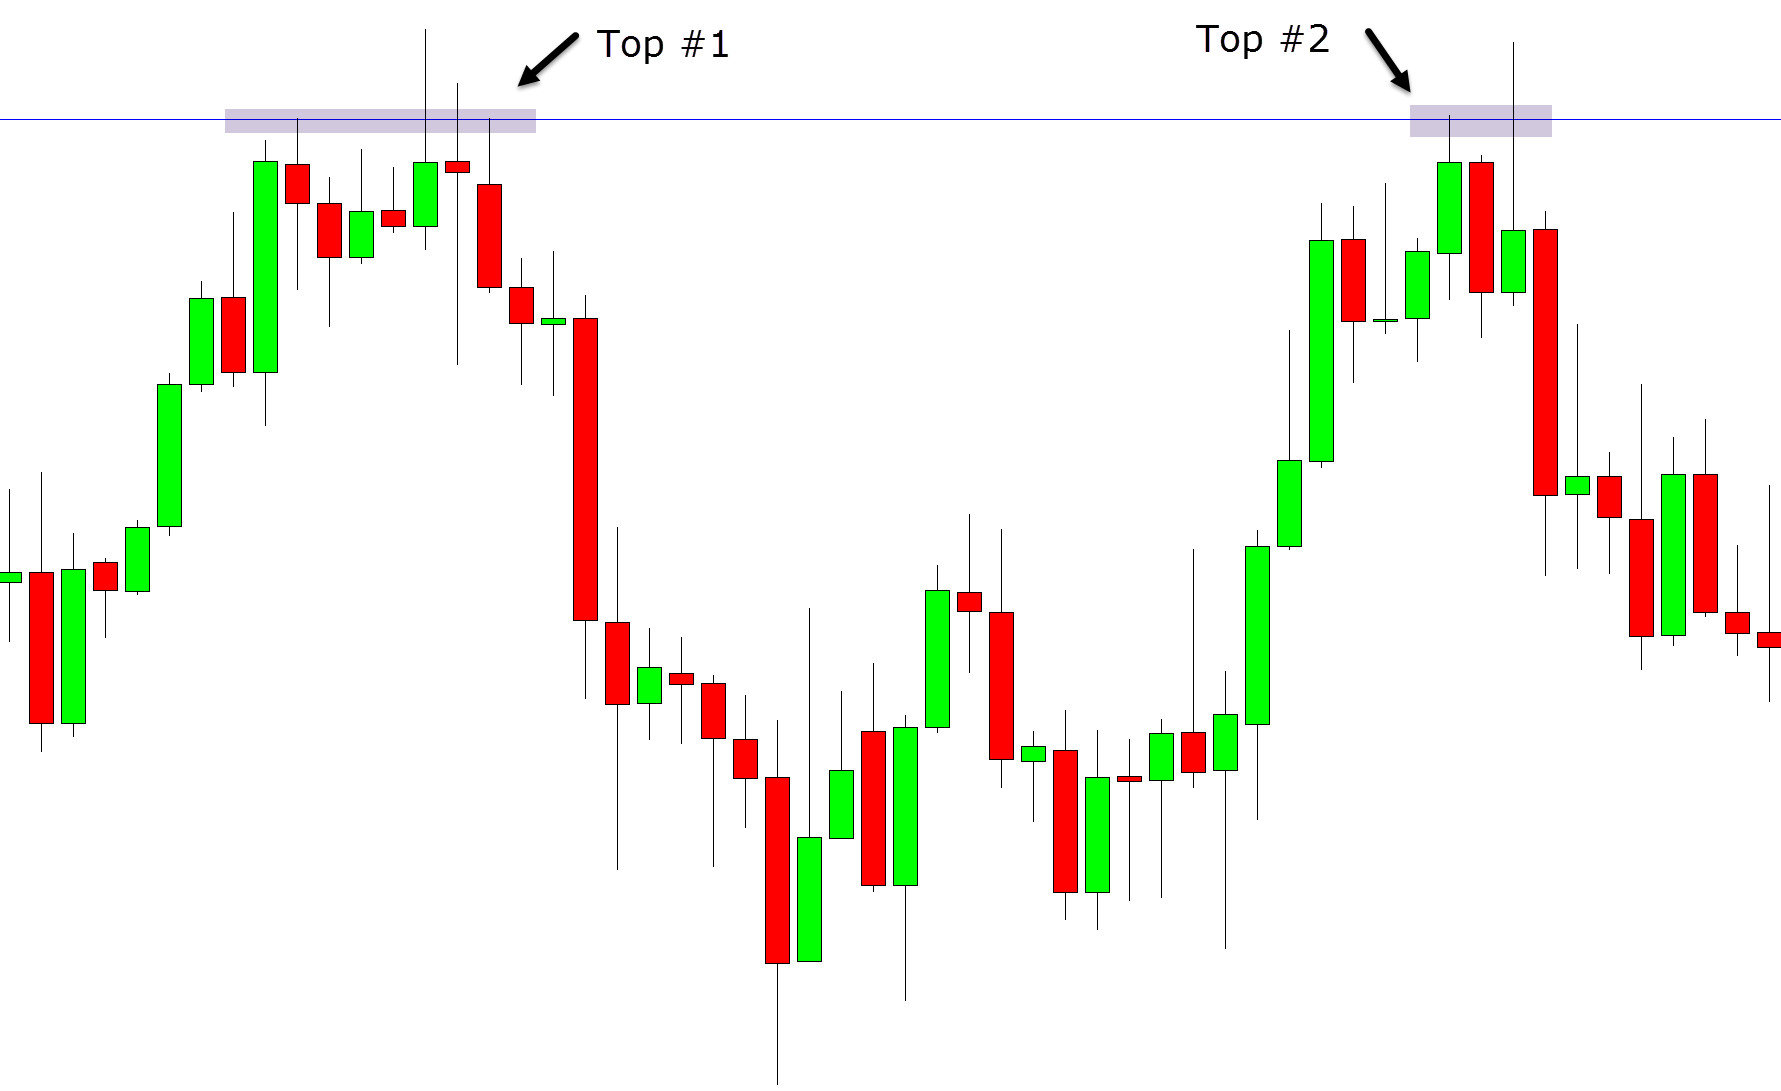
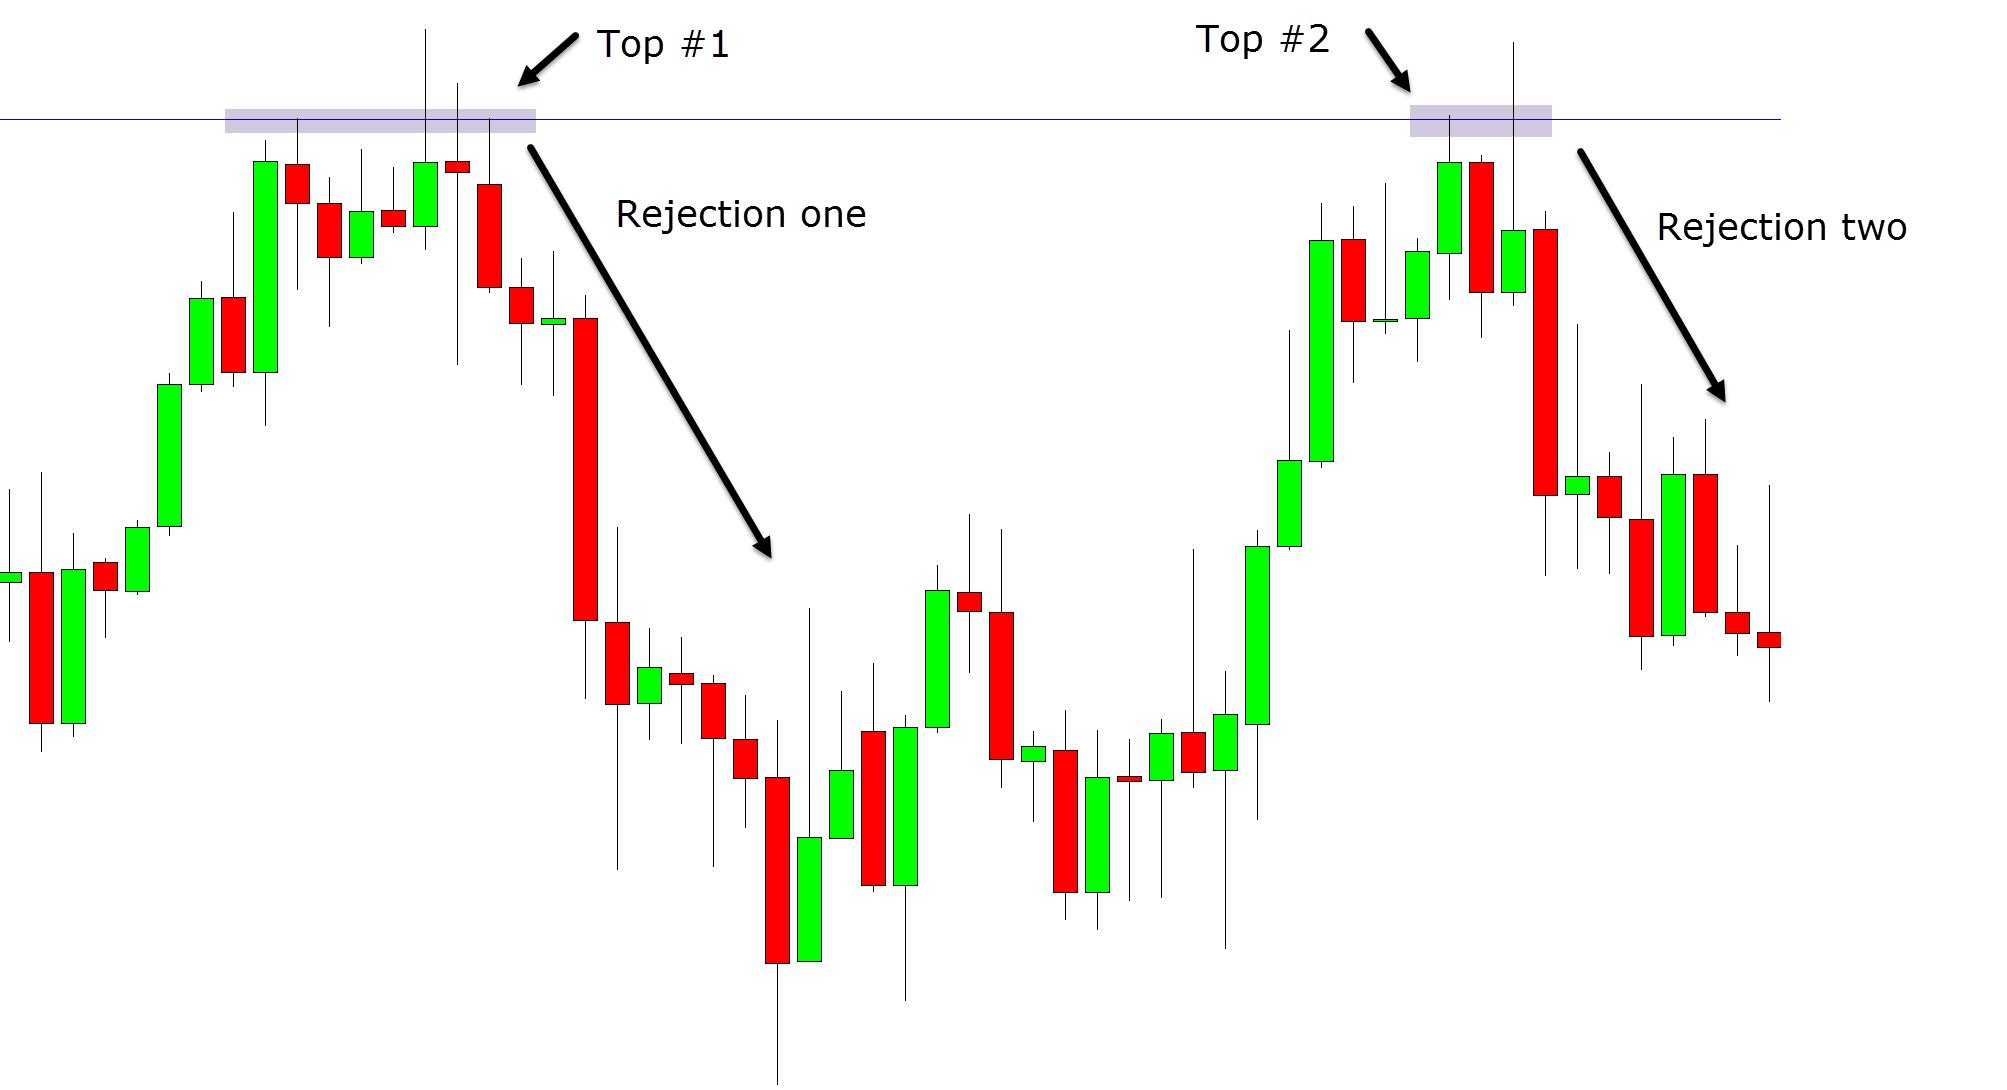
The double top has two peaks that are both rejecting a resistance level. These two peaks need to be rejecting the same resistance level and be at a very similar level on the chart.
As the example shows below; price makes a move higher and rejects the resistance for a first time. Price then rejects the same resistance for a second time to create the double top pattern.
The double bottom pattern is referred to as the “W-shape” pattern, and it is a bullish price action clue.
This pattern is formed after price has been moving lower in a downtrend. This pattern can then give you an opportunity to buy and get long as the trend changes to an uptrend.
If a pattern is to be regarded as a double bottom, then there needs to be two swing lows that are rejecting the same (or very close) support level.
How to Trade the Double Top and Double Bottom Pattern
A simple way to trade the double top pattern is to identify the pattern’s neckline.
The neckline is the recent swing point and support or resistance level for the pattern. For example; with a double top, price would have just created a swing high that could act as a role reversal support if price does not break below it.
See the example below for how to find the neckline.
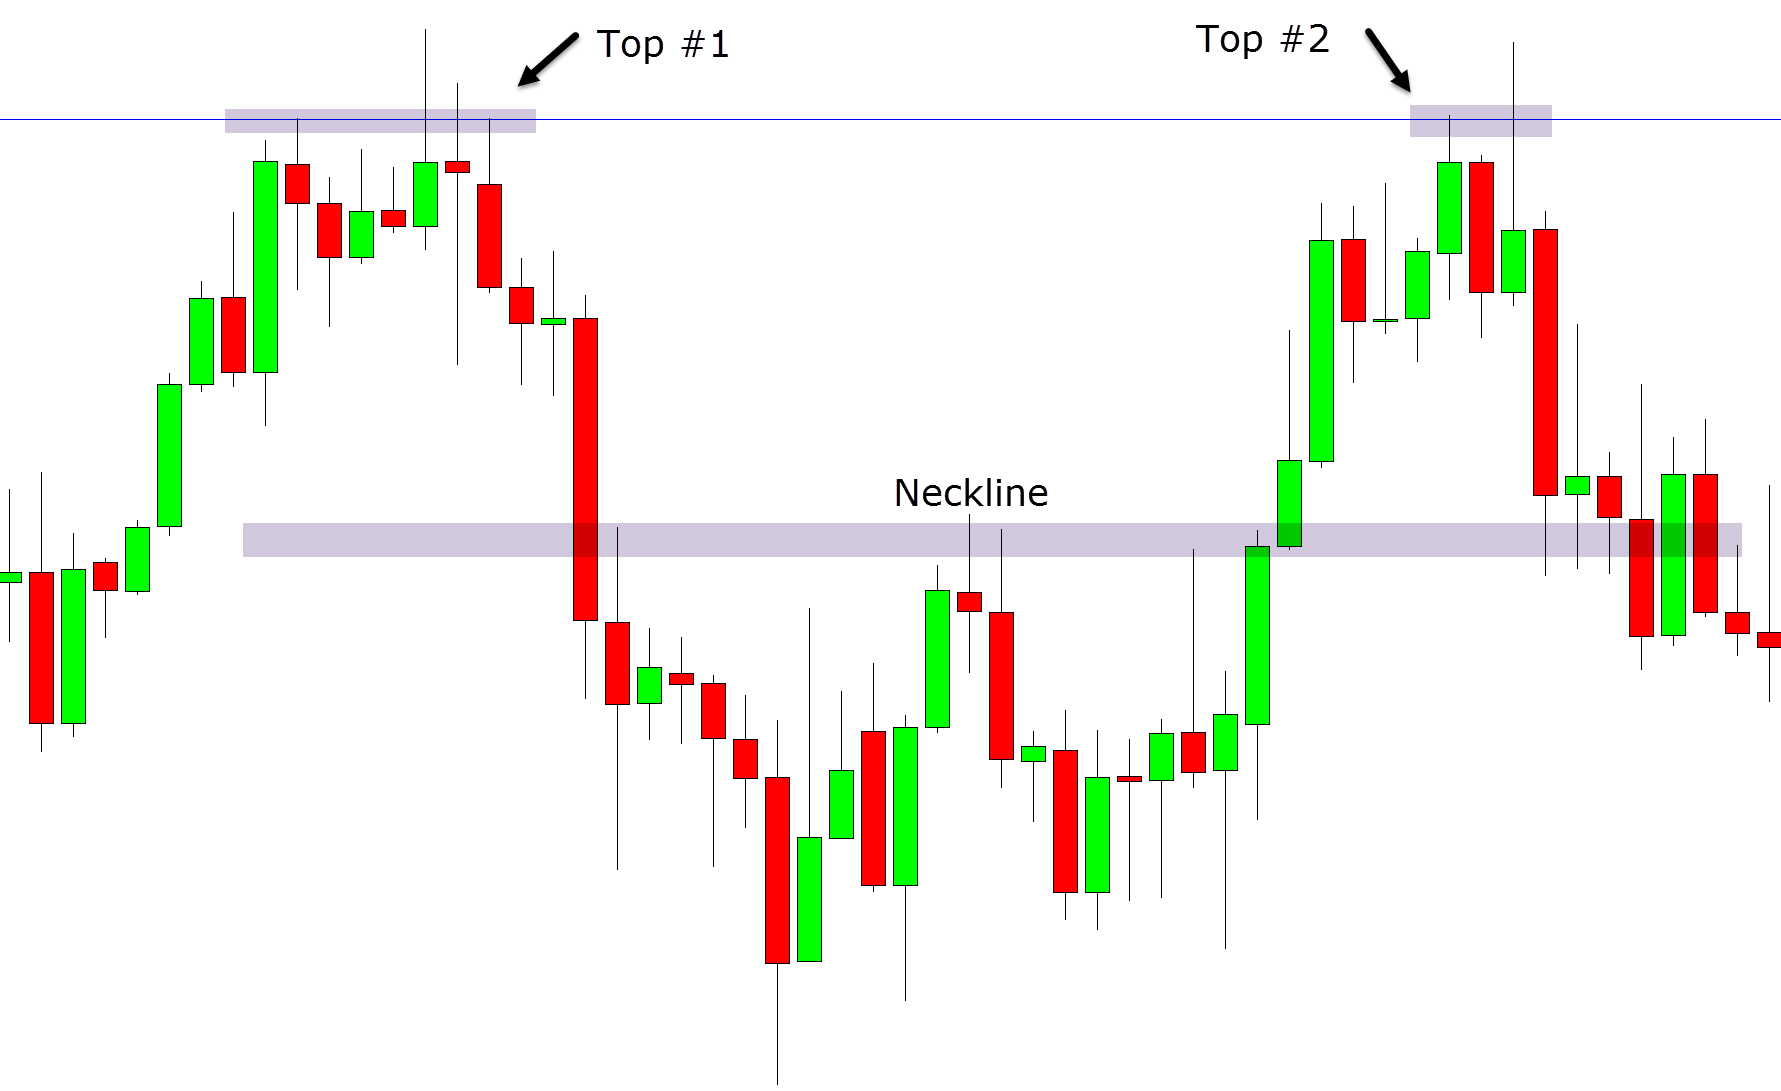
If price breaks below the neckline, you could look to make short trades. You could also then place a protective stop loss above the two peaks so that your losses will be limited if the pattern fails.
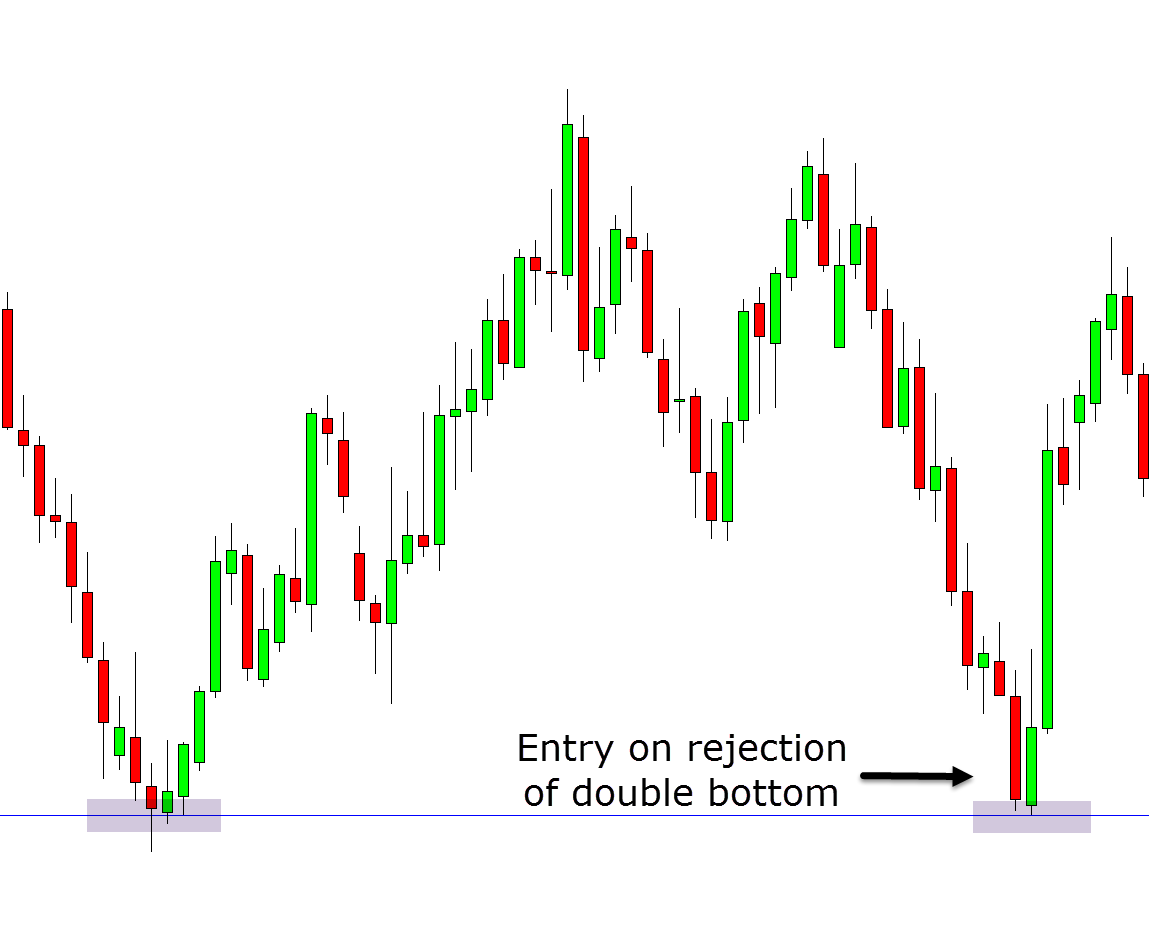
The more aggressive double top and bottom trading strategy is taking the entry straight from the bounce.
The example below shows how you might do this. As soon as you spot a double bottom formation forming you could begin looking for long trades. You could add to your trades odds by using confirmation with price action candlesticks at the double bottom support level for entry points.
Double Top and Double Bottom Pattern Indicator for MT4 Free Download
With so many indicators, different strategies and candlesticks, it can be very easy to miss out on great trading setups.
MT4 and MT5 indicators can help you quickly identify these patterns and most indicators come with inbuilt systems to send you alerts.
The ‘Ultimate Double Top and Bottom Reversal Indicator’ is a free double top and bottom indicator built for MT4.
This indicator allows you to detect high probability reversal patterns, giving you entry, stop loss and exit signals.
You can get the Ultimate Double Top and Double Bottom Indicator for MT4 here.
Double Top and Double Bottom Pattern Indicator for MT5 Free Download
The ‘Ultimate Double Top and Bottom Indicator’ is a free MT5 indicator.
This free indicator detects double tops and double bottoms along with false breakouts.
This indicator detects the games of the smart money and gives you high probability entry and exit signals with any market or time frame you are looking to trade.
You can Ultimate Double Top and Double Bottom Indicator for MT5 here.
Note: Don’t know how to install and use these indicators? Read How to Download, Install and Use MT4 and MT5 Indicators.
Lastly
The double top and double bottom patterns are one of the simplest and most powerful charting patterns you can use.
You will be able to quickly spot these patterns on all of your markets and time frames and you can use them to not only make trades, but also manage them.
You will find this pattern works best when you use it with your other favorite indicators and price action analysis to increase your trades odds.
