The triple top and triple bottom chart pattern is a price action pattern used to find a reversal in the market.
When used with other technical analysis to fine-tune entries, this pattern can be very effective.
The triple top and triple bottom can be traded in many different markets and on all time frames which makes it extremely versatile.
In this post we look at what exactly the triple top and bottom pattern is, how you can find it and how you can use it in your trading.
Table of Contents
What is the Triple Top and Triple Bottom Pattern?
How to Identify the Triple Top
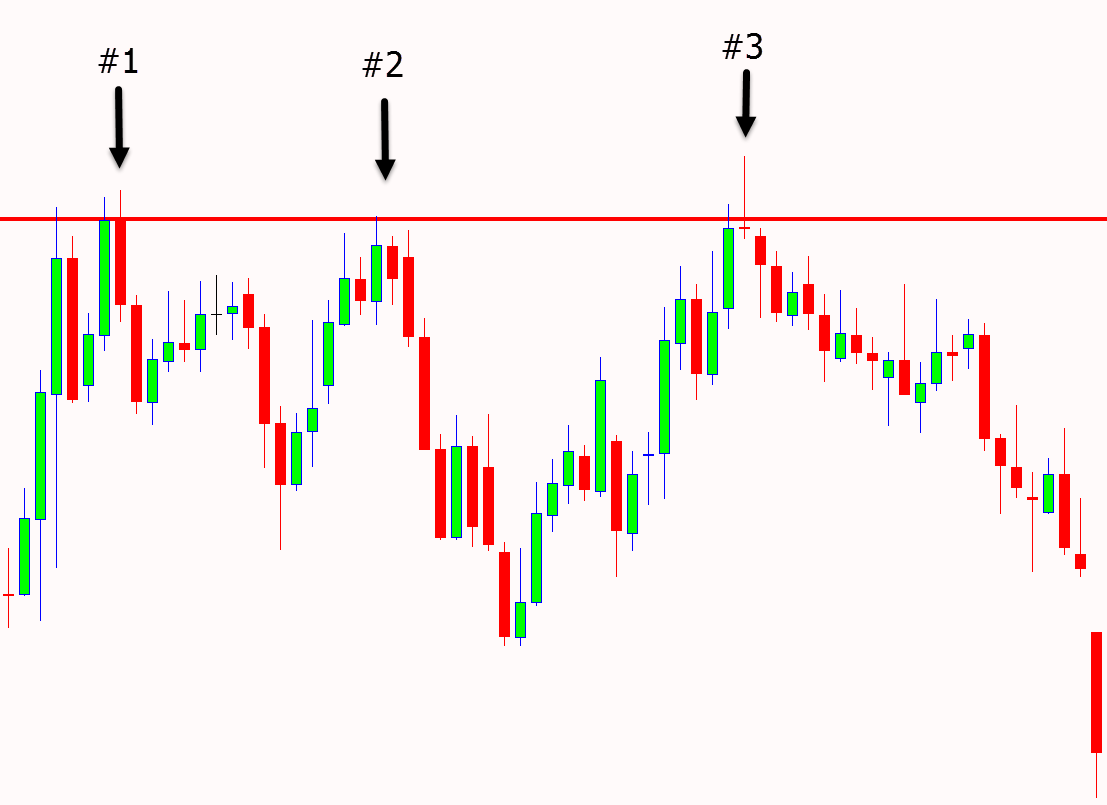
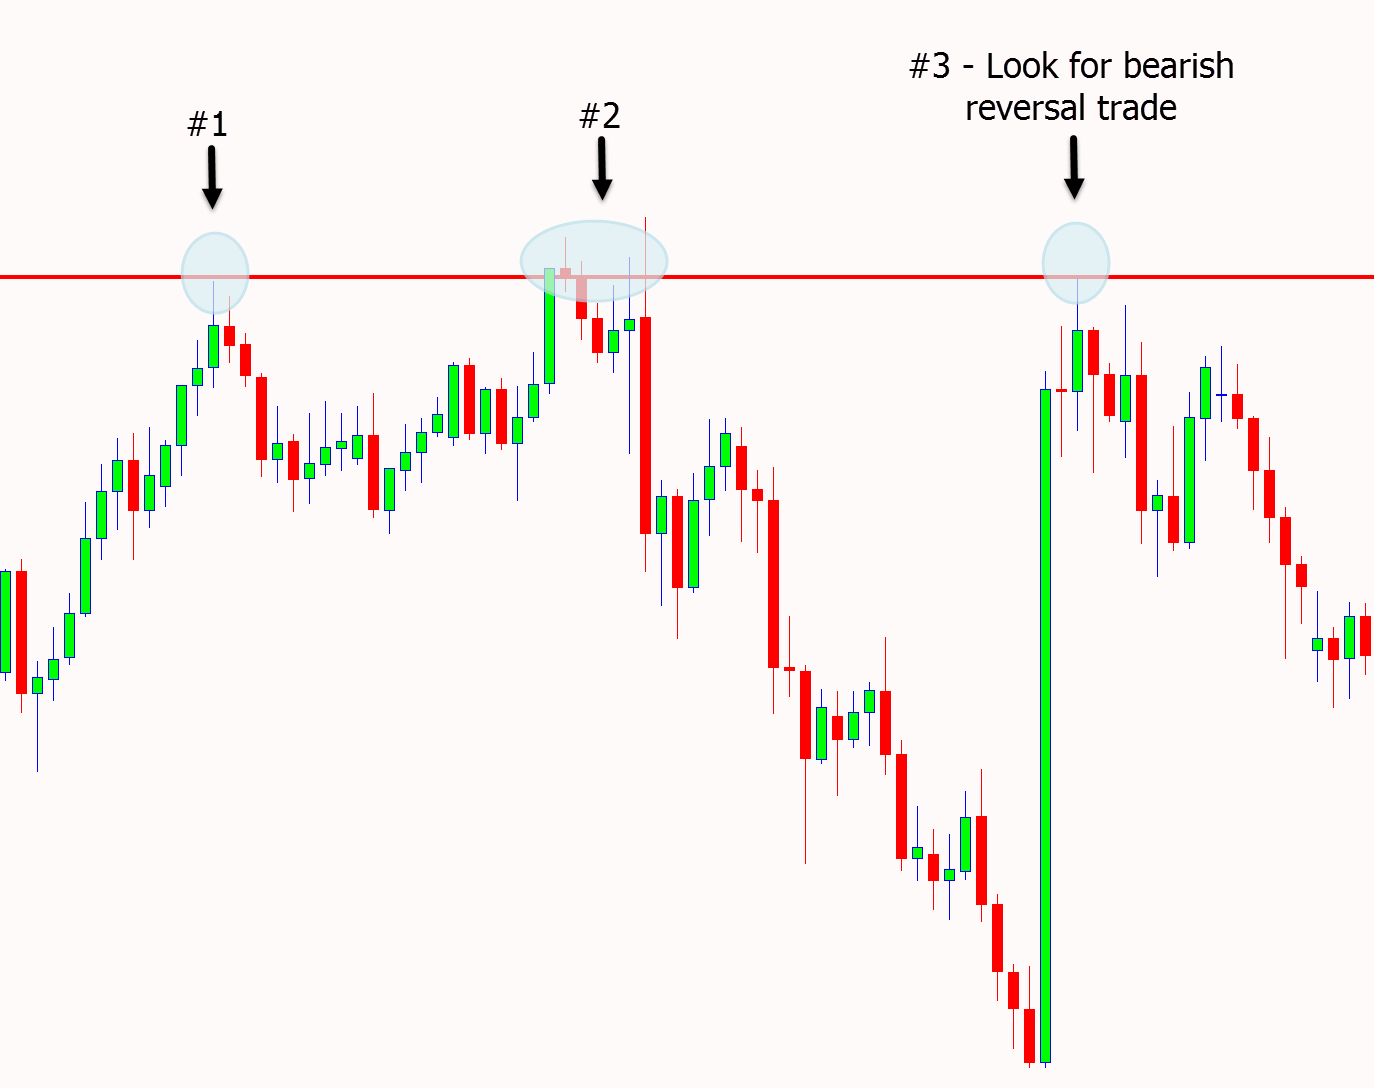
The triple top is formed with three peaks. These peaks are also known as swing highs.
A triple top is indicating that the bulls may be losing control and a move back lower could soon be on the cards.
To find the triple top we need to see the three swing highs all at the same level.
As the example shows below; price moves higher three times into the same area. Each time price rejects this area and the triple top is created.
How to Identify the Triple Bottom
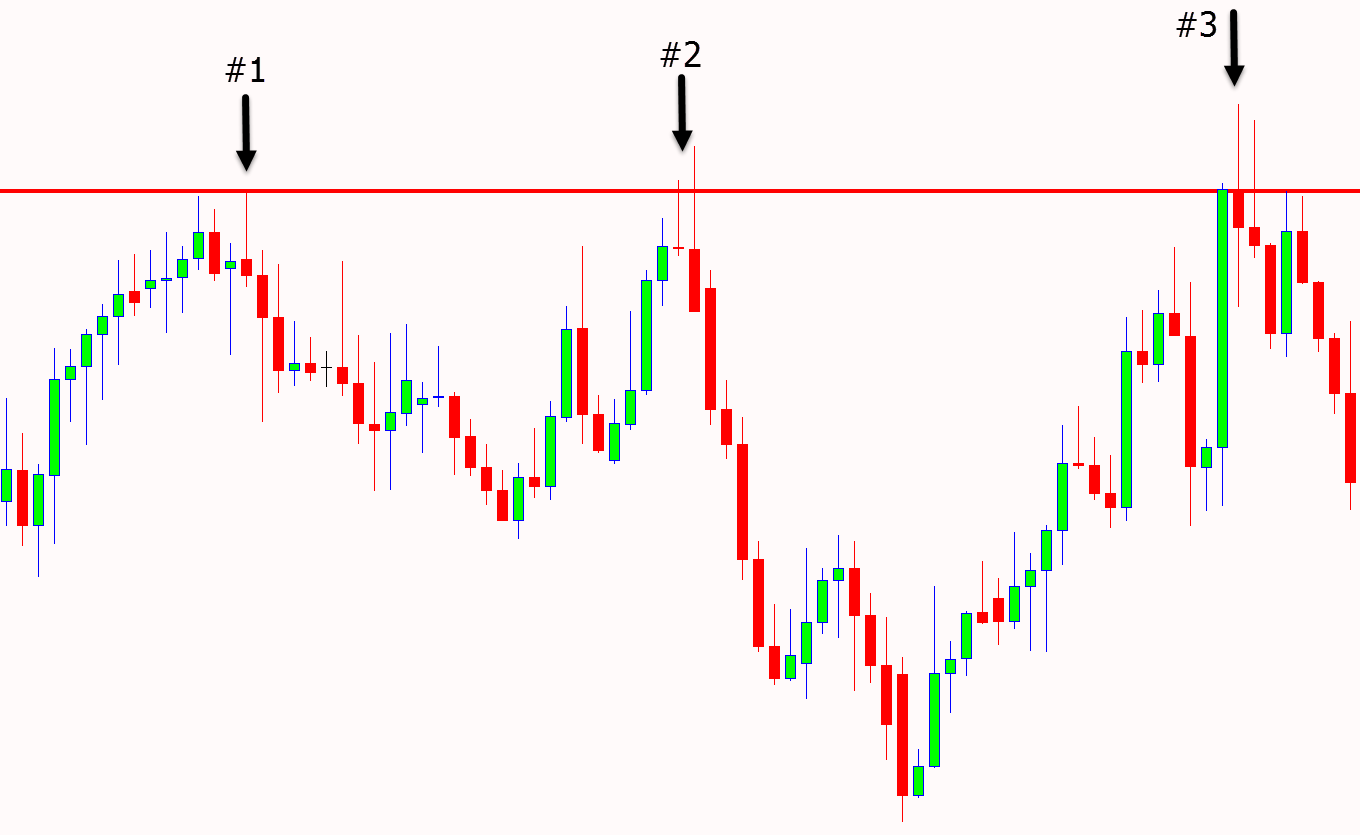
The triple bottom is the same as the triple top, but inverse.
The triple bottom is indicating that the bears may be losing control and that price may soon make a swing back higher.
As the example chart below shows; price forms three distinct lows to form the triple bottom. After the third swing low, price then moves back higher.
Is a Triple Top Bullish or Bearish?
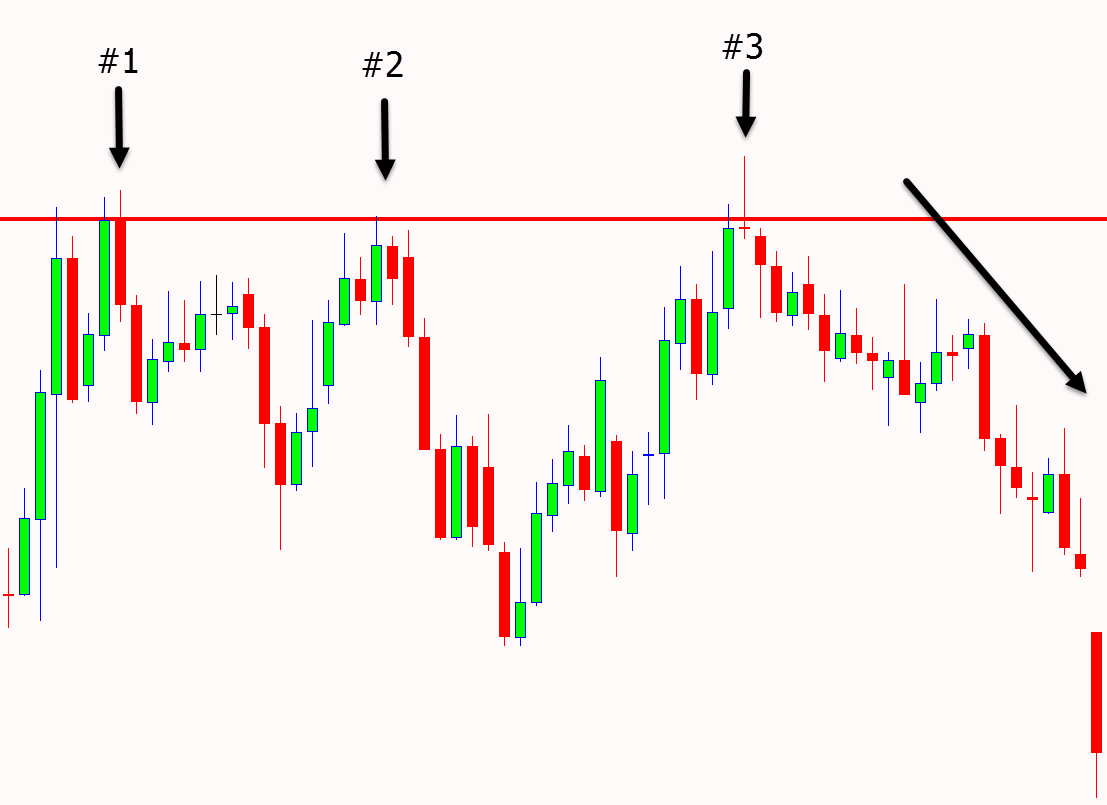
The triple top is normally a bearish pattern.
Price is moving into the same level three times and each time is finding resistance.
This is showing that the bulls are unable to push prices higher and the bears may now be able to send prices back lower.
Is a Triple Bottom Bullish or Bearish?
The triple bottom is traditionally a bullish charting pattern.
Price is moving into the same area three times and each time it is finding support.
This shows that sellers are not able to break this support and push prices lower.
This also could indicate the bulls are about to gain control off the support level and push prices back higher.
How do You Trade Triple Tops and Bottoms?
Triple tops are easy to identify and also to use in your trading. You can identify this pattern on all time frames and in many markets.
Once you have found price making the three lows or three highs at the same area you can begin looking for a trade entry.
Many traders will find using other technical analysis techniques to fine-tune their entry will help the success rate of this pattern.
An example of using other tools may be lining up the triple top or bottom with a key support or resistance level.
You could also look to use candlesticks for price action clues and clearer entry signals.
Other strategies include using indicators such as moving averages to enter with the momentum and trend in your favor.
Simple Triple Top and Triple Bottom Trading Strategy
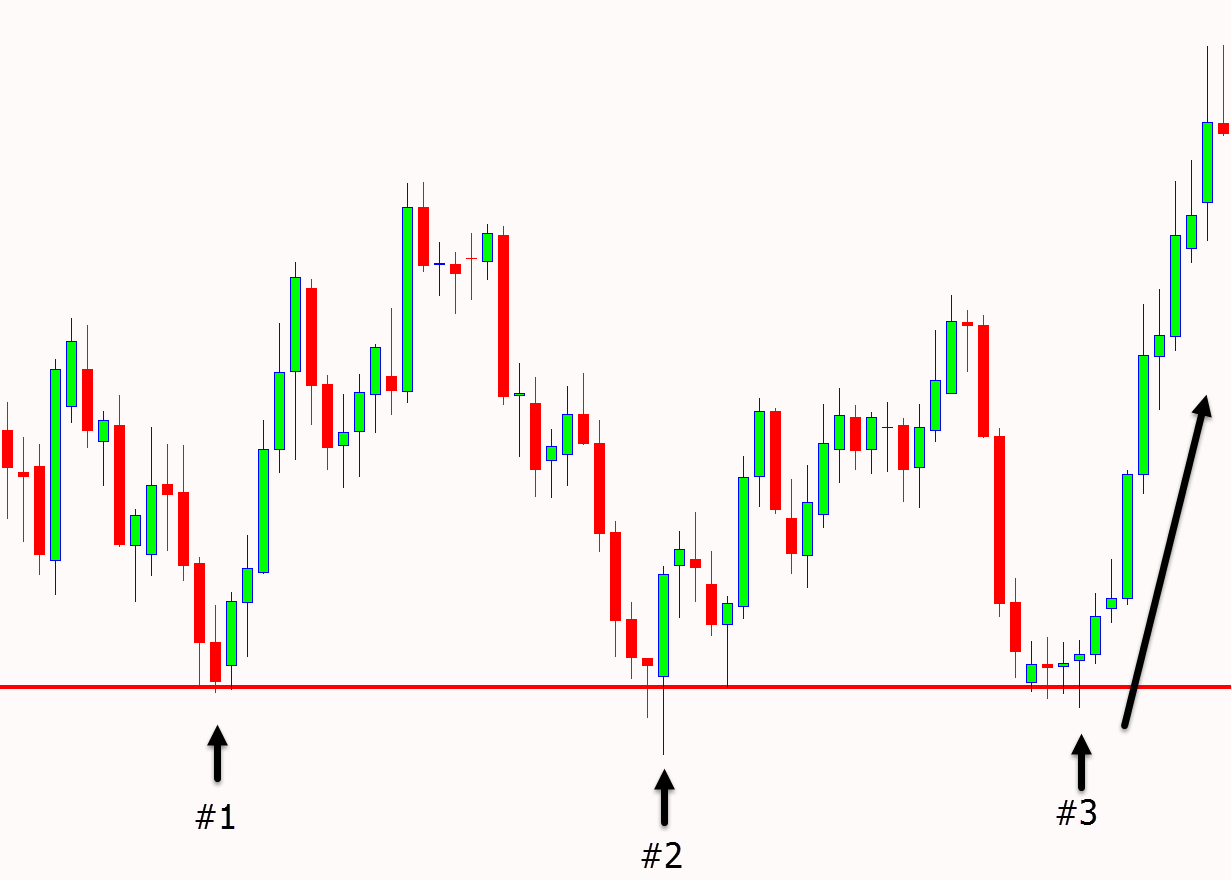
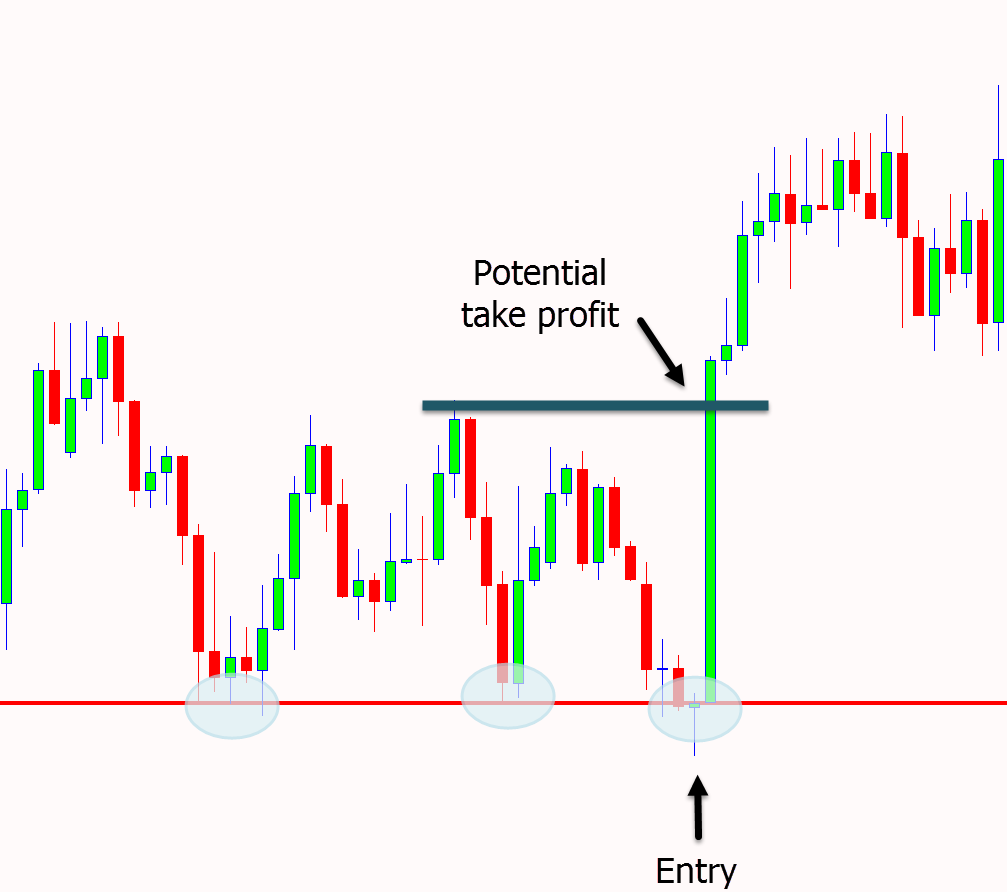
The simplest way to use the triple top and bottom pattern is to first identify when the third leg of the pattern is about to form.
Once you have identified that a triple top or bottom could be forming, you can begin to look for potential trades and profit targets.
As the example chart shows below; price moves lower to create the third low of the triple bottom pattern.
At this point we could be using our other analysis to look for potential trades.
This could include looking for bullish price action candlesticks or lining up the pattern with other technical indicators.
The potential profit target could be when price moves back into the recent swing high and resistance area.
Lastly
Whilst the triple top and triple bottom patterns are excellent patterns to find reversals opportunities, other confirmation is often needed for high probability trades.
Most traders find using their favorite indicators or technical analysis strategies when they have identified the triple top and bottom pattern increases the chance for successful trades.
