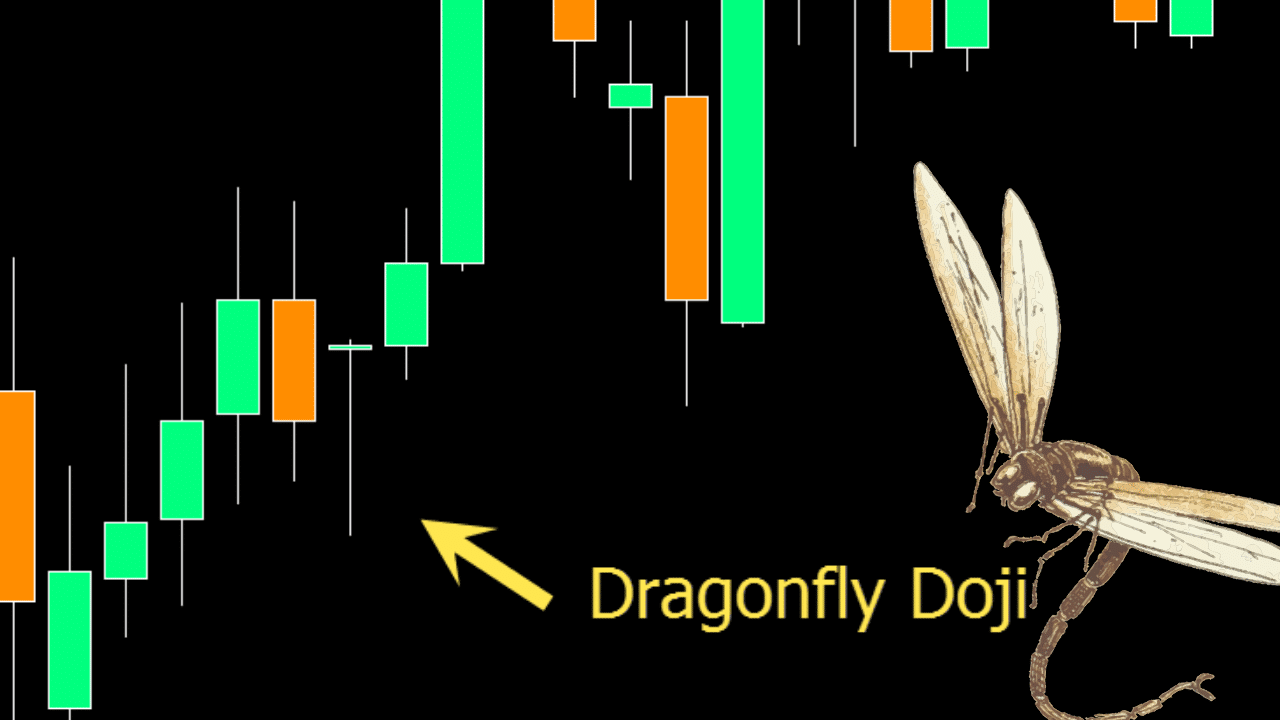
The dragonfly doji is a candlestick pattern that indicates price action indecision that could lead to a potential reversal.
Whilst it is fairly straightforward and simple to identify, the dragonfly doji does not form all that often compared to other candlestick patterns.
Table of Contents
How to Identify a Dragonfly Doji Chart Pattern
The dragonfly doji can be found in all markets and time frames.
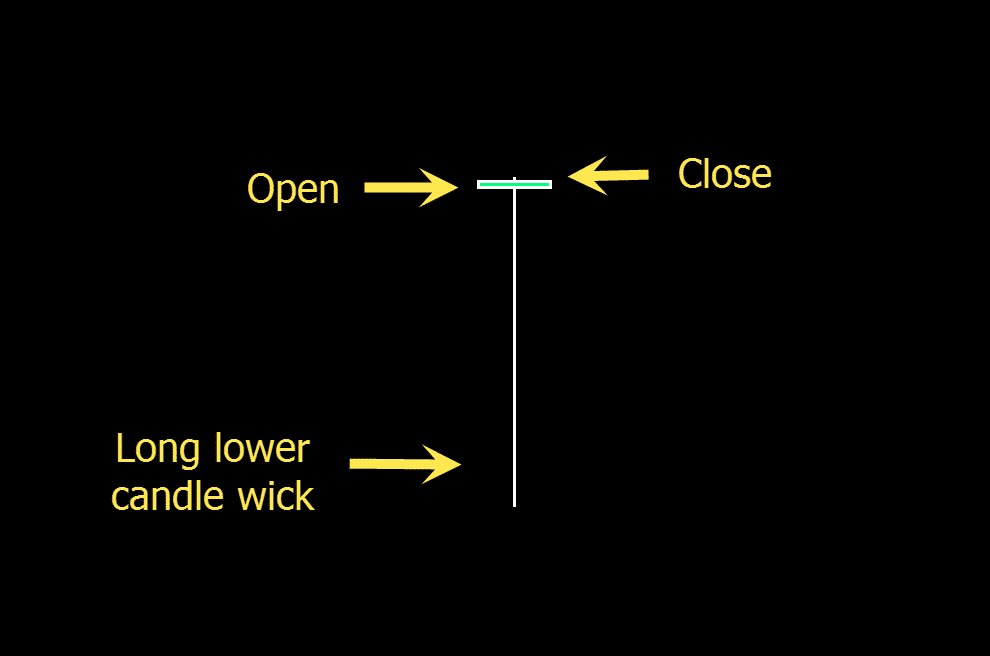
You will be able to quickly spot this pattern as it looks like a “T”.
Example Dragonfly Doji
This candlestick pattern is created with price first opening, then trading lower, followed by price pushing back higher and wiping away all of the sessions losses.
This shows that whilst the bears were at first in control of the selling, at the end of the session that bulls had jumped back in to wipe away any of the losses.
What Does a Dragonfly Doji Signal?
The dragonfly doji can signal both a potential reversal to the upside or downside. That is because it is an indecision candlestick.
Whilst this doji is most often used as a bullish reversal trade setup, it is crucial to know when and where to play them.
If price is in a downtrend or it has retraced lower within a trend higher, the dragonfly doji could be signalling a reversal back higher.
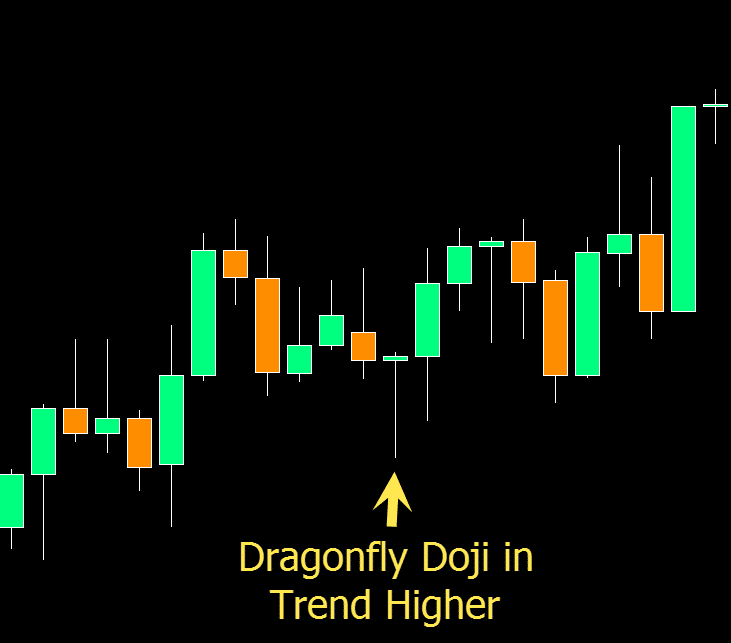
As the chart example shows below; price is in an uptrend and makes a small move back lower.
After this move lower, it forms a dragonfly doji that signals a potential reversal back higher inline with the trend.
The other crucial part to this candlestick pattern is the confirmation. The following candle should confirm the doji.
For example; if looking for a reversal back higher a confirmation would be price breaking to the upside. This could also be a trigger for a trade entry.
How to Use the Dragonfly Doji
Trades are often entered into once price confirms the pattern and the doji breaks.
An example of this may be if looking to go long on a bullish reversal, setting your entry to trigger when price breaks the high of the doji.
Your stop loss for this candlestick pattern could be on the other side of the dragonfly doji and if the pattern does not confirm you would take off your entry order.
Keep in mind this is a one candlestick pattern. It will always work best when you are using it with your other technical analysis and favorite trading indicators.
Because this pattern is a sign of indecision they tend to work best at areas of supply and demand and when trading inline with the overall trend.
Dragonfly Doji Examples
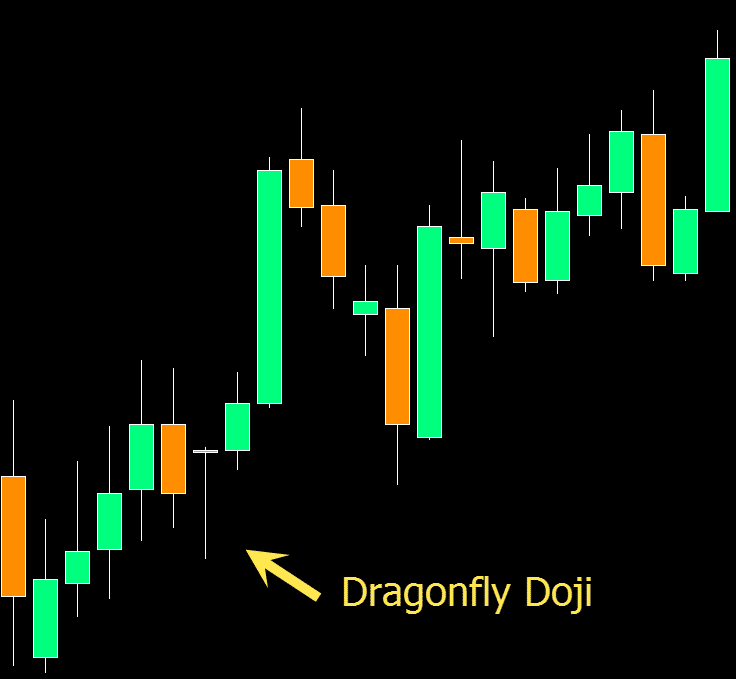
Below is an example of a dragonfly doji that is inline with the strong trend higher.
A potential entry for this pattern could be to enter when price confirms the pattern on the breakout higher.
Once this occurs the stop could be placed below the low of the doji and targets could be set according to your risk reward profile.
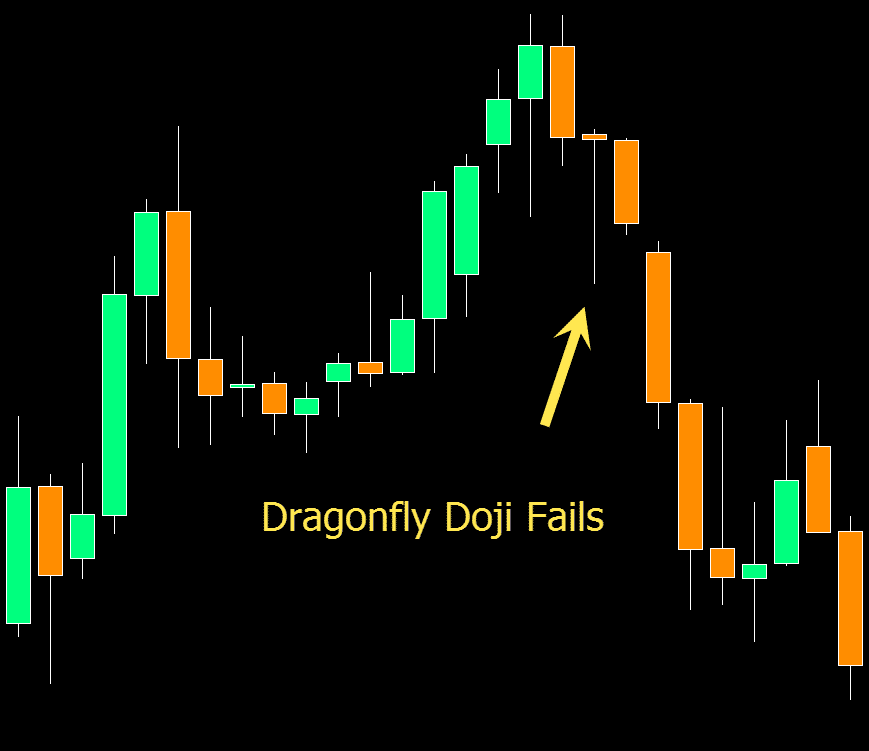
Dragonfly Doji’s Don’t Always Work
Because this is a one candlestick pattern and it is signalling indecision it will not always work.
That is also why it is important you don’t trade this signal by itself and that you use it in conjunction with your other technical analysis.
Below is an example of a doji pattern that will often fake out a lot of traders. This candlestick is up at the extreme high and will often signal price is about to move back lower and not higher as most will look to trade the dragonfly doji.
Lastly
Whilst this can be a very useful chart pattern to use in your trading, make sure you keep in mind where it forms and the other price action context.
It is also important you take note of other important technical analysis factors such as the current trend, the relevant support and resistance levels, trendlines and if price is stuck within a tight ranging market.
