The Fibonacci sequence (simply called Fibonacci) is the term used when referring to a mathematical sequence of numbers
According to the rule of the sequence, all subsequent numbers will be the sum of the two numbers that preceded it (the sum of the two previous numbers).
Fibonacci has become a powerful tool in Forex and other CFD trading.
Fibonacci levels are used in trading financial assets such as Forex, cryptocurrencies, stocks, futures, commodities and more.
The Fibonacci levels, with the help of its retracements, targets, and extensions, are one of the best tools to use in technical analysis.
The strong support and resistance levels (swing points) on the Fibonacci are exact and easy to find. In general, Fibonacci offers clearly defined entry and exit points.
As we go through in this post, the Fibonacci tool can be used to help you both find high probability trades and also where you can take profit from the market.
NOTE: Get your Fibonacci Retracement Trading Strategies PDF Download Below.
Table of Contents
What is Fibonacci Retracement Trading?
Fibonacci retracements are famous among technical traders. This tool is based on the Fibonacci sequence invented by mathematician Leonardo Fibonacci in the 13th century.
The most important thing in the sequence is the mathematical relationships between the numbers, expressed as ratios.
In Forex and other technical analysis trading, a Fibonacci retracement is obtained by taking two extreme points (usually a swing high and a swing low) on a currency, stock, or commodity chart and dividing the vertical distance by the crucial Fibonacci ratios.
The key Fibonacci ratios used in the division are 23.6%, 38.2%, 50%, 61.8%, and 100%.
After identifying these levels, you can draw horizontal lines and uses them to identify possible support and resistance levels. This makes it easier to identify possible entry and exit points on a chart.
Fibonacci retracements allow traders to take a more calculated entry and exit in the market.
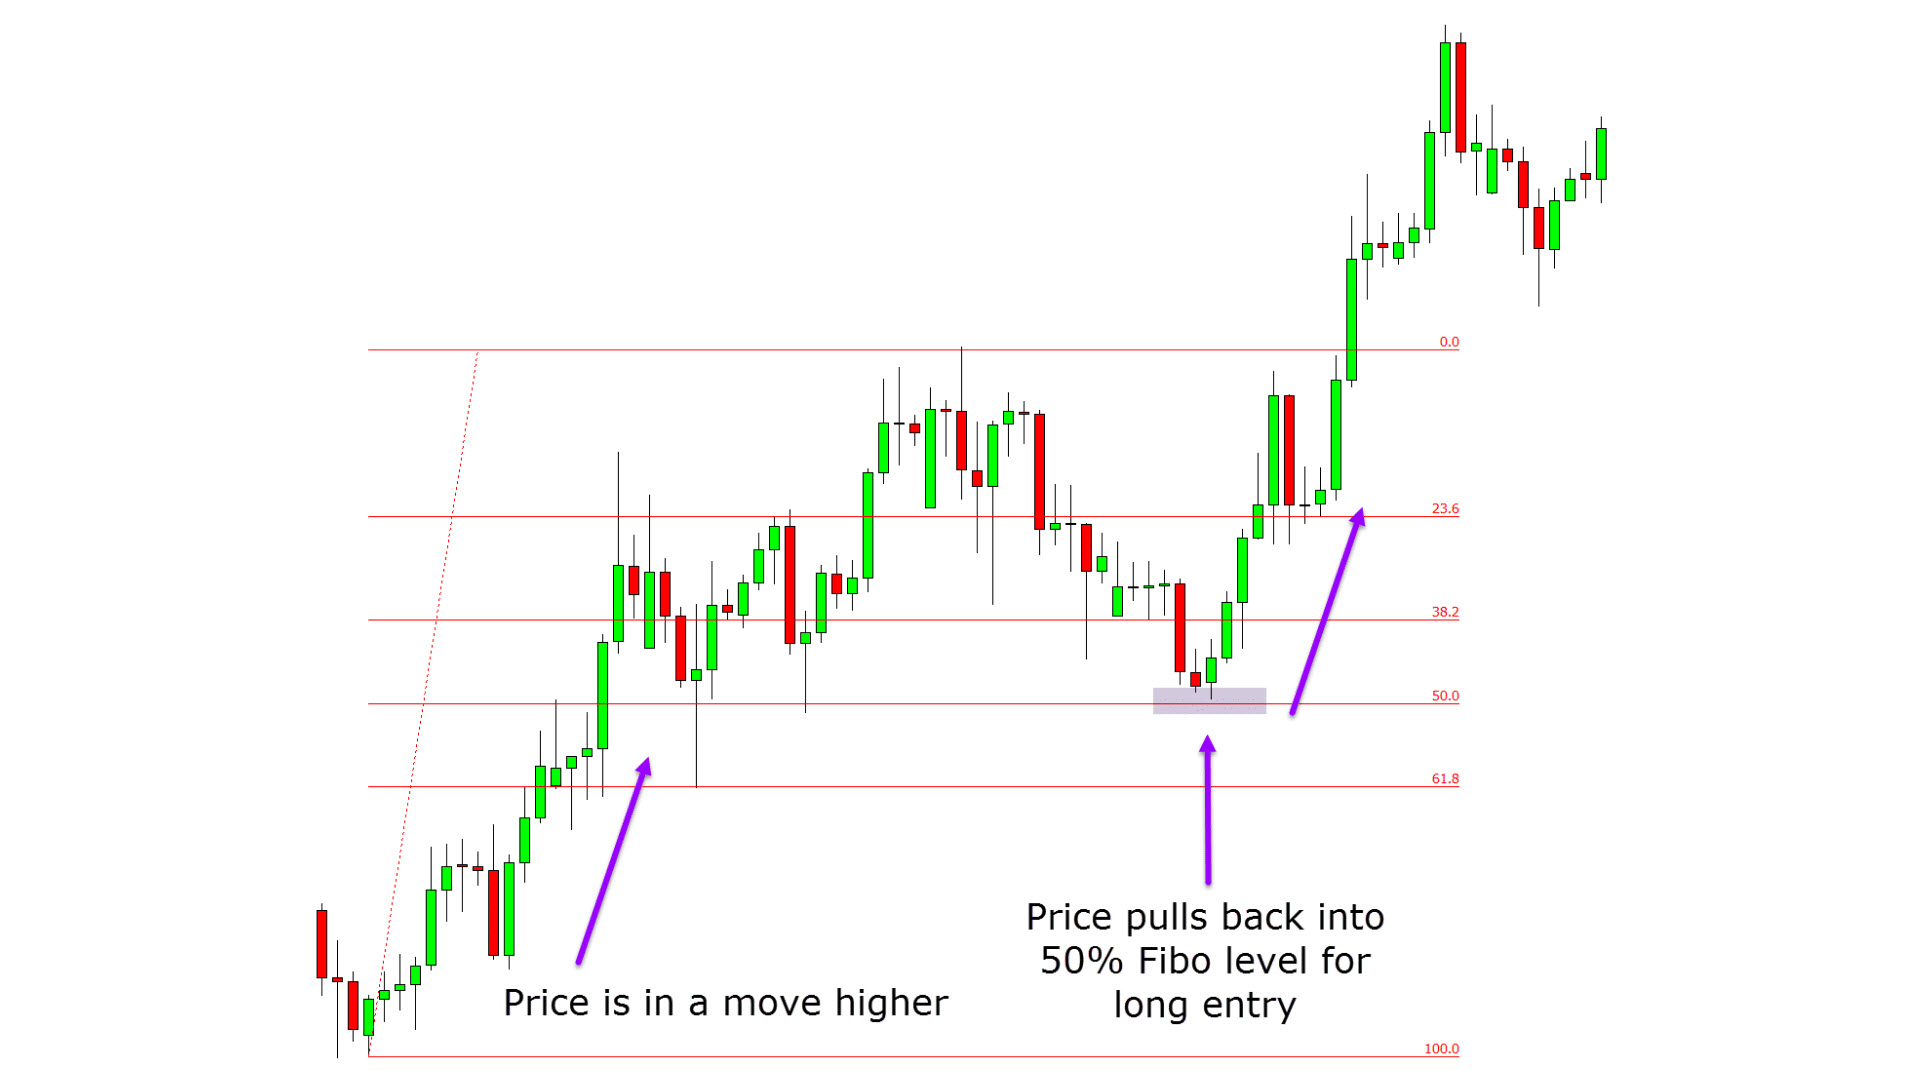
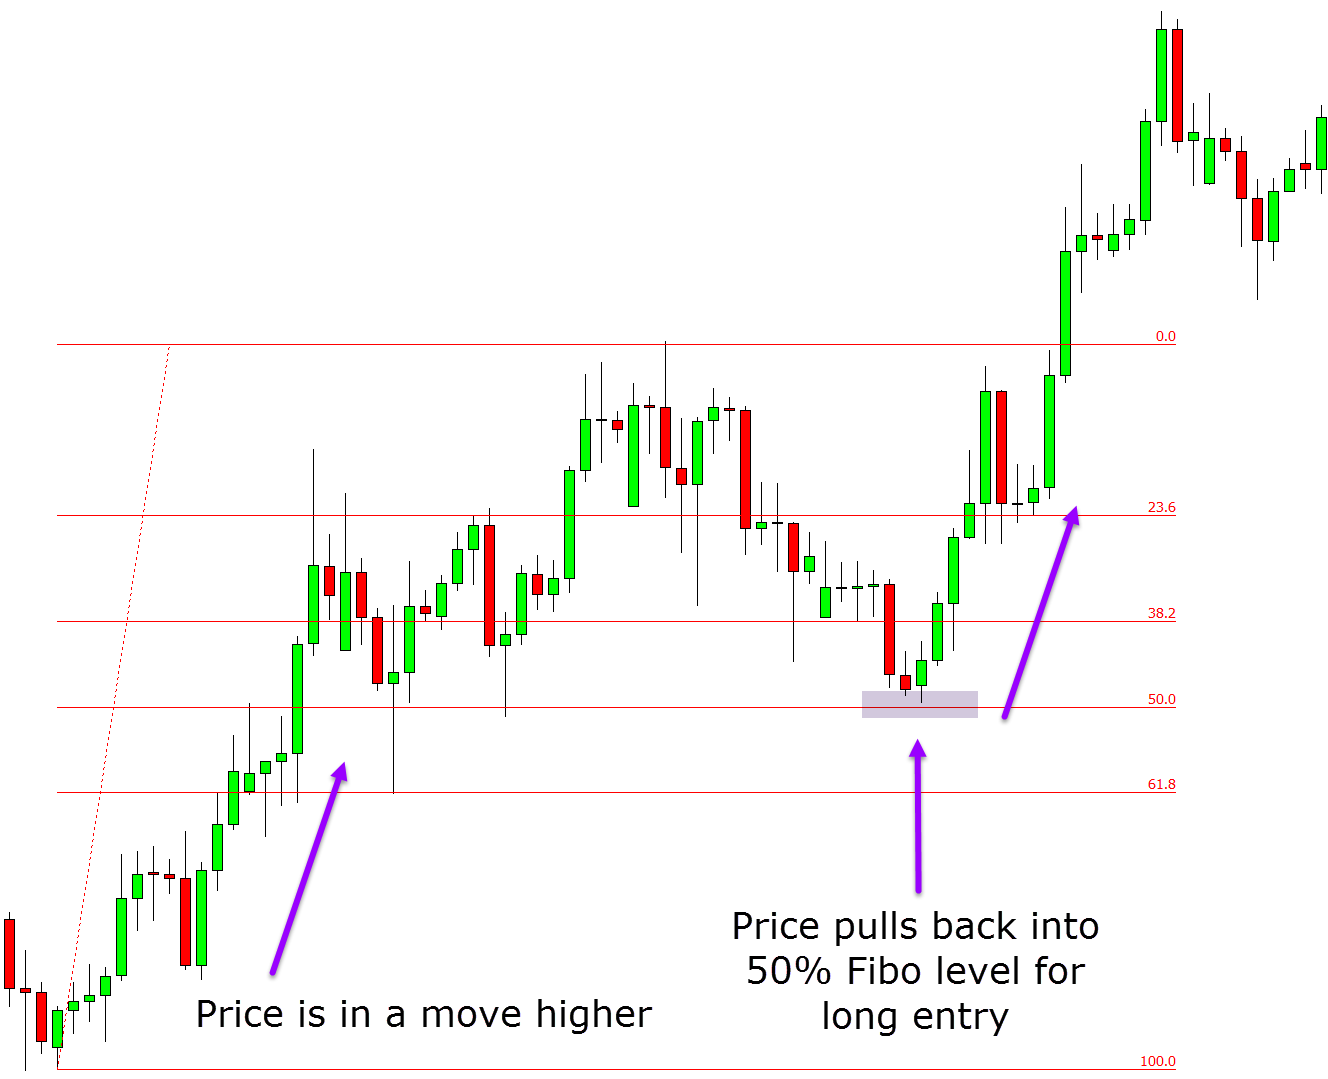
Have a look at the example below. Price is in a move higher before it makes a retracement back into the 50% ‘Fibo’ level for a possible long trade entry.
How to Use the Fibonacci Retracement Tool in Metatrader
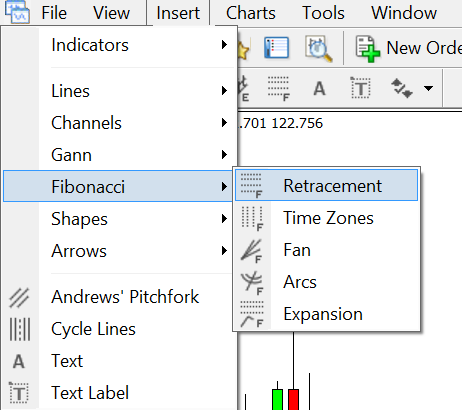
To use the Fibonacci retracement indicator in your MetaTrader charts, open your MT4 or MT5 platform and follow these steps;
- Open the MetaTrader trading platform.
- Click on Insert -> Objects -> Fibonacci.
- Select the Fibonacci indicator.
- Select Fibonacci Retracement and go to your chart. The chart allows you to customize your Fibonacci levels on the MetaTrader.
- Once on your chart click and hold with your mouse to plot your Fibonacci levels.
- NOTE: The Fibonacci levels and descriptions can be added and customized to what you need.
What are the Fibonacci Retracement Settings?
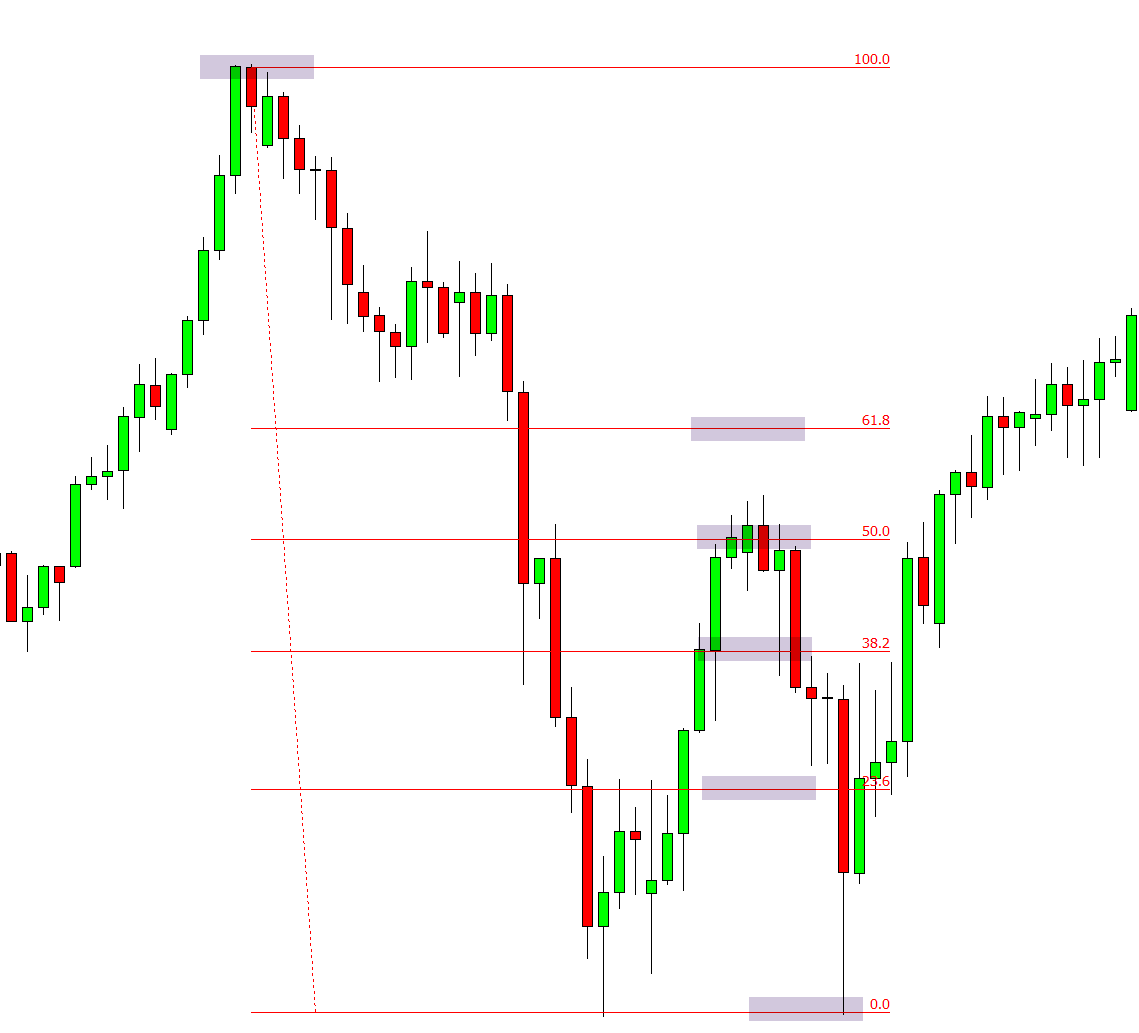
The Fibonacci retracement levels or settings are horizontal lines on a chart that indicate the positions that support and resistance are most likely to take place.
The settings are based on Fibonacci numbers. Each level of the settings is associated with a percentage, and the percentage indicates how much the price has retraced from the previous move.
The Fibonacci retracement levels most commonly used in trading are 23.6%, 38.2%, 61.8%, and 78.6%.
Unofficially, a lot of traders also use 50% as a Fibonacci ratio.
The Fibonacci retracement settings are crucial because they can be drawn between two significant price points, like a low and a high. This helps you know the entry and exit points in a trade.
How to Use Fibonacci Extensions
Fibonacci extensions are tools that traders use to establish profit targets or how far the price of an asset might move after a retracement or pullback has ended.
The extension levels are also likely areas where the price of an asset might reverse.
In Forex and other financial markets, the Fibonacci extension levels help traders to provide price levels of support and resistance.
However, they are mostly used to calculate how far the price of an underlying asset can travel after a retracement is done. This means that Fibonacci retracement levels are used to know when to enter a trend, while the Fibonacci extension levels are used to identify the end of that trend.
The number 1.618 is a key number in the Fibonacci sequence as it is called the Golden Ratio. This number forms the basis of the most important Fibonacci extension level, which is the 161.8% level.
In an uptrend, traders always attempt to enter the bounce point, and they measure the retracement to find out how far the trend will go before reaching its peak, which is the 161.8% level.
Meanwhile, in a downtrend, the traders will attempt to enter the market at a correction point and then measure the last retracement. This allows a trader to find out how far the trend could go before reaching the bottom, the 161.8% level.
Traders looking for reversals might also use the 161.8% extension level to enter a counter-trend trade. However, this technique is most suited to advanced traders with years of experience under their belt.
There is no special formula for Fibonacci extensions. When the indicator is inserted into a chart, the trader selects three points.
After choosing the three points, the traders draw lines at the percentages of that move. The first point indicates the start of a move, the second point shows the end of the move, while the third point is the end of the retracement against the move.
Simple Fibonacci Retracement Strategy
Fibonacci retracements are usually used as a trend trading strategy.
In this case, traders take note of a retracement taking place within a trend and use Fibonacci levels to try to make low-risk entries in the direction of the trend.
Traders that use the Fibonacci retracement strategy expect that the price of an asset has a high chance of bouncing from the Fibonacci levels back in the direction of the earlier set trend.
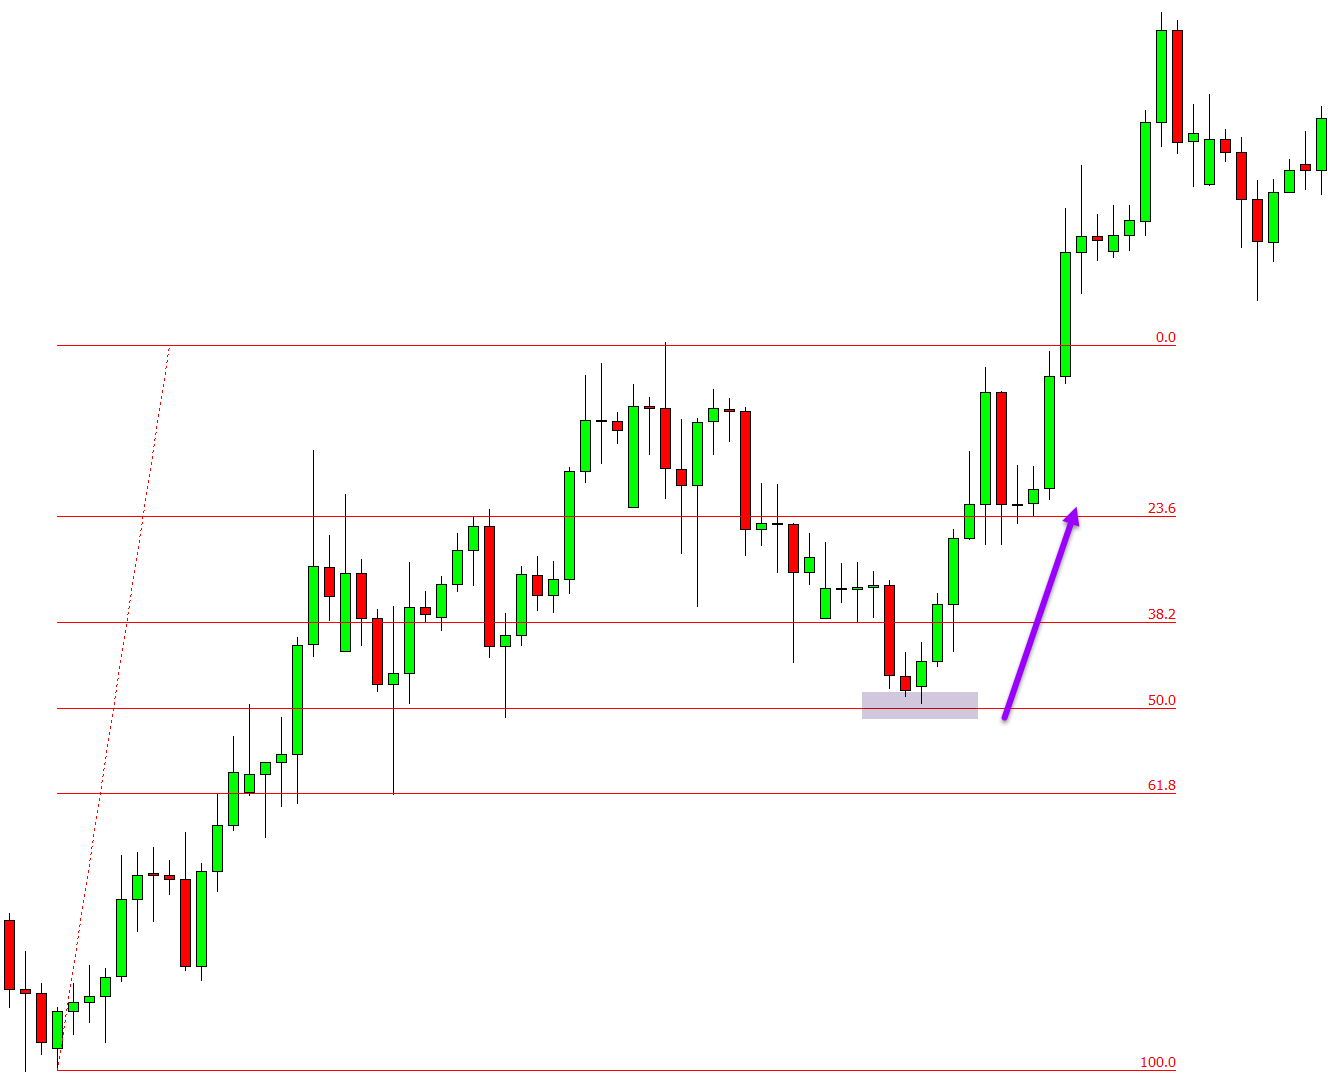
See the example below. Price is in a trend higher and so trend traders are looking for long trades. Using the Fibonacci tool they see that price has moved back lower into the 50% retracement point. This offers potential long trading opportunities to get long with the trend.
NOTE: Get your Fibonacci Retracement Trading Strategies PDF Download Below.
