When swing trading you are looking to find these value areas and then ride the next wave or move (swing).
In this post we look at exactly what swing trading is and the best swing trading indicators to help you find best high value trading opportunities.
Table of Contents
What is Swing Trading?
When swing trading you are looking to make profits from the smaller swings in the market that are occurring in an overall move.
To break this down; whilst price may be making a trend higher, price will still be moving lower and then continuing on higher with the trend.
When swing trading you are looking to enter these swings back and forth that are occurring.
Swing trading is most often done with the trend, but more aggressive traders will swing trade against the trend and also within a ranging market.
You can use swing trading strategies on all time frames from the smaller time frames through to the higher time frames like the daily and weekly charts.
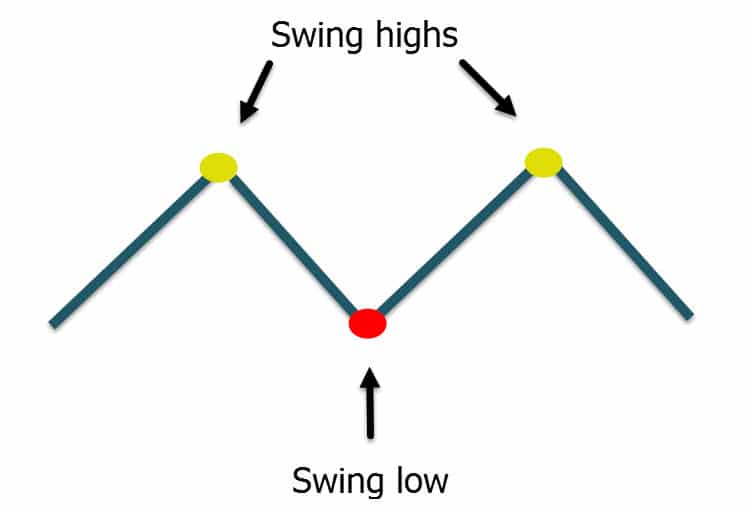
The key to being a successful swing trader is understanding how to identify and then use swing highs and swing lows.
Swing highs are simply the area where price has moved higher before then reversing lower.
Swing lows are the same, but inverse. This is where the price has moved lower, but then reversed and makes the next swing back higher.
As a swing trader you are looking for these swing highs and swing lows for potential entry points so you can find the best value trades.
See the chart below for example swing high and swing low points;
What is a Swing Trading Indicator?
Swing trading indicators can help you identify and find high probability swing trades.
When you are swing trading you are looking to profit from the smaller swings that price is making and the quick momentum.
Using indicators can help you quickly and easily identify these momentum shifts and can also help you spot when a market is overbought or oversold.
Knowing if price is overbought or oversold can be crucial when swing trading. This could tip you off that the price is about to reverse and make a potential swing in a new direction giving you a heads up for a potential trade.
In this post we look at some of the best momentum and reversal indicators that you can use to find swing trading opportunities.
Relative Strength Index
Some of the most popular indicators for swing traders are momentum indicators that highlight oscillations within a broader trend.
One of the most widely used examples of this type of indicator is the Relative Strength Index or RSI.
The RSI can show you if a market is overbought or oversold. This insight could then identify a potential area where price could be about to reverse or make a new market swing.
The relative strength index has a set of positive and negative numbers that are usually set over a period of 14. These numbers are a measurement of the markets positive and negative closes over the previous set sessions.
An oscillator is then plotted on your chart where you can see it move between zero and 100.
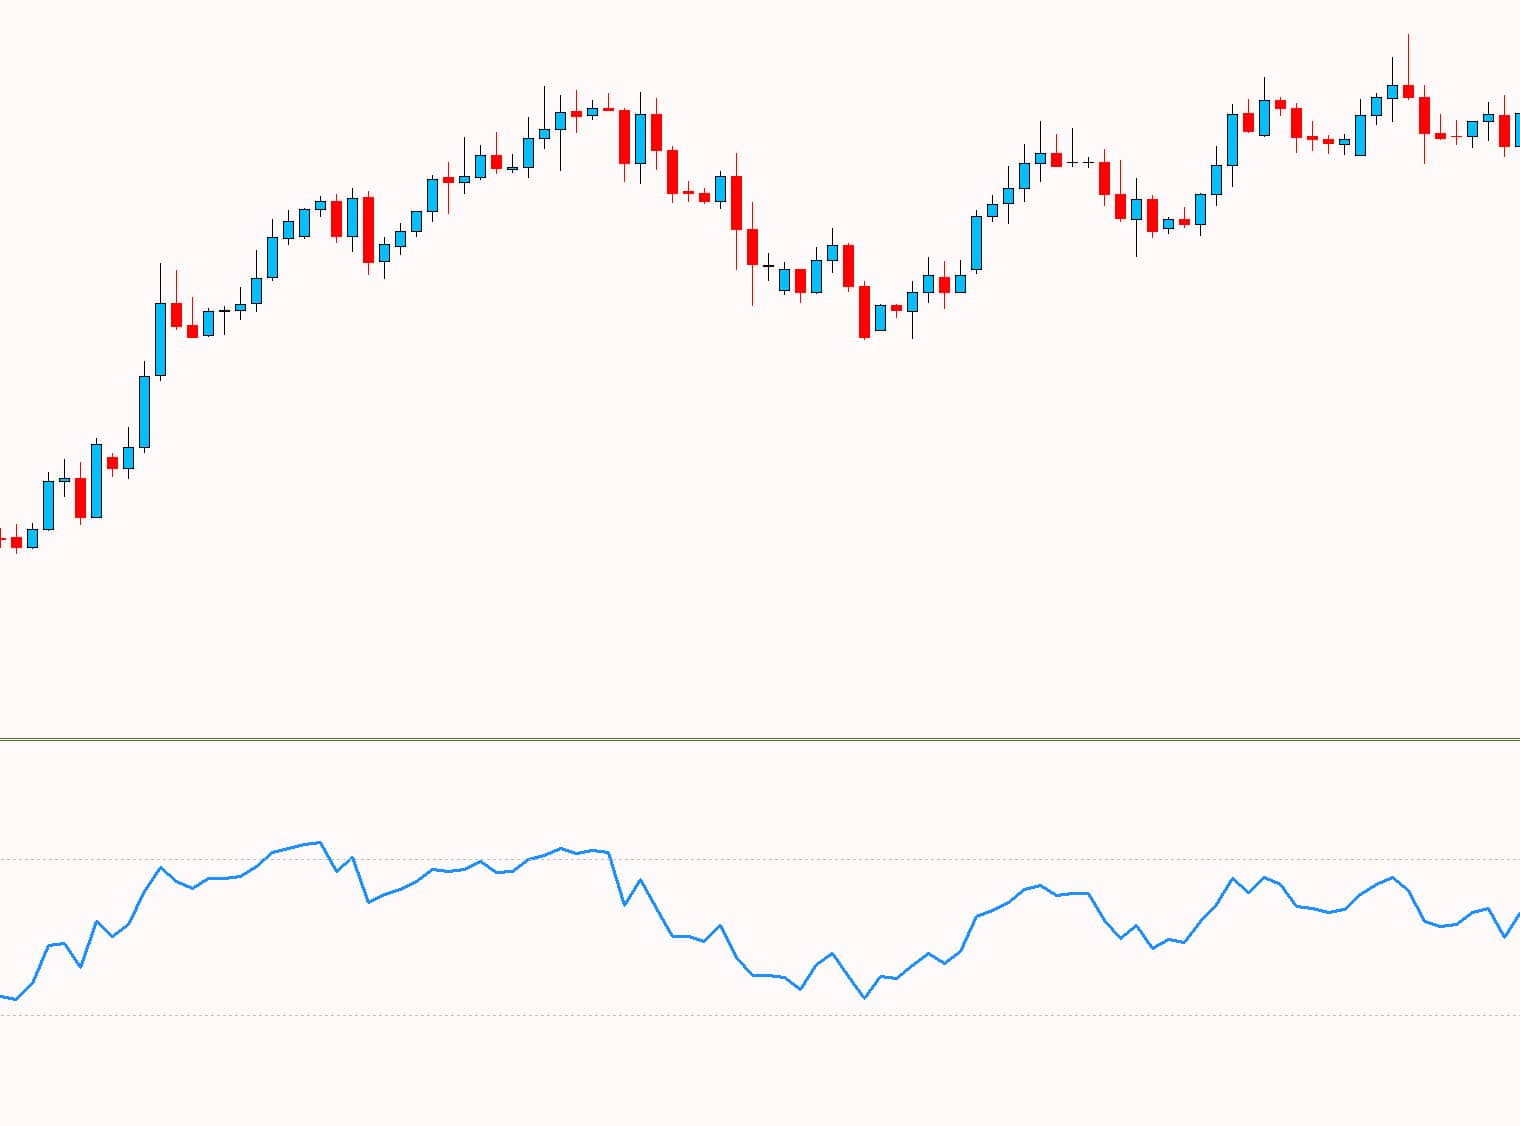
When over the 70 level price is thought to be overbought and when below 30 it is thought to be oversold.
You can then use this to look for potential trades.
For example; if Forex pair XYZ moves into the oversold territory you could begin looking for potential long swing trades.
Stochastic Oscillator
This indicator has been around for a long time.
It was first created in the 1950s and is a momentum indicator that looks at the closing price along with the securities price range over a set period of time.
Using this indicator you can predict potential market turning points and possible swing trade entries.
The stochastic shows you a range between 0 and 100. When the reading moves above 80 it is thought to be overbought. When the reading is below 20 it is thought to be oversold.
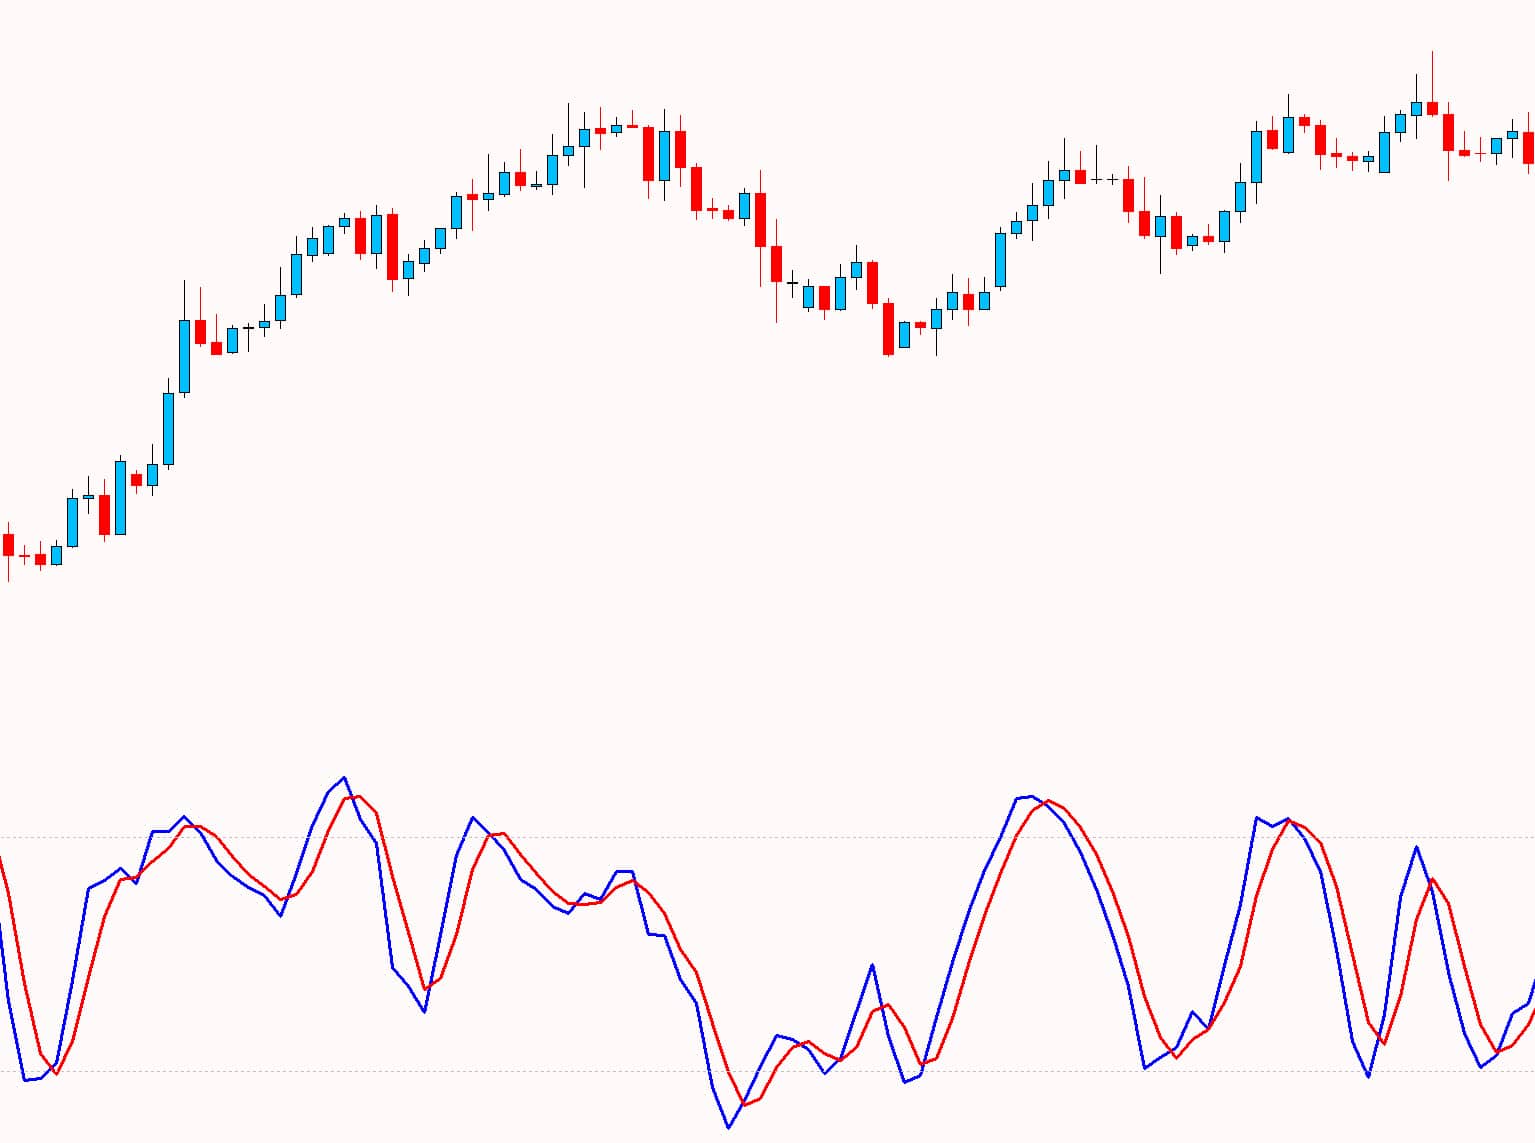
Keep in mind that the type of market is important when using this indicator and looking at the reading will be different for a trending market compared to a ranging market.
Read a more in-depth lesson on the Stochastic Oscillator Indicator
Moving Averages
The most commonly used of all indicators is the moving average.
There are a lot of different settings and strategies that can be implemented with the moving average, but it is also often used as a swing trading indicator.
Moving averages are widely used because they can help you identify a trend and also find dynamic support and resistance as price is moving.
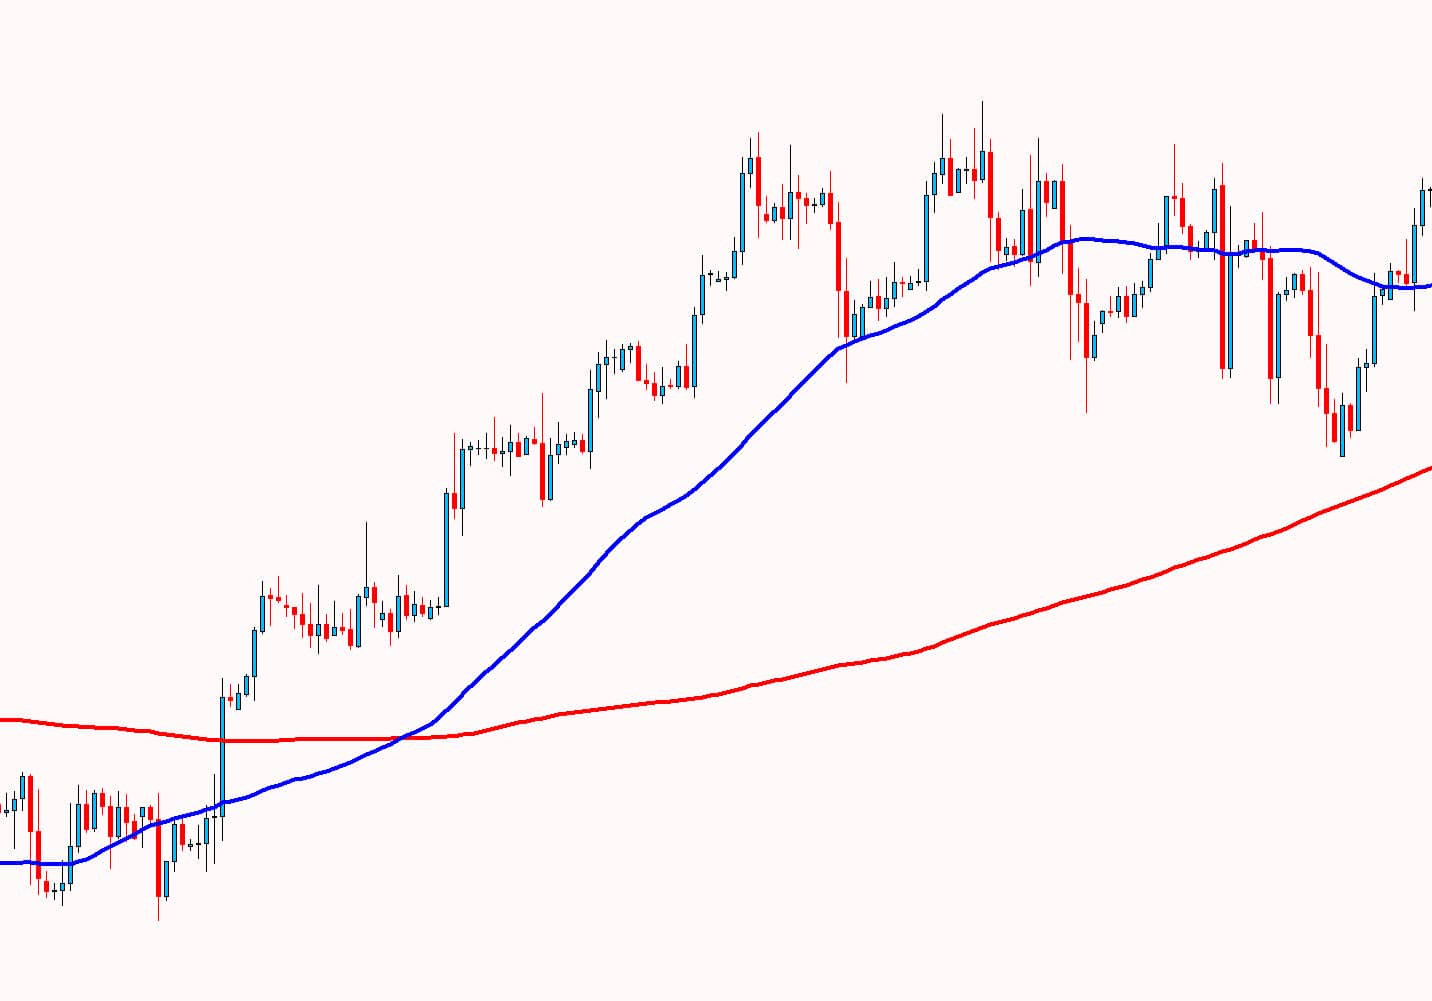
There are two common moving averages, the exponential moving average (EMA) and simple moving average (SMA).
When using a moving average to swing trade you are looking to identify a trend and then trade inline with that trend.
Two main strategies are often used.
The first is looking to find swing trades when price pulls back into the moving averages dynamic support and resistance.
The second strategy is first looking to find a trend with the moving average and then using other tools such as your support and resistance levels to find entry points.
You can read a far more in-depth lesson on How to Use the Moving Average in Your Trading Here
Fibonacci Retracement
The Fibonacci retracement indicator is a very popular tool that is often used to find swing trading reversal points.
The Fibo tool is a mathematical set of numbers, but they are also a set of numbers that are often respected in the markets similar to support and resistance.
Just like support and resistance because Fibonacci is so widely used it becomes self fulfilling. With so many traders watching the same levels, the same levels tend to get respected.
An example swing trade using the Fibonacci tool is below.
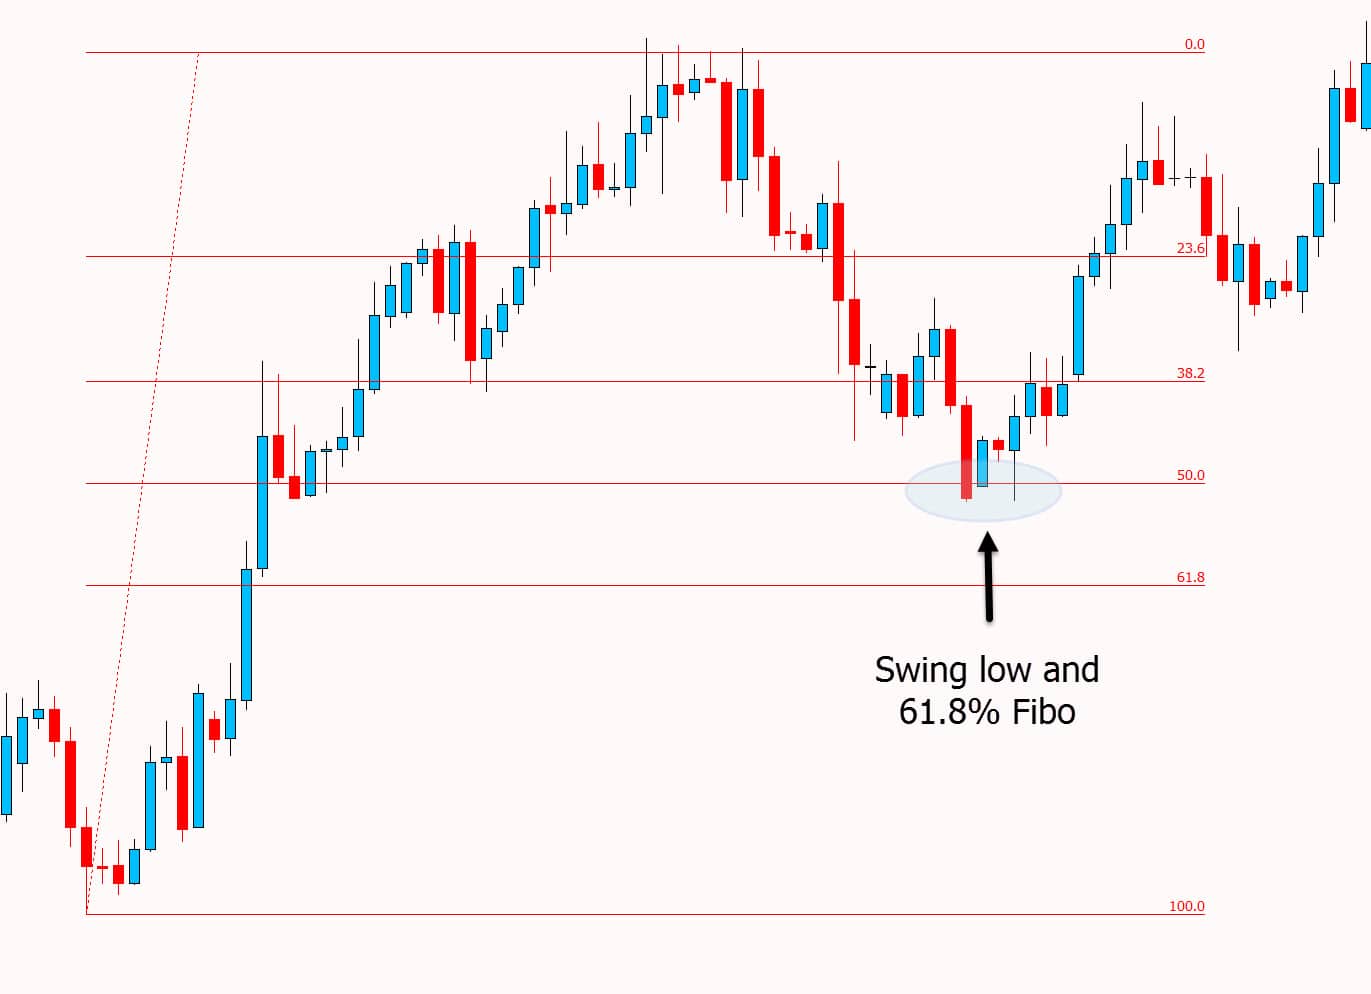
Price is in a trend higher. It moves into a swing low and Fibonacci level 61.8%. Price holds at this level and makes its next swing back higher inline with the trend.
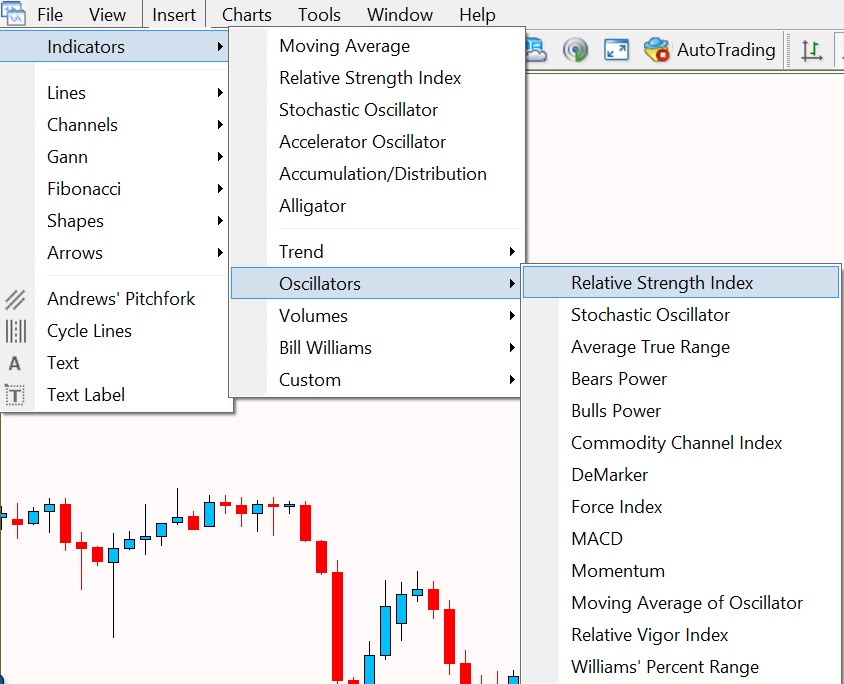
How to Find and Use These Indicators in MT4 and MT5
To use any of these indicators in your MT4 or MT5 is very straightforward.
Follow these steps;
- Open your MT4 or MT5 Charts.
- Click on ‘Insert’ > ‘Indicators’.
- Choose the indicator you would like to add to your chart.
Lastly
Whilst these indicators can be extremely helpful when looking to make swing trades, they are often best used with other tools.
Most traders find combining their other favorite indicators adds confirmation and helps them find better trade entries.
Lastly, always test any new indicators or trading strategies on good free demo / virtual charts to make sure you are comfortable and successful before ever risking real money.
