Pivot points are used by many traders to help them identify potential areas of support and resistance.
One of the reasons pivot points are so popular is because whereas manually drawing and plotting support and resistance is subjective, pivot points are a mathematical calculation and are objective.
In this post we look at what exactly a pivot point is, how to calculate them and how you can use indicators in MT4 and MT5 to have them automatically added to your charts.
Table of Contents
What is a Pivot Point
A pivot point is an area of potential support or resistance where price may ‘pivot’ or change its direction.
To pivot means to turn. These levels are used as potential areas where price may turn.
As we discuss just below; pivot points are formed by using a set calculation. Whilst pivot points are similar to using support and resistance you have marked, or Fibonacci levels, with those two methods you still need to use your own judgment on where the levels should go. Pivot points are calculated and added to your chart as levels.
There are two main strategies used for trading pivot points that we will discuss in this lesson you can implement in your trading; trading from the support / resistance, or trading the breakout.
How to Calculate Forex Pivot Points
Whilst you will not have to manually calculate your pivot points because you can have an indicator do it for you, it is useful to know how exactly your pivots are being created.
The calculation used to create pivot points is;
(High + Low + Close) / 3 = PP (pivot point)
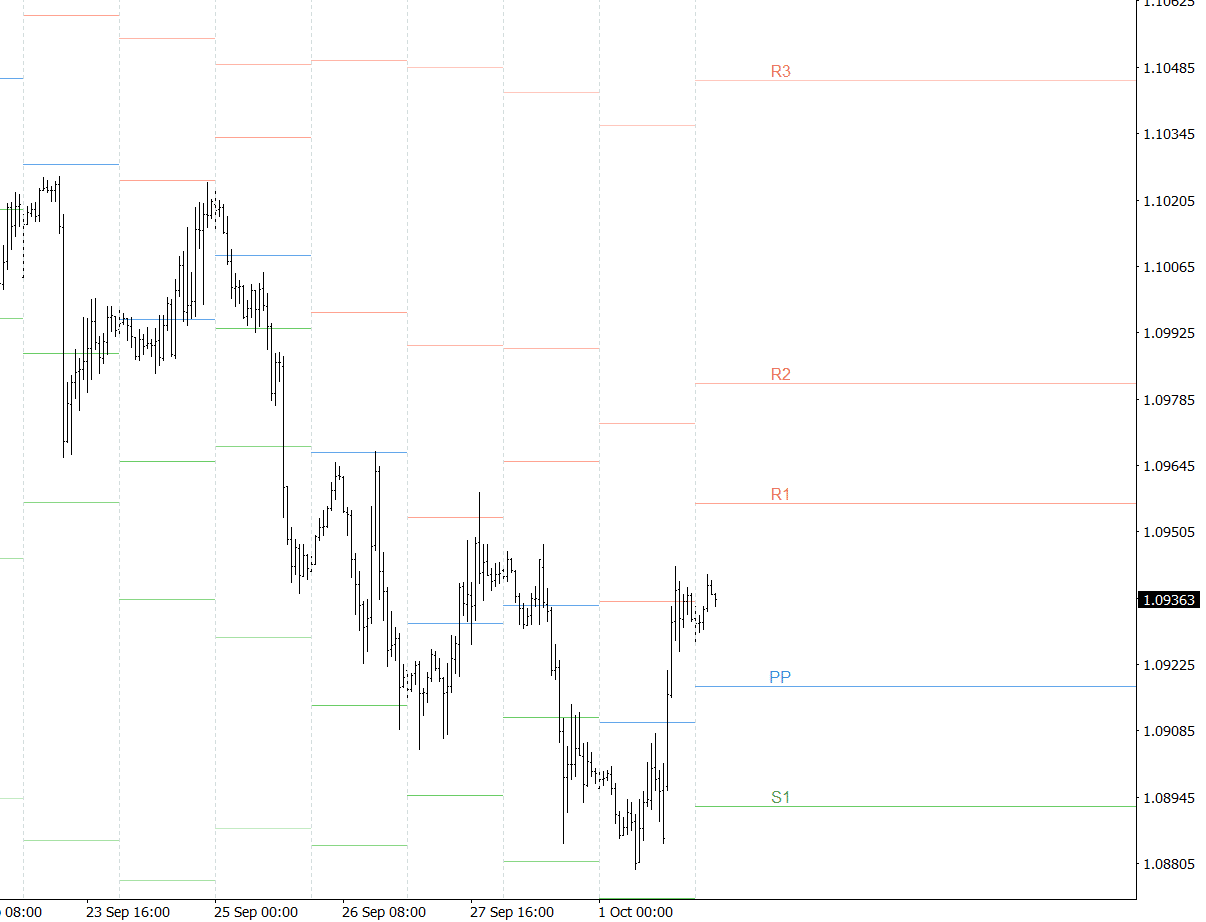
As you can see on the chart below; not just the pivot point is added, but also support and resistance levels. These are calculated by;
(2 x PP) – Low = First resistance level
(2 x PP) – High = First support level
Further support and resistance levels are created with the calculation;
PP + (High – Low) = second resistance level
PP – (High – Low) = second support level
Using a Pivot Point Calculator
Whilst the indicators in this lesson will automatically calculate the pivot points and support and resistance levels for you, you may from time to time want to know where the pivot point levels are on certain markets.
If you don’t want to manually calculate each level you can use a pivot point calculator. There are a bunch of different calculators out there, but probably the simplest and easiest to use is here; Free Pivot Point Calculator.
After you add in all of the relevant information into the calculator, you will be given the different levels.
How to Trade Pivot Points
The most common and also popular way that pivot points are used is as key support and resistance points.
Traders use these levels as both potential turning points and also levels to watch for possible breakout trades.
Because these levels are mathematical calculations and are not subjective they are used by many traders and become incredibly important levels in the markets as more and more watch and trade from them.
Different Pivot Point Trading Strategies
The two best strategies to trade pivot points are;
- Looking to buy or sell from the pivot, support or resistance levels.
- Looking to make fast moving breakout trades when price breaks out of the support or resistance.
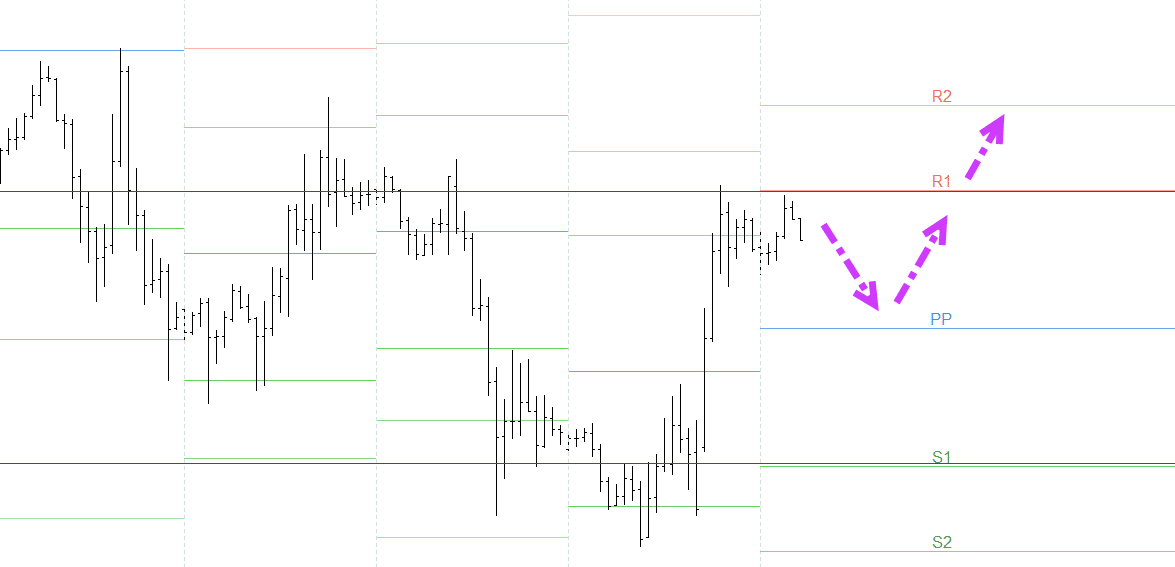
Below is an example of the first strategy. With this example you could look to buy when price moves lower into the pivot point, looking for it to hold as support and then move back into the resistance level 1 and possibly resistance 2.
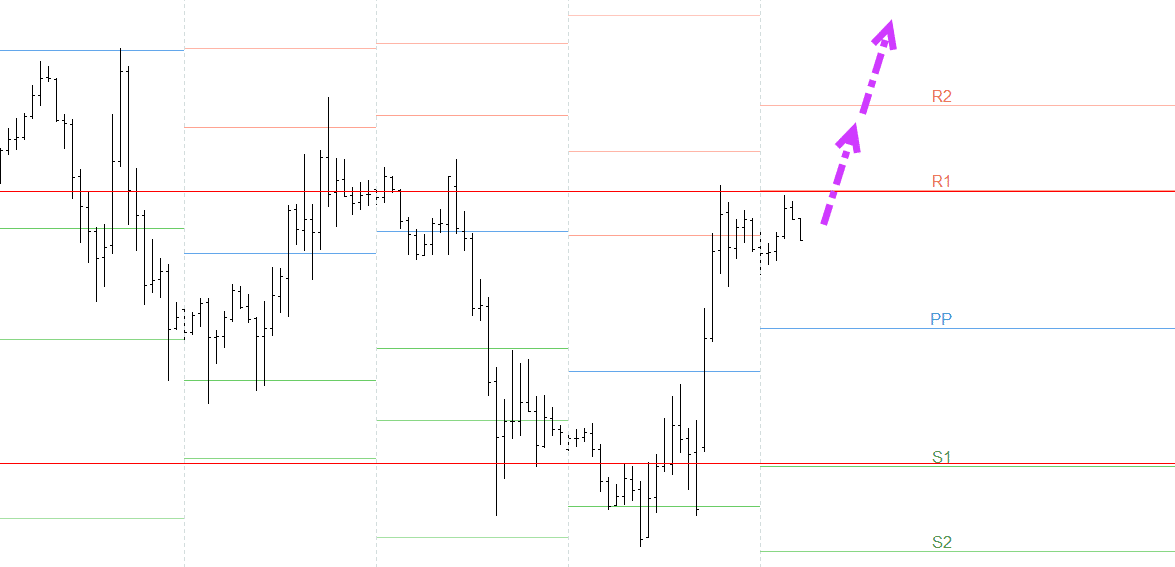
The other strategy you might use is looking to play a fast breakout of the resistance level and then target resistance 2 and potentially resistance 3.
Download and Use Free Auto MT4 Pivot Point Indicator
NOTE: If you do not yet have the correct charts make sure you read about the best trading charts and the broker to use these indicators with here.
This is one of the most popular and easiest to use MT4 pivot point indicators. It is also free to download and use without any registration, which is a big tick.
Once downloaded, installed and added to your chart, this indicator automatically adds the important pivot point levels on your MT4 chart using either: Classical, Camarilla, Woodie and Fibonacci.
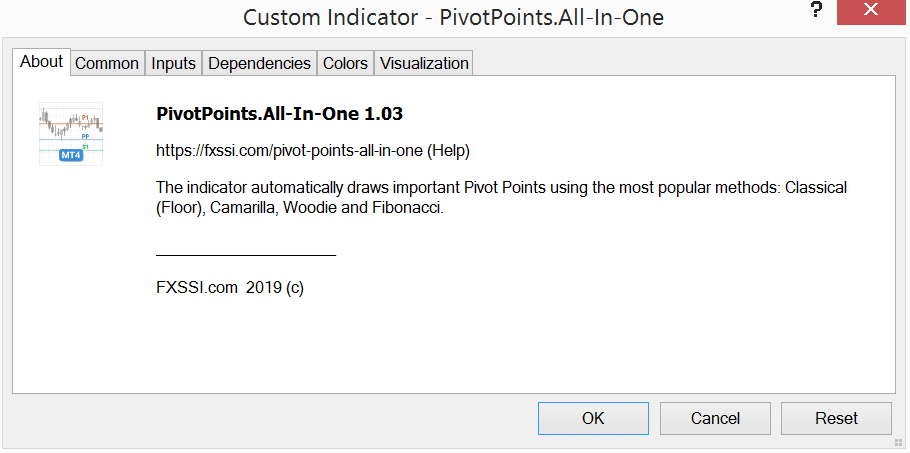
The MT4 pivot point indicator also comes with some handy settings that you are able to customize such as line colors, the amount of periods to use and how many period to show on your charts.
Get the MT4 Pivot Point Indicator by FXSSI
Download and Use MT5 Pivot Point Indicator
NOTE: If you do not yet have the correct charts make sure you read about the best trading charts and the broker to use these indicators with here.
This is a simple, clean and easy to use MT5 pivot point indicator. Once downloaded and installed you will be able to use it to mark your pivot points and three support and resistance levels.
Using the data from the previous days session it calculates the support and resistance levels using the same calculation method discussed in this post above.
When added to your chart you will have three different colored lines. Orange representing the pivot point, red for support levels and green for resistance levels.
Get the MT5 Pivot Point Indicator
Lastly
Whilst pivot points are mathematical calculations using the previous price actions data, you should still use other strategies to increase your chance of making winning trades.
These strategies might include using other technical analysis methods, candlestick patterns or other indicators such as a moving average.
