Forex trading has evolved massively over the past few decades with the creation of trading tools designed to make it easier for virtually anyone to trade currencies. Chart pattern recognition has become an essential aspect of Forex trading because it can quickly help you find profitable trades.
There are many chart patterns that you can use for technical analysis, and some of the most popular are harmonic patterns.
Harmonic patterns use Fibonacci numbers to define precise turning points. Whilst most of the other common trading methods focus on analyzing the current price action of a currency pair, harmonic trading attempts to predict future movements.
This more complex nature makes it harder for some traders to understand. However, in this post we break harmonic patterns down so you can understand them and use them in your own trading.
Note: You can get your free harmonic pattern trading strategies PDF guide below.
Table of Contents
What are Harmonic Patterns?
Harmonic patterns were first introduced into the trading scene in 1932 by Harold McKinley Gartley.
Harmonic patterns are a type of advanced trading pattern that take place naturally in financial charts.
These patterns follow geometric price action and Fibonacci levels.
Harmonic patterns can be defined as trend reversal patterns based on retracement levels, geometric structures and Fibonacci extensions.
These patterns offer a way for you to establish where the key market turning points will occur. They also provide you with levels that may act as new potential reversal zones, allowing you to enter reversal trades. When you have correctly identified a high probability harmonic pattern you will be able to enter your trade in a highly profitable reversal zone with little risk.
How do Harmonic Patterns Work?
Harmonic patterns work by combining patterns and mathematics. This trading method is precise and based on the assumption that patterns repeat themselves.
The primary theory behind harmonic patterns is centered on price/time movements, which complies with the Fibonacci ratio relationships.
The Fibonacci ratio analysis works exceptionally well in the forex market and you can use it on any timeframe chart. The main idea of Fibonacci is using the key ratios (0.618 or 1.618) to identify the main turning points, retracements, and extensions on a chart. These can also help you identify the swing high and swing low points.
The projection and retracement levels that are derived using the high and low swing points will give you key price levels that you can place both your stops and targets.
Harmonic patterns can indicator potential price movements and key reversal or turning points. This can give you a major advantage because these patterns can give you very accurate entry, stop loss and target levels.
Types of Harmonic Patterns
There are many types of harmonic patterns that include;
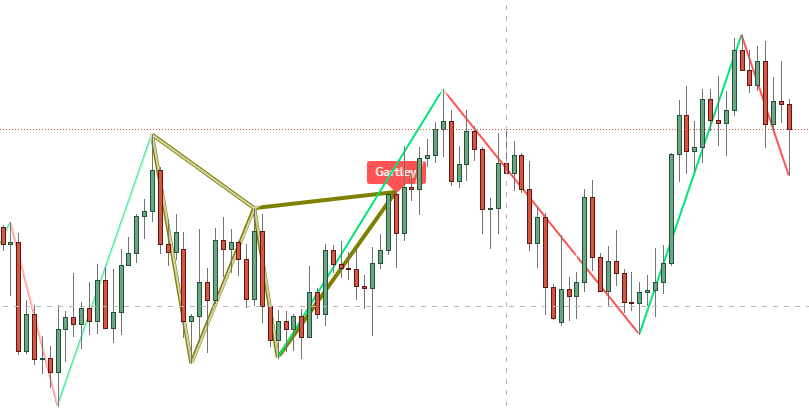
Gartley Pattern
This is a simple harmonic pattern that was developed by Harold McKinley Gartley. The Gartley Pattern, also known as the 222 pattern is a harmonic pattern usually preceded by a significant low or high. The Gartley pattern is usually formed when there is a correction of the overall trend. The bearish Gartley Pattern is W-shaped, while the bullish Gartley looks like M.
Butterfly Pattern
The Butterfly pattern was first created by Bryce Gilmore and it is similar to the Gartley pattern. The bullish butterfly indicates that traders should buy an asset. The bearish butterfly indicated a new potential sell trade. Butterfly patterns are important because they help you identify the end of the current move.
Crab pattern
The crab pattern was created by Scott Carney. This particular pattern is considered one of the most precise harmonic patterns. The crab pattern provides reversals in very close proximity to what the Fibonacci numbers show. This pattern is similar to the Butterfly pattern, but differs in it’s measurement.
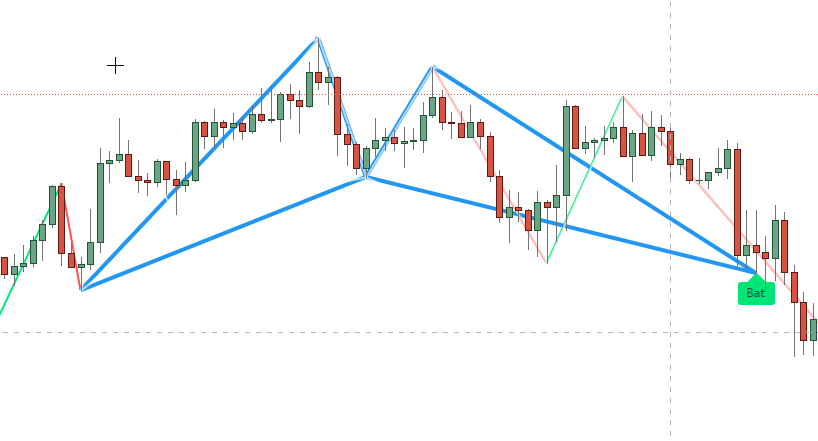
Bat Pattern
Scott Carney also invented the Bat Pattern in the early 2000s. This pattern is similar to the Gartley pattern because it is a continuation and retracement pattern that is usually formed when a trend temporarily reverses its direction, but stays on its original course.
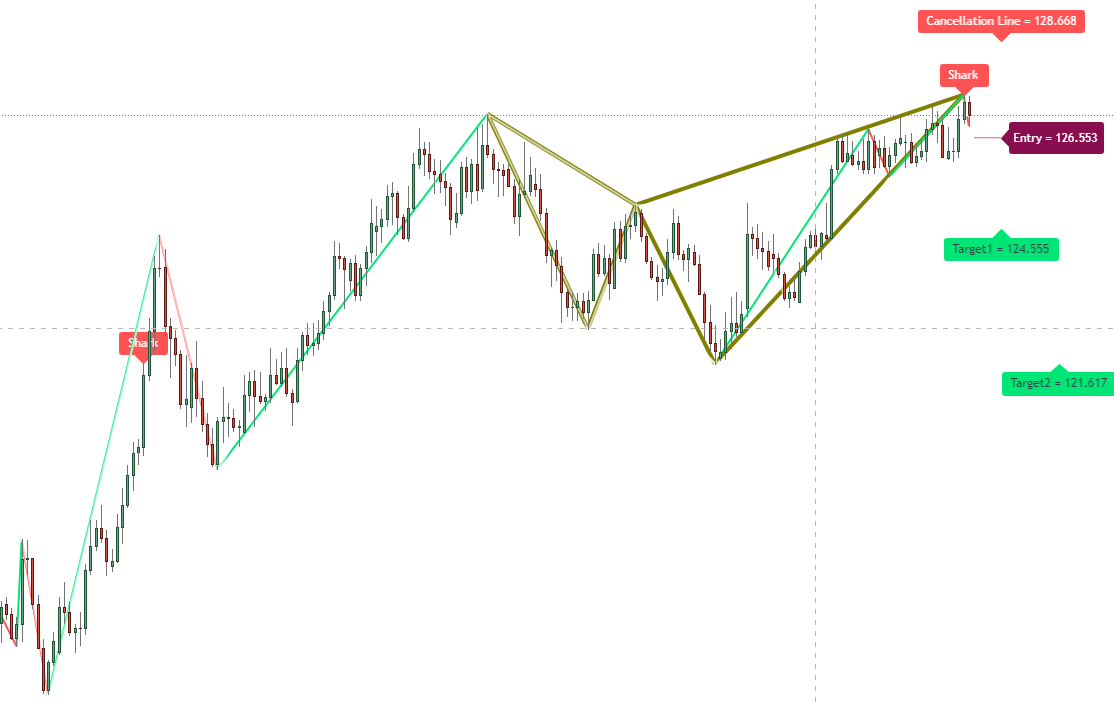
Shark pattern
This is one of the newer harmonic patterns and was founded in 2011. This pattern gets its name because of its steep outside lines and shallow dip in the middle that when formed on a chart resemble a dorsal fin.
Cypher pattern
The Cypher pattern uses Fibonacci ratios lesser than one. When this pattern is formed it creates a steeper visual appearance compared to the other harmonic patterns. This pattern has five touch points and four waves or legs between them. The touch points on this pattern are reversal levels.
Note: You can get your free harmonic pattern trading strategies PDF guide below.


