Bar charts, candlestick charts, and line charts are the three most commonly used charts in the markets for trading.
But, did you know there are other less popular techniques like the Heikin Ashi which has proven to be one of the best strategies to use to gain a deeper view of the market.
In this post we look at exactly what the Heikin Ashi is and how you can use it.
NOTE: Get your Heikin Ashi PDF Download Below.
Table of Contents
What is Heikin Ashi?
Heikin-Ashi, also called Heiken-Ashi, is translated as an “average bar” in Japanese.
The Heikin Ashi strategy is a useful tool used in identifying market trends and predicting the future prices of assets.
The Heikin Ashi can be used alone or in conjunction with candlestick charts.
These charts can be very useful as they make it easier to read candlestick charts and analyze market trends.
Traders use the Heikin Ashi to get information such as when to stay in a trend trade or if it’s time to get out because the trend has reversed.
Traders make money when markets are trending. This makes predicting a markets trend correctly super important.
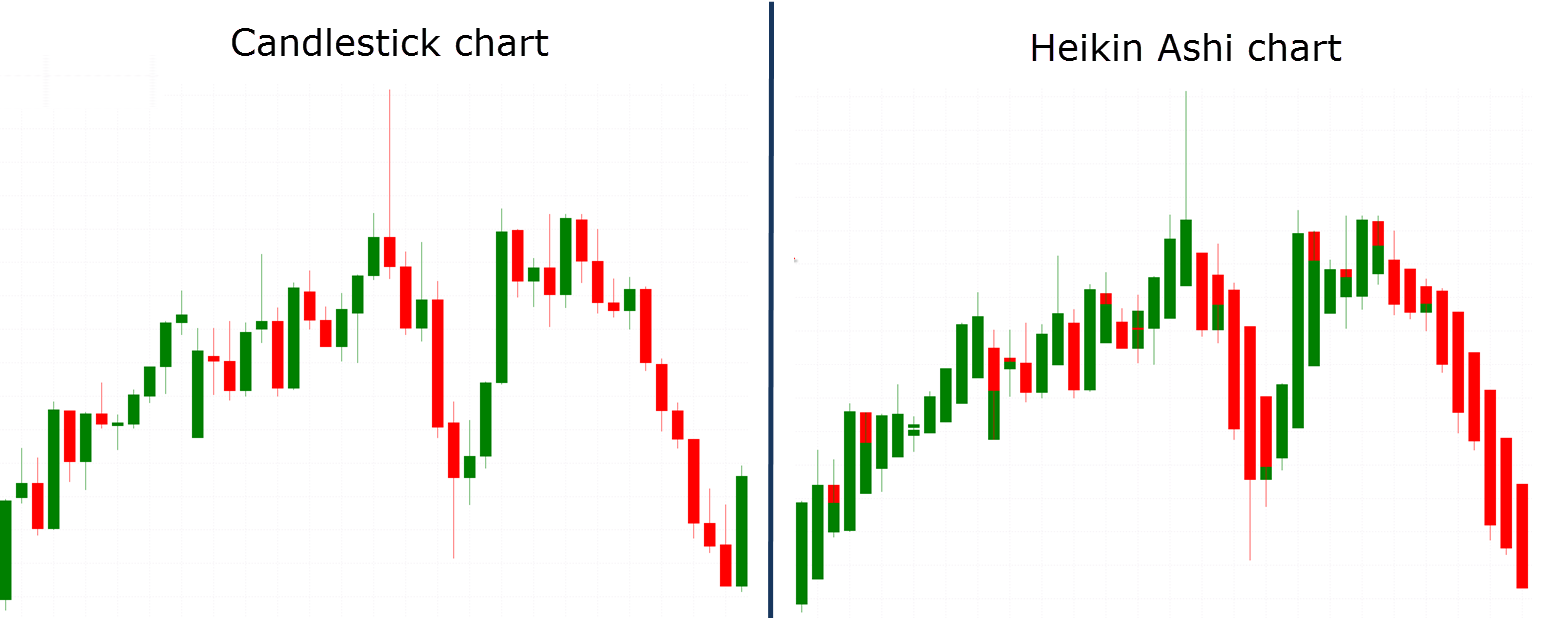
Heikin Ashi vs Candlestick
The Heikin Ashi has a few differences with the traditional candlestick chart.
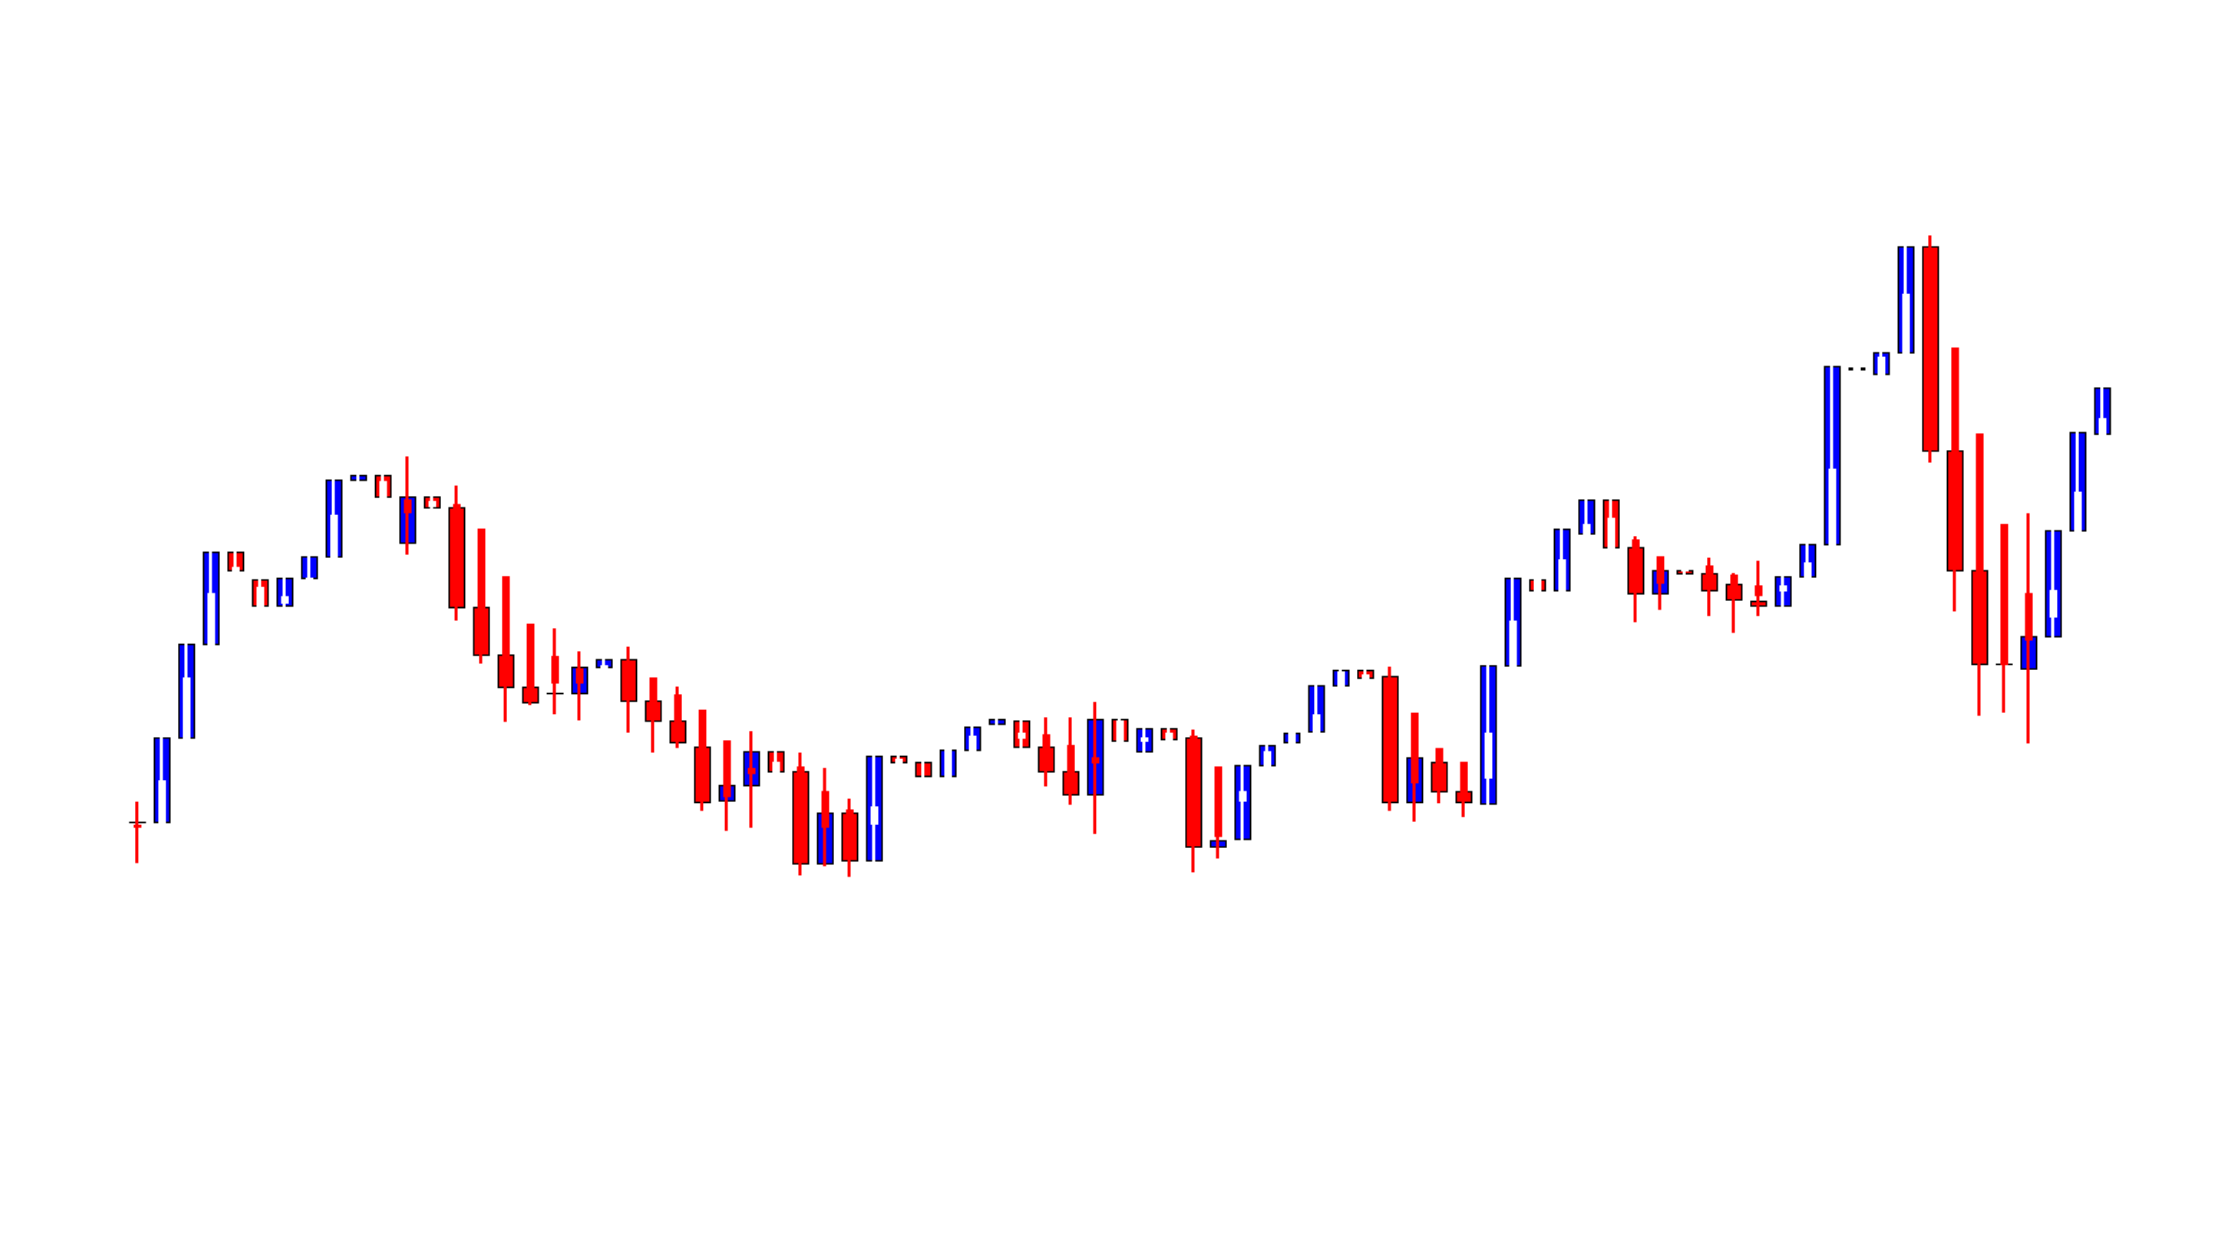
The candles on traditional candlesticks usually change from green to red (up or down), making it difficult for some traders to interpret.
However, the candles on a Heikin Ashi chart display more consecutive colored candles, making it easy for traders to identify past price movements and current trends.
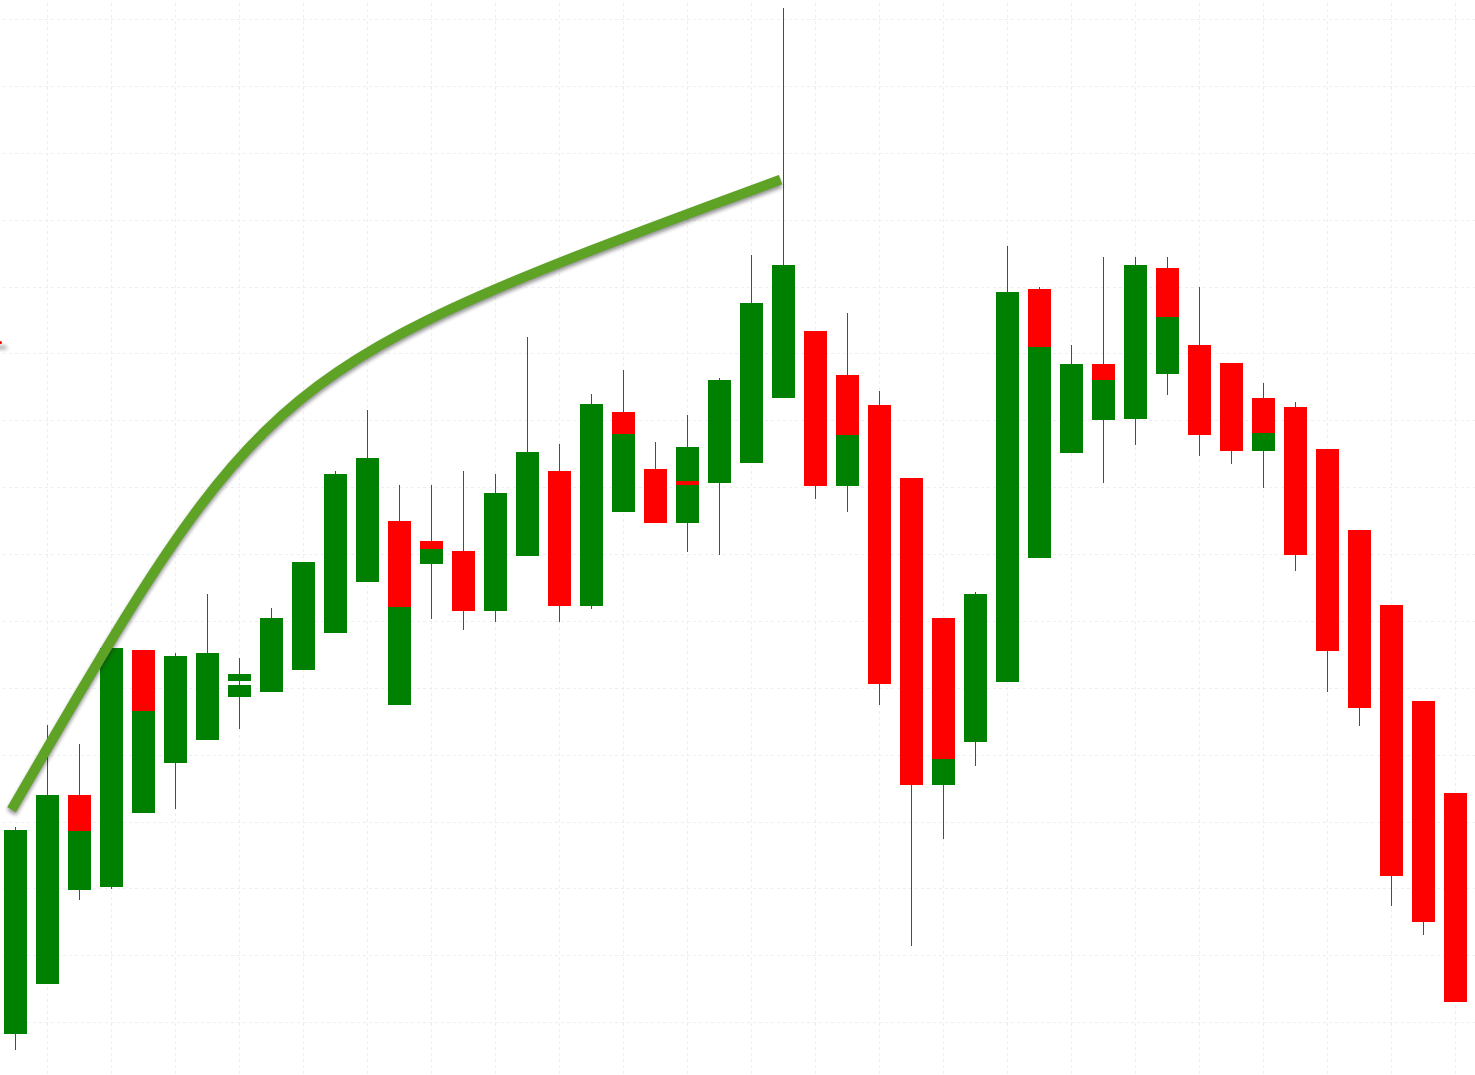
With Heikin Ashi, charts usually stay green in an uptrend and red in a downtrend.
This isn’t the case with the traditional candlestick charts where colors are different even if the price is moving strongly in one direction, but price just moves slightly lower for one session.
Another major difference between Heikin Ashi and traditional candlesticks is how the prices are displayed. When using the Heikin Ashi chart, the candles begin from the middle of the candlestick.
This is different from the traditional candlestick chart where it starts from the level where the previous candlestick closed.
Heikin Ashi Calculation
Heikin Ashi shares some features with the normal candlestick charts.
The open-high-low-close (OHLC) candles of regular candlesticks are also present in Heikin Ashi techniques. However, Heikin Ashi uses an altered formula of close-open-high-low (COHL), which is;
Close = ¼ (Open + Close + Low + Close)
(The average price of the current bar)
Open = ½ (Open of Previous Bar + Close of Previous Bar)
(The midpoint of the previous bar)
High = Max [High, Open, Close]
Low = Min [Low, Open, Close]
How to Use Heikin Ashi to Identify Trends and Trend Strength
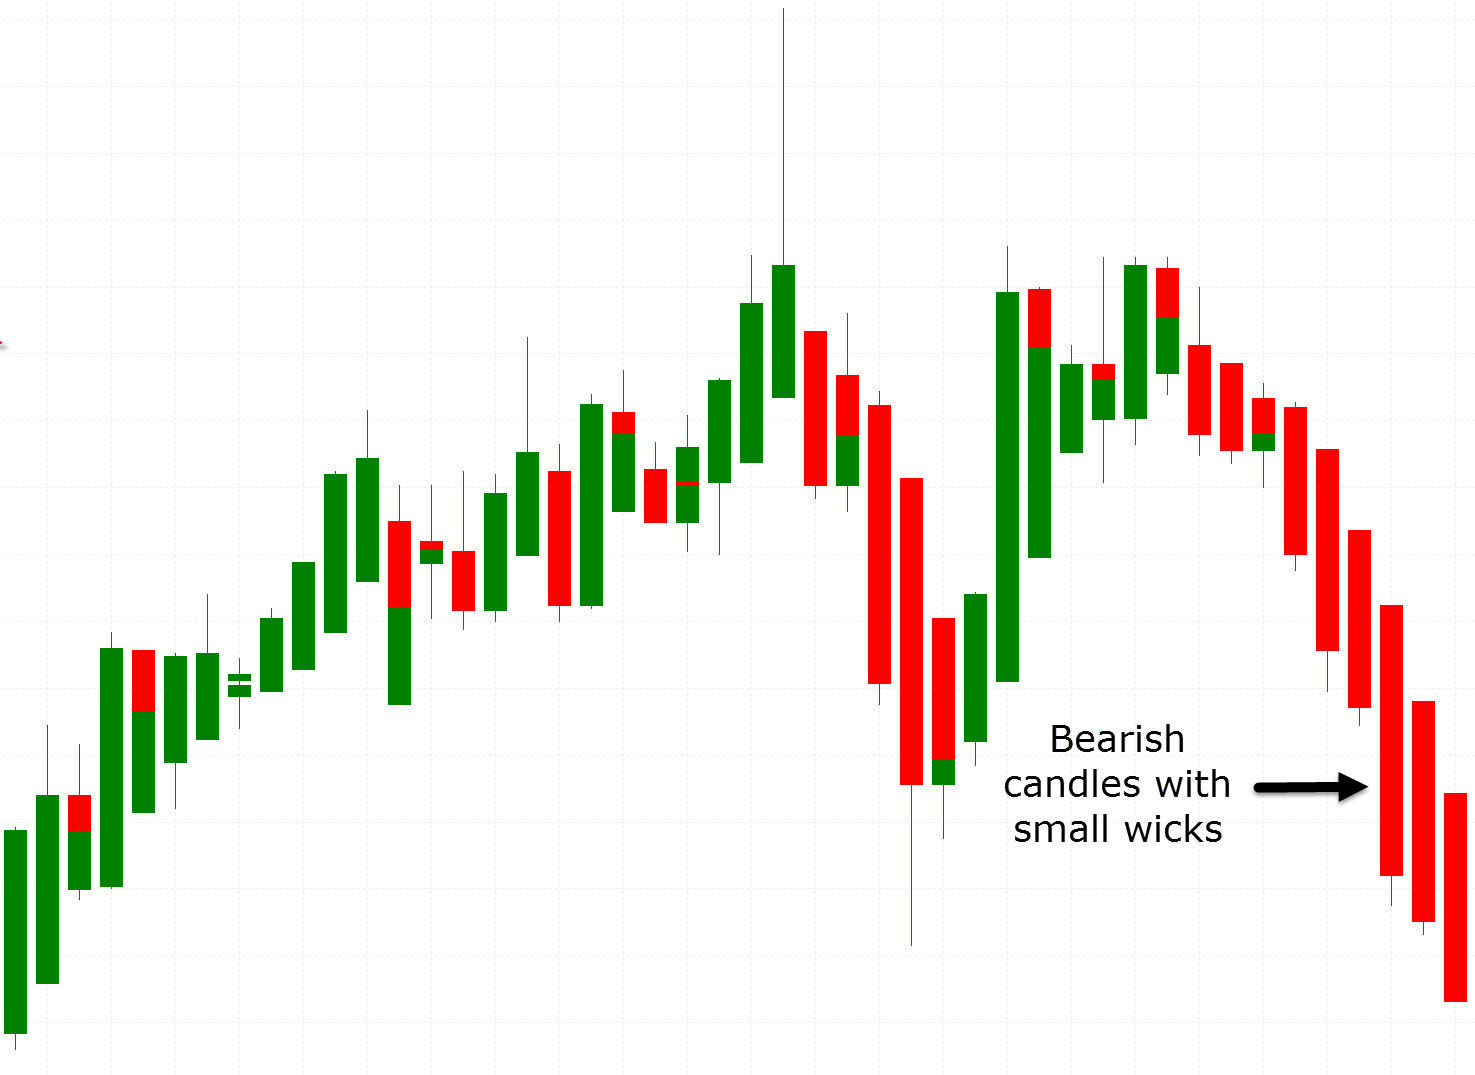
Because Heikin Ashi candlesticks are calculated using averages, the candlesticks have smaller shadows or wicks compared to the regular candlesticks. However, similar to the regular candlesticks, the smaller or shorter the shadow or wick in Heikin Ashi, the stronger the trend.
Heiken Ashi is designed to show you the direction of a trend with the help of its color-coded candles. A green candle indicates that the trend is up, while a red candle is a sign that the trend is down.
Green candles without upper shadows show a strong uptrend, while red candles without lower shadows indicate a strong downtrend.
A Heikin Ashi chart shows you the strength of the trend using the shadows or wicks and the amount of red or green candles that form in a row.
The major thing to keep an eye on when using a Heikin Ashi chart to determine the trend strength is wickless or shadowless candlesticks.
The candlesticks that don’t have a wick or shadow on one end are referred to as “shaved candles.” Depending on the end that lacks the shadow, there is a name for each type of a shaved candlestick.
Heikin Ashi Trading Strategy
The Heiken Ashi is an excellent trading strategy for reading the price action of assets and predicting future prices.
Whilst it is similar to the traditional candlestick charts, it differs in certain ways. Heikin Ashi helps eliminate unnecessary information to allow you to better identify market trends.
Below is an example of a simple strategy you could use to trade with the Heikin Ashi.
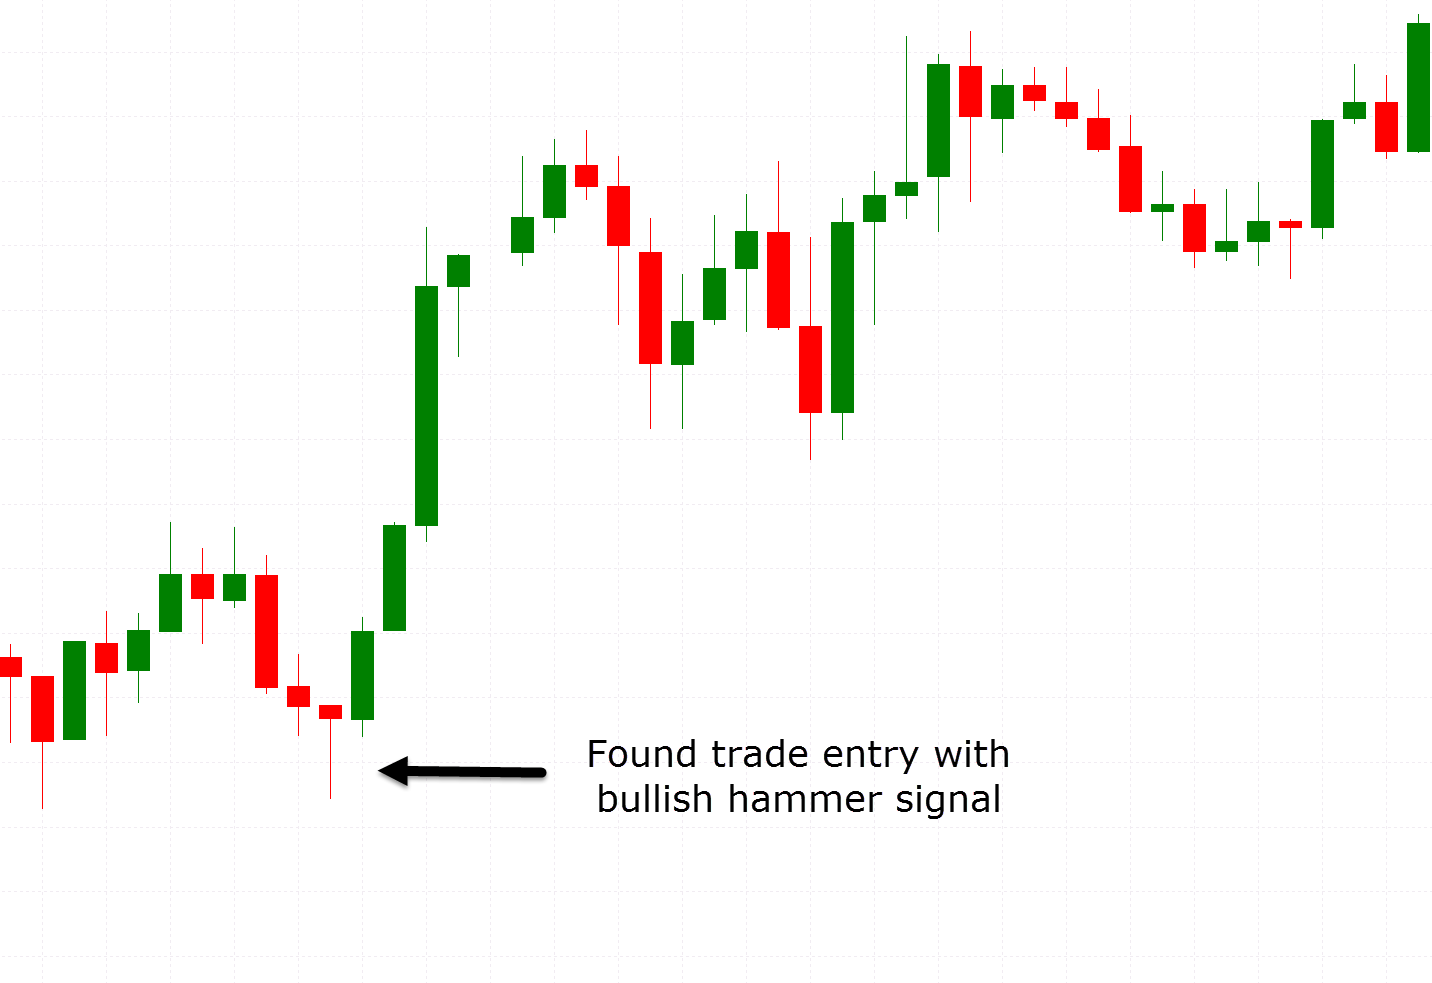
In the first chart example you find a trade to get long. This is using normal candlesticks and you enter with the trend higher when you find a bullish hammer pattern.
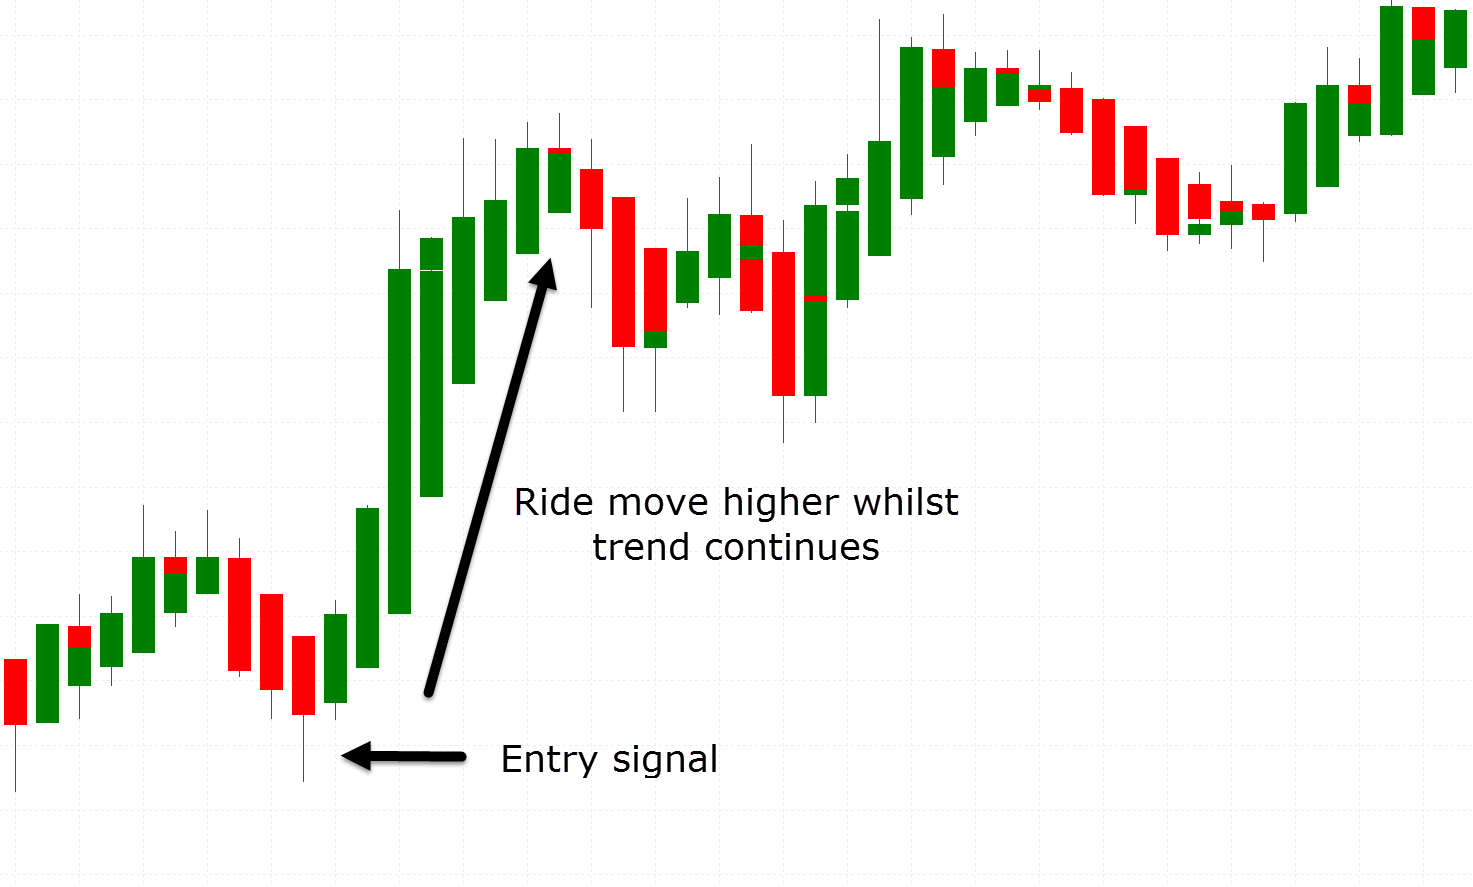
After you have entered you begin to monitor the Heikin Ashi charts for the trend and for your trade management. The chart below is the same pair and time frame, but instead of normal candlesticks it is the Heikin Ashi chart.
Heikin Ashi MT4 Indicator
This is a free indicator from MetaQuotes. The Heikin Ashi MT4 indicator comes with chart settings that allow you to choose how the chart should be displayed.
The charts support both colors and line graphs. You will get to set the time frame you wish to view along with being able to use it on any market or Forex pair.
The best way to understand this Heikin Ashi MT4 indicator is to take a hands on approach and play around with it.
You can read more about the MT4 Heikin Ashi indicator and download it here.
Heikin Ashi MT5 Indicator
MetaQuotes also has a free Heikin Ashi indicator for MT5 platform users.
The Heikin Ashi MT5 indicator looks like a candlestick chart. However, it has some differences. On the Heikin Ashi MT5 indicator, the color of the candlesticks depends on shadows.
Just like the MT4 indicator, the best way to familiarize yourself with this indicator is to play around with it on your demo charts.
You can read more about the Heikin Ashi MT5 Indicator and download it here.
Note: Don’t know how to install and use these indicators? Read How to Download, Install and Use MT4 and MT5 Indicators.
NOTE: Get your Heikin Ashi PDF Download Below.
